
|
시장보고서
상품코드
2062041
무역 관리 시장 : 점유율 분석, 업계 동향과 통계, 성장 예측(2026-2031년)Trade Management - Market Share Analysis, Industry Trends & Statistics, Growth Forecasts (2026 - 2031) |
||||||
 Mordor Intelligence
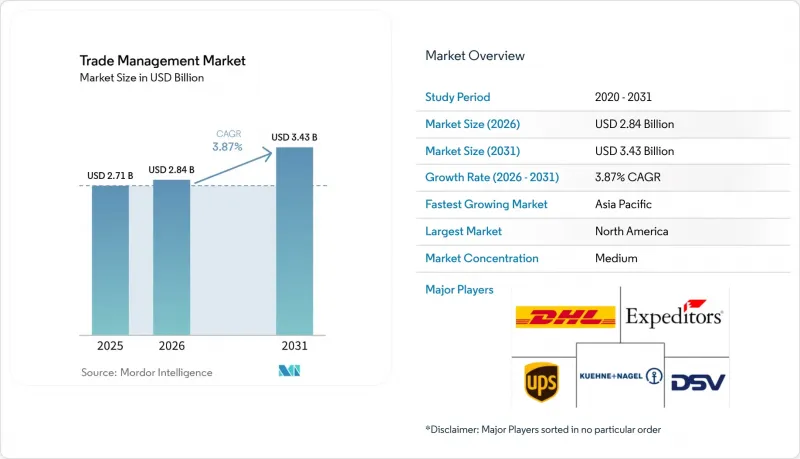
Mordor Intelligence에 의하면, 세계의 무역 관리 시장 규모는 2025년 27억 1,000만 달러, 2026년 28억 4,000만 달러에서 2031년까지 34억 3,000만 달러로 확대되어 2026년부터 2031년까지 연평균 복합 성장률(CAGR)은 3.87%를 나타낼 것으로 예측됩니다.
이러한 확대는 관세 변동, 전자 문서 의무화, 차세대 자유무역협정 등으로 인해 컴플라이언스 소프트웨어가 단순한 비용 센터에서 공급망의 관제탑으로 격상되고 있음을 반영합니다. 본 보고서는 서비스별(무역 규정 준수 관리, 통관 업무 등), 조직 규모별(대기업, 중소기업), 최종 사용자 산업별(제조업, 소매 및 전자상거래 등), 그리고 지역별(북미, 남미, 아시아태평양, 유럽, 중동 및 아프리카)로 분류되어 있습니다. 시장 전망은 금액(달러)으로 제시되어 있습니다.
세계 무역 관리 시장 동향과 인사이트
차세대 FTA(CPTPP, AfCFTA, DEPA)의 확대
초지역 협정은 관세 구조를 재편하고 있으며, 여러 관세 시나리오를 실시간으로 검증할 수 있는 체계가 요구되고 있습니다. RCEP만으로도 2030년까지 연간 2,450억 달러의 소득 증가를 가져오고 280만 개의 일자리를 창출할 것으로 예상되며, 이는 협정 이행에 대한 경제적 인센티브가 입증된 것입니다. CPTPP의 확대에 따라 중복되는 특혜 규정의 ‘복잡한 상황’이 더욱 심화되고 있습니다. 한편, AfCFTA에 따른 54개국의 관세 조화는 아프리카 전역에서 적응성이 높은 플랫폼에 대한 수요를 촉진하고 있습니다. DEPA는 종이 없는 무역 규범을 시범적으로 도입하고 있으며, 그 영향은 보다 광범위한 규제 청사진으로 확산되고 있습니다. 2024년 일본에서 RCEP 인증서가 급증한 것은 다층적인 공급망 전반에 걸쳐 부품의 조달 경로를 추적하는 기술에 대한 기업의 절실한 필요성을 입증하고 있습니다. 이러한 협정들은 전반적으로, 기업들이 수동적인 규정 준수를 넘어 수익 최적화로 전환함에 따라 전 세계 무역 관리 시장의 도입을 촉진하고 있습니다.
2022년 이후 관세 및 무역 구제 조치의 변동성 증가
예측 불가능한 관세 조치는 이제 제품 개발 주기보다 더 빠른 속도로 진행되고 있습니다. 공급망 담당 임원의 57%가 정책 변경을 2024년의 최대 과제로 꼽았습니다. 섹션 301 조치, EU의 세이프가드 조치, 인도의 변동 관세로 인해 기업들은 매주 도착 비용의 변동을 모델링할 수밖에 없게 되었습니다. 관세 인하 시나리오는 통관 시간 단축이라는 이점을 능가하지만, 이 두 가지 모두 통합된 데이터에 의존하고 있습니다. 다자간 합의가 약화되는 가운데, 기업들은 세계 트레이드 매니지먼트(GTM) 시장용 소프트웨어를 벌금을 피하기 위한 비용이라기보다는 조달 전략의 전환에 필요한 분석 도구로 인식하고 있습니다.
항만·세관 시스템 간 단절된 무역 데이터 표준
EDIFACT나 WCO 데이터 모델이 존재함에도 불구하고, 항만별 차이로 인해 공급업체는 수백 개에 달하는 맞춤형 어댑터를 개발할 수밖에 없습니다. 『아시아태평양 무역 원활화 보고서 2024』는 표준화를 통해 무역 비용을 13% 절감할 수 있다고 주장하고 있지만, 도입이 선택 사항이기 때문에 진전이 더딘 실정입니다. 벤더들은 추상화 계층을 구축하고 있으며, 이로 인해 개발 예산이 증가하고 벤더 종속 현상이 발생하여 전 세계 트레이드 매니지먼트 시장의 성장을 저해하고 있습니다.
부문별 분석
2025년, 무역 규정 준수 관리는 전 세계 무역 관리 시장의 39.88%를 차지하며, 모든 구매자에게 있어 핵심 기능으로서의 입지를 확고히 다졌습니다. 그럼에도 불구하고, 물류 및 운송 관리 시장은 2031년까지 연평균 성장률(CAGR) 5.51%를 기록하며 다른 모든 서비스를 앞지를 것으로 예상되는데, 이는 관세, 운송업체 및 마일스톤 관리의 통합에 대한 고객 수요가 증가하고 있음을 보여줍니다. DHL의 ‘Trend Radar’는 생성형 AI와 컴퓨터 비전을 현재 배송 단계의 규정 준수 워크플로에 통합된 최첨단 기술로 꼽고 있습니다. 정부 포털 사이트를 통한 직접 신고가 가능해짐에 따라 통관업자의 마진은 압박을 받고 있으며, 이에 따라 업체들은 부가가치가 더 높은 컨설팅 업무로 전환하고 있습니다.
또한, 밸류체인의 가시화 및 리스크 분석을 중심으로 하는 ‘기타’ 서비스 역시, 지정학적 변동이 실시간으로 발생함에 따라 지속적인 경로 재계산이 필요해짐에 따라 주목을 받고 있습니다. 관세 변동과 선박의 예상 도착 시각(ETA)을 함께 표시하는 통합 대시보드는 의사 결정의 신속화를 촉진하고, 업무 데이터와 규제 데이터의 통합을 한층 더 발전시키고 있습니다. 이러한 융합이 진행되는 가운데, 솔루션의 차별화는 현재 AI를 활용한 분류 엔진이나 즉시 사용 가능한 FTA 최적화 도구로 전환되고 있으며, 세계 무역 관리 시장에서 기존 독립형 솔루션의 가치는 점차 하락하고 있습니다.
지역별 분석
북미는 USMCA의 안정성과 충실한 수출 관리 컨텐츠 라이브러리에 힘입어 2025년 매출의 37.24%를 차지했습니다. 해당 지역에서 대기업의 우위는 높은 지속적인 라이선스 수익을 보장하고 있으며, 캐나다의 CARM 전환은 기존 시스템의 업그레이드 열풍을 일으키고 있습니다. 한편, 아시아태평양은 RCEP의 발효와 중국의 AI 주도형 통관 벤치마크를 배경으로 연평균 성장률(CAGR) 6.15%로 성장을 지속하고, 있습니다. 일본에서 증명서 발급이 급증한 것은 FTA 대응 플랫폼의 신속한 투자 수익률(ROI)을 입증하고 있으며, 관세 인하가 소프트웨어 투자의 재원이 된다는 점을 여실히 보여주고 있습니다.
유럽에서는 CBAM(국경조정조치) 및 ViDA(부가가치세 디지털화)를 통해 기업들이 관세에 탄소 지표와 실시간 부가가치세(VAT) 보고를 반영하도록 요구받고 있으며, 이를 통해 균형 잡힌 성장을 유지하고 있습니다. 스칸디나비아의 선행 도입 기업들은 ESG 모듈을 주요 입찰 프로젝트에 도입하고 있으며, 2027년 시행 예정인 영국의 CBAM 규정에 대비한 참고 설계를 확립하고 있습니다.
남미 및 중동 및 아프리카는 여전히 인프라 면에서 뒤처져 있지만, 아프리카 대륙 자유무역지대(AfCFTA)와 현대화 기금 덕분에 수요 증가가 예상됩니다. 전반적으로 볼 때, 무역량뿐만 아니라 각 지역의 디지털화 준비 상태가야말로 세계 무역 관리 시장의 보급 정도를 예측하는 요인이 됩니다.
기타 혜택:
- 엑셀 형식 시장 예측(ME) 시트
- 3개월간의 애널리스트 지원
자주 묻는 질문
목차
제1장 서론
제2장 조사 방법
제3장 주요 요약
제4장 시장 구도
제5장 시장 규모와 성장 예측
제6장 경쟁 구도
제7장 시장 기회와 향후 전망
JHS 26.06.19According to Mordor Intelligence, the global trade management market size is projected to expand from USD 2.71 billion in 2025 and USD 2.84 billion in 2026 to USD 3.43 billion by 2031, registering a CAGR of 3.87% between 2026 and 2031.
The expansion reflects how tariff volatility, mandatory e-documentation, and next-generation free-trade agreements elevate compliance software from a cost center to a supply-chain control tower. This report is Segmented by Services (Trade Compliance Management, Customs Brokerage, and More), by Organization Size (Large Enterprises, Small & Medium Enterprises), by End-User Industry (Manufacturing, Retail & E-Commerce, and More), and by Geography (North America, South America, Asia-Pacific, Europe, Middle East and Africa). The Market Forecasts are Provided in Terms of Value (USD).
Global Trade Management Market Trends and Insights
Proliferation Of Next-Generation FTAs (CPTPP, AfCFTA, DEPA)
Mega-regional agreements reshape duty structures, requiring engines that can test multiple tariff scenarios in real time. RCEP alone is modeled to deliver USD 245 billion in annual income gains by 2030 and create 2.8 million jobs, proving the monetary incentive for automated agreement matching. CPTPP enlargement multiplies the "noodle-bowl" of overlapping preference rules, while AfCFTA's 54-country customs alignment stimulates demand for adaptable platforms across Africa. DEPA pilots paperless trade norms that ripple into wider regulatory blueprints. Japan's rapid spike in RCEP certificates during 2024 validates enterprise urgency for technology that traces component sourcing across multi-tier chains. Collectively, these agreements elevate Global Trade Management market adoption as firms pivot from passive compliance to revenue optimization.
Escalating Tariff & Trade-Remedy Volatility Since 2022
Unpredictable levies now move quicker than product-development cycles. Fifty-seven percent of supply-chain executives ranked changing policies as their top 2024 challenge. Section 301 actions, EU safeguards, and India's sliding duties force companies to model landed-cost swings weekly. Duty-savings scenarios outshine clearance-time benefits, yet both depend on unified data. As multilateral consensus fades, enterprises view Global Trade Management market software less as a cost to avoid fines and more as analytics needed for sourcing shifts.
Fragmented Trade-Data Standards Among Ports & Customs Systems
Despite EDIFACT and WCO data models, port-level deviations force vendors to code hundreds of bespoke adapters. Asia-Pacific Trade Facilitation Report 2024 argues harmonization could shave 13 % off trade costs, yet voluntary uptake slows progress. Vendors create abstraction layers, inflating development budgets and causing lock-in, tempering Global Trade Management market velocity.
Other drivers and restraints analyzed in the detailed report include:
- Cloud-Native Customs Modernization Programs (UK CDS, Canada CARM)
- Global E-Invoicing / E-Document Mandates Accelerating Digitization
- Rising Cyber-Security & Ransomware Risks Across Connected Stacks
For complete list of drivers and restraints, kindly check the Table Of Contents.
Segment Analysis
Trade Compliance Management garnered 39.88 % of the Global Trade Management market share in 2025, confirming its role as baseline functionality for every buyer. Nevertheless, Logistics and Transportation Management is set to outpace all other services at a 5.51 % CAGR through 2031, signaling customer appetite for unified duty, carrier, and milestone control. DHL's Trend Radar cites generative AI and computer vision as edge technologies now embedded in shipment-level compliance workflows. Customs brokerage margins face compression where government portals enable direct filing, driving brokers toward higher-value consultancy.
Secondarily, "Others" services chiefly supply-chain visibility and risk analytics gain traction because real-time geopolitical shifts demand continuous routing recalculations. Integrated dashboards that show tariff swings alongside vessel ETAs accelerate decision timeliness, further merging operational and regulatory data layers. As convergence rises, solution differentiation now tilts toward AI-powered classification engines and out-of-the-box FTA optimizers, nudging legacy standalone offerings down the value ladder within the Global Trade Management market
Geography Analysis
North America generated 37.24 % of 2025 revenue, powered by USMCA stability and deep export-control content libraries. The region's large-enterprise dominance ensures high recurring license values, and Canada's CARM shift prompts a wave of in-place upgrades. Asia-Pacific, however, posts a 6.15 % CAGR on the back of RCEP's operational use and China's AI-driven customs benchmarks. Japan's certificate-issuance boom validates rapid ROI for FTA-aware platforms, underscoring how tariff savings finance software spend.
Europe sustains balanced growth as CBAM and ViDA force companies to overlay carbon metrics and real-time VAT reporting onto customs duties. Scandinavian early adopters pull ESG modules into mainstream tenders, setting a reference design for upcoming UK CBAM rules in 2027.
South America and the Middle East & Africa still trail on infrastructure, yet AfCFTA and modernization funds unlock incremental demand. Overall, regional digital readiness, not trade volume alone, predicts Global Trade Management market penetration.
- Livingston International
- Expeditors International of Washington, Inc.
- Kuehne Nagel
- DHL Group
- DSV
- Ceva Logistics
- Geodis
- C.H. Robinson Worldwide
- Nippon Express
- Sinotrans
- UPS Supply Chain Solutions
- Kintetsu World Express (KWE)
- GXO Logistics
- BDP International
- SEKO Logistics
- Hellmann Worldwide Logistics
- Dachser
- Fedex
- Rhenus Logistics
- Yusen Logistics (Part of NYK Line)*
Additional Benefits:
- The market estimate (ME) sheet in Excel format
- 3 months of analyst support
TABLE OF CONTENTS
1 Introduction
- 1.1 Study Assumptions & Market Definition
- 1.2 Scope of the Study
2 Research Methodology
3 Executive Summary
4 Market Landscape
- 4.1 Market Overview
- 4.2 Market Drivers
- 4.2.1 Proliferation of next-generation FTAs (CPTPP, AfCFTA, DEPA)
- 4.2.2 Escalating tariff & trade-remedy volatility since 2022
- 4.2.3 Cloud-native customs modernisation programmes (UK CDS, Canada CARM)
- 4.2.4 Global e-invoicing / e-document mandates accelerating digitisation
- 4.2.5 ESG-linked product-level traceability & Scope-3 carbon reporting
- 4.2.6 Tokenised Digital Product Passports for origin authentication
- 4.3 Market Restraints
- 4.3.1 Fragmented trade-data standards among ports & customs systems
- 4.3.2 Rising cyber-security & ransomware risks across connected GTM stacks
- 4.3.3 Protectionist export controls & FDI screening intensifying compliance load
- 4.3.4 Lag in quantum-secure cryptography readiness for cross-border data
- 4.4 Value / Supply-Chain Analysis
- 4.5 Regulatory Landscape
- 4.6 Technological Outlook
- 4.7 Porter's Five Forces
- 4.7.1 Threat of New Entrants
- 4.7.2 Bargaining Power of Suppliers
- 4.7.3 Bargaining Power of Buyers
- 4.7.4 Threat of Substitutes
- 4.7.5 Industry Rivalry
- 4.8 Other Structural Market Analysis
5 Market Size & Growth Forecasts (Value)
- 5.1 By Services
- 5.1.1 Trade Compliance Management
- 5.1.2 Customs Brokerage
- 5.1.3 Logistics and Transportation Management
- 5.1.4 Others (Supply Chain Visibility, Risk Management etc)
- 5.2 By Organization Size
- 5.2.1 Large Enterprises
- 5.2.2 Small & Medium Enterprises (SMEs)
- 5.3 By End-User Industry
- 5.3.1 Manufacturing
- 5.3.2 Retail & E-commerce
- 5.3.3 Pharmaceuticals and Healthcare
- 5.3.4 Energy & Utilities
- 5.3.5 Food & Beverage
- 5.3.6 Other Industries
- 5.4 By Geography
- 5.4.1 North America
- 5.4.1.1 United States
- 5.4.1.2 Canada
- 5.4.1.3 Mexico
- 5.4.2 South America
- 5.4.2.1 Brazil
- 5.4.2.2 Peru
- 5.4.2.3 Chile
- 5.4.2.4 Argentina
- 5.4.2.5 Rest of South America
- 5.4.3 Asia-Pacific
- 5.4.3.1 India
- 5.4.3.2 China
- 5.4.3.3 Japan
- 5.4.3.4 Australia
- 5.4.3.5 South Korea
- 5.4.3.6 South East Asia (Singapore, Malaysia, Thailand, Indonesia, Vietnam, and Philippines)
- 5.4.3.7 Rest of Asia-Pacific
- 5.4.4 Europe
- 5.4.4.1 United Kingdom
- 5.4.4.2 Germany
- 5.4.4.3 France
- 5.4.4.4 Spain
- 5.4.4.5 Italy
- 5.4.4.6 BENELUX (Belgium, Netherlands, and Luxembourg)
- 5.4.4.7 NORDICS (Denmark, Finland, Iceland, Norway, and Sweden)
- 5.4.4.8 Rest of Europe
- 5.4.5 Middle East and Africa
- 5.4.5.1 United Arab of Emirates
- 5.4.5.2 Saudi Arabia
- 5.4.5.3 South Africa
- 5.4.5.4 Nigeria
- 5.4.5.5 Rest of Middle East And Africa
- 5.4.1 North America
6 Competitive Landscape
- 6.1 Market Concentration
- 6.2 Strategic Moves
- 6.3 Market Share Analysis
- 6.4 Company Profiles (includes Global level Overview, Market level overview, Core Segments, Financials as available, Strategic Information, Market Rank/Share for key companies, Products & Services, and Recent Developments)
- 6.4.1 Livingston International
- 6.4.2 Expeditors International of Washington, Inc.
- 6.4.3 Kuehne Nagel
- 6.4.4 DHL Group
- 6.4.5 DSV
- 6.4.6 Ceva Logistics
- 6.4.7 Geodis
- 6.4.8 C.H. Robinson Worldwide
- 6.4.9 Nippon Express
- 6.4.10 Sinotrans
- 6.4.11 UPS Supply Chain Solutions
- 6.4.12 Kintetsu World Express (KWE)
- 6.4.13 GXO Logistics
- 6.4.14 BDP International
- 6.4.15 SEKO Logistics
- 6.4.16 Hellmann Worldwide Logistics
- 6.4.17 Dachser
- 6.4.18 Fedex
- 6.4.19 Rhenus Logistics
- 6.4.20 Yusen Logistics (Part of NYK Line)*