
|
시장보고서
상품코드
2062137
원소 불소 : 시장 점유율 분석, 업계 동향 및 통계, 성장 예측(2026-2031년)Elemental Fluorine - Market Share Analysis, Industry Trends & Statistics, Growth Forecasts (2026 - 2031) |
||||||
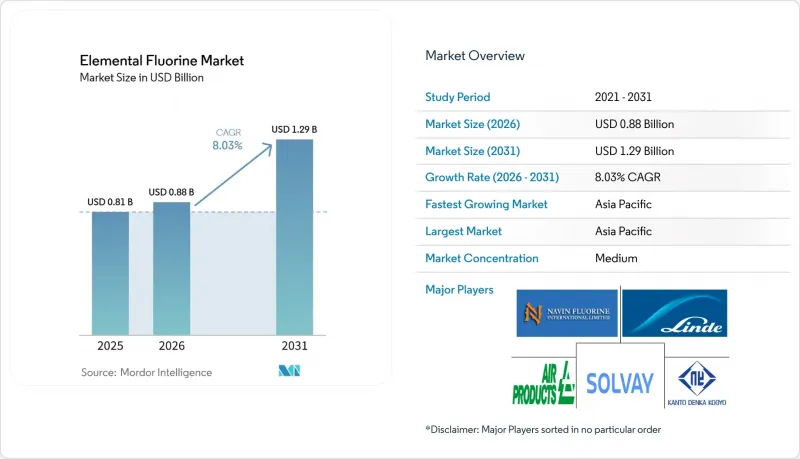
Mordor Intelligence에 의하면, 원소 불소 시장 규모는 2025년에 8억 1,000만 달러로 평가되었습니다. 2026년에 8억 8,000만 달러에 달하고, 2031년까지 12억 9,000만 달러에 이를 것으로 예측되며, 2026-2031년에 걸쳐 CAGR은 8.03%를 나타낼 전망입니다.
본 보고서는 유형(α-불소 및 β-불소), 용도(일렉트로믹스 및 반도체, 에너지·원자력, 육불화황, 화학 처리, 기타), 지역(아시아·태평양, 북미, 유럽, 남미, 중동 및 아프리카)별로 분류되어 있습니다. 시장 전망은 금액(달러) 기준으로 제시되어 있습니다.
세계의 원소 불소 시장 동향 및 분석
핵연료용 육불화우라늄(UF6)의 전환·농축 능력 확대
첨단 원자로가 시범 운영 단계에서 초기 상업화 단계로 넘어감에 따라, 정부 지원 농축 프로젝트로 인해 불소 소비량이 증가하고 있습니다. 센트러스 에너지(Centrus Energy)의 오하이오주 피케톤 거점은 2026년에 체결된 다년간의 엔지니어링 계약에 따라 수천 대의 원심분리기를 도입하며 확장을 추진하고 있으며, 이 시설은 미국 서부에서 유일하게 고농축 및 저농축 우라늄(LEU) 연료 공급 허가를 취득한 거점이 될 전망입니다. 저농축 우라늄(LEU) 1Kg당 UF4에서 UF6로 전환하는 과정에서 원소 불소가 필요하기 때문에 원자력 발전 능력과 불소 수요는 직접적으로 연관되어 있습니다. 프랑스와 인도에서 이루어지고 있는 이와 같은 생산 능력 확대는 중기적인 수요 전망을 더욱 공고히 하고 있습니다. 원자력 규격에 부합하는 순도 등급을 공급하는 업체들은 10년 단위공급 계약을 체결하고 있으며, 이것이 새로운 전해조 투자에 힘을 실어주고 있습니다.
플라스틱, LCD 및 OLED 디스플레이의 에칭 세정 분야에서의 성장
2025년 기준으로 LG디스플레이 매출의 61%를 OLED가 차지했으며, 이 회사는 2027년까지 패널 생산 라인을 확대하기 위해 9억 7,000만 달러를 투자하고 있습니다. 첨단 디스플레이 기술에는 여러 단계의 건식 에칭 공정이 필요하며, 이 과정에서 불소 함유 가스가 하층을 손상시키지 않으면서 폴리머 잔류물을 제거합니다. 5nm 노드 이하의 반도체 팹에서는 GWP(지구온난화지수)가 0이라는 특성 덕분에 챔버 세척에 원소 불소가 채택되고 있으며, 이를 통해 스코프 1 배출량 목표 달성에 기여하고 있습니다. 이러한 동향은 특히 아시아태평양에 집중되어 있으며, 이 지역에서는 신규 디스플레이 및 반도체 생산 능력의 80% 이상이 건설 중이며, 이것이 원소 불소 시장의 가장 큰 단기 성장 요인으로 작용하고 있습니다.
불소 전해 제조 공장의 높은 설비 투자(Capex)와 운영비(Opex)
전해조에는 니켈·구리 합금, 이중벽 배관, 연속 가스 모니터링 시스템 등 특수한 자재가 필요하며, 대규모 시설의 경우 설치 비용이 1,000만 달러를 초과합니다. 유럽에서는 아시아의 공장에 비해 전기 요금이 비싸기 때문에 변동비가 더욱 증가하여 국내에서의 확장이 제한되는 한편, 반제품인 중간재를 아시아로 되돌려 위탁 생산을 진행하는 움직임이 활발해지고 있습니다.
부문별 분석
a-불소는 2025년에 원소 불소 시장 점유율의 70.78%를 차지했습니다. 이는 핵연료 전환 및 반도체 챔버 세정에 사용되는 오랜 기간 확립된 인프라에 기반을 둔 것입니다. 이 부문은 안정적인 고객 기반, 검증된 비활성화 프로토콜, 쉽게 구할 수 있는 분석용 표준 물질의 이점을 누리고 있습니다.
B-불소는 규모는 작지만, 2031년까지 연평균 성장률(CAGR) 8.24%를 나타낼 것으로 전망됩니다. 선택적 불소화 과정에서 나타나는 이 물질의 독창적인 반응성은 배터리 및 제약 분야의 혁신 기업들로부터 점점 더 높은 평가를 받고 있습니다. 생산 규모가 확대됨에 따라 B-불소가 원소 불소 시장 규모에서 차지하는 비중은 증가할 것으로 예상되지만, 예측 기간 동안 a-불소가 우위를 유지할 가능성이 높은 것으로 보입니다.
지역별 분석
아시아태평양은 디스플레이, 반도체, 전기차(EV)공급망이 집중되어 있어, 2025년에는 전 세계 매출의 54.45%를 차지했습니다. Dongyue 등 중국 제조업체들은 1억 9,190만 홍콩 달러를 칩 제조 공장에 사용될 고순도 PTFE 및 저 GWP 냉매 생산을 가능하게 하는 테트라플루오로프로파일렌 시범 생산 라인에 재할당하고 있습니다. 한국의 OLED 생산 확대와 일본의 파인 가스 분야 투자가 해당 지역의 위상을 더욱 공고히 하고 있어, 아시아태평양은 2031년까지 연평균 성장률(CAGR) 8.95%를 유지할 것으로 전망됩니다.
북미에서는 ‘CHIPS법’에 따라 애리조나주와 텍사스주의 팹이 지원 대상이 되었으며, 또한 ‘인플레이션 억제법’에 따라 남동부 지역의 배터리 재료 프로젝트가 자리를 잡아가고 있는 만큼, 전략적 중요성을 되찾아가고 있습니다. 센트라스 에너지사의 피케톤 HALEU 프로젝트만 해도, 수년에 걸쳐 핵연료 혼합용 불소 원료를 공급하게 될 것입니다. 국내 형석 부족 현상은 여전히 지속되고 있으며, 무수 불화수소(HF) 원료의 대부분은 여전히 멕시코와 중국에서 수입되고 있기 때문에 생산자들은 멕시코만 연안 지역에 HF 공장을 함께 건설하는 방향으로 나아가고 있습니다.
유럽은 전력 가격 급등과 엄격한 F가스 할당이라는 이중의 압박에 직면해 있습니다. 산업용 가스 분야의 주요 기업들은 독일이나 아일랜드에 있는 기존 시설을 확장하는 것을 선호하지만, 많은 냉매 및 PVDF의 생산 확대는 운영 비용 위험을 줄이기 위해 켄튀르키예주나 장쑤성으로 이전되고 있습니다. 무수 불화수소의 수입 비용이 높기 때문에 유럽은 구조적으로 불리한 입장에 놓여 있으며, 저 GWP 화학물질에 대한 규제상의 인센티브가 있음에도 불구하고 원소 불소 시장의 성장률은 세계 평균보다 낮습니다.
기타 혜택
- 엑셀 형식 시장 예측(ME) 시트
- 3개월간의 애널리스트 지원
자주 묻는 질문
목차
제1장 서론
제2장 조사 방법
제3장 주요 요약
제4장 시장 구도
제5장 시장 규모 및 성장 예측
제6장 경쟁 구도
제7장 시장 기회 및 향후 전망
KTH 26.06.22According to Mordor Intelligence, the elemental fluorine market size is projected to be USD 0.81 billion in 2025, USD 0.88 billion in 2026, and reach USD 1.29 billion by 2031, growing at a CAGR of 8.03% from 2026 to 2031.

This report is Segmented by Type (a-Fluorine and B-Fluorine), Application (Electronics and Semiconductors, Energy and Nuclear, Sulfur Hexafluoride, Chemical Processing, and Other Applications), and Geography (Asia-Pacific, North America, Europe, South America, and Middle-East and Africa). The Market Forecasts are Provided in Terms of Value (USD).
Global Elemental Fluorine Market Trends and Insights
Expansion of UF6 Conversion/Enrichment Capacity for Nuclear Fuel
Government-supported enrichment projects are increasing fluorine consumption as advanced reactors transition from pilot phases to early commercial deployment. Centrus Energy's Piketon, Ohio site is expanding with thousands of centrifuges under a multi-year engineering contract awarded in 2026, positioning the facility as the West's only licensed source of high-assay LEU fuel. Each kilogram of LEU requires elemental fluorine during the UF4-to-UF6 conversion process, directly linking nuclear capacity to fluorine demand. Similar capacity expansions in France and India are further strengthening mid-term demand visibility. Suppliers offering nuclear-qualified purity grades are securing decade-long offtake agreements, which support investments in new electrolyzers.
Growth in Plastics, LCD and OLED Display Etching/Cleaning Uses
OLED penetration accounted for 61% of LG Display's revenue in 2025, with the company investing USD 970 million to expand panel production lines through 2027. Advanced display technologies require multiple dry-etch processes, where fluorinated gases remove polymeric residues without damaging underlying layers. Semiconductor fabs operating below the 5 nm node are adopting elemental fluorine for chamber cleaning due to its zero-GWP properties, which help meet Scope 1 emissions targets. These trends are particularly concentrated in the Asia-Pacific region, where over 80% of new display and semiconductor capacity is under construction, representing the largest near-term growth driver for the elemental fluorine market.
High Capex/Opex for Fluorine Electrolysis Production Plants
Electrolyzer cells require specialized materials such as nickel-copper alloys, double-walled piping, and continuous gas monitoring systems, driving installed costs above USD 10 million for large facilities. In Europe, high electricity tariffs further increase variable costs compared to Asian plants, limiting domestic expansion and encouraging the tolling of semi-finished intermediates back to Asia.
Other drivers and restraints analyzed in the detailed report include:
- Regulatory Phase-Down of High-GWP NF3 Favoring F2 Adoption
- On-Site Modular Fluorine Generators Reducing Logistics Risk
- Limited Global Supply of Battery-Grade Anhydrous HF Feedstock
For complete list of drivers and restraints, kindly check the Table Of Contents.
Segment Analysis
a-Fluorine accounted for 70.78% of the elemental fluorine market share in 2025, supported by long-established infrastructure used for nuclear fuel conversion and semiconductor chamber cleaning. This segment benefits from a stable customer base, proven passivation protocols, and readily available analytical standards.
B-Fluorine is projected to grow at a CAGR of 8.24% through 2031, albeit from a smaller base. Its unique reactivity for selective fluorination is increasingly valued by battery and pharmaceutical innovators. As production scales up, B-Fluorine's contribution to the elemental fluorine market size is expected to increase, though a-Fluorine is likely to retain its dominance through the forecast period.
Geography Analysis
Asia-Pacific controlled 54.45% of global revenue in 2025 thanks to the clustering of display, semiconductor, and EV supply chains. Chinese producers such as Dongyue are redirecting HK$191.9 million into high-purity PTFE for chip fabs and pilot tetrafluoropropylene lines that enable low-GWP refrigerants South Korean OLED expansions and Japanese fine-gas investments further strengthen the region's position, keeping Asia-Pacific on an 8.95% CAGR trajectory through 2031.
North America is regaining strategic weight as the CHIPS Act subsidizes fabs in Arizona and Texas, while the Inflation Reduction Act anchors battery-material projects in the Southeast. Centrus Energy's Piketon HALEU project alone creates a multiyear fluorine feed for nuclear fuel blending. Domestic fluorspar scarcity persists, so most anhydrous HF feedstock still ships from Mexico and China, nudging producers toward co-located HF plants on the Gulf Coast.
Europe faces the twin pressures of elevated electricity pricing and stringent F-gas quotas. Industrial-gas majors prefer brownfield expansions in Germany and Ireland, but many refrigerant and PVDF expansions are moving to Kentucky or Jiangsu to cap opex exposure. High anhydrous HF import costs place Europe at a structural disadvantage, keeping its Elemental fluorine market growth below the global mean despite regulatory incentives for low-GWP chemistries.
- Air Liquide
- Air Products and Chemicals, Inc.
- Arkema
- Central Glass Co., Ltd.
- DAIKIN INDUSTRIES, Ltd.
- Deepak Nitrite Limited
- DONGYUE GROUP
- F2 Chemicals Ltd.
- Inhance Technologies
- KANTO DENKA KOGYO CO., LTD.
- Linde PLC
- Messer SE & Co. KGaA
- Navin Fluorine International Limited
- Pelchem SOC Ltd.
- Resonac
- Solvay
- The Chemours Company
Additional Benefits:
- The market estimate (ME) sheet in Excel format
- 3 months of analyst support
TABLE OF CONTENTS
1 Introduction
- 1.1 Study Assumptions and Market Definition
- 1.2 Scope of the Study
2 Research Methodology
3 Executive Summary
4 Market Landscape
- 4.1 Market Overview
- 4.2 Market Drivers
- 4.2.1 Expansion of UF6 conversion/enrichment capacity for nuclear fuel
- 4.2.2 Growth in plastics, LCD and OLED display etching/cleaning uses
- 4.2.3 Regulatory phase-down of high-GWP NF3 favouring F2 adoption
- 4.2.4 On-site modular fluorine generators reducing logistics risk
- 4.2.5 Emerging use of high-purity F2 as lithium-ion battery electrolyte additive
- 4.3 Market Restraints
- 4.3.1 High capex/opex for fluorine electrolysis production plants
- 4.3.2 Limited global supply of battery-grade anhydrous HF feedstock
- 4.3.3 Shortage of certified fluorine-handling technicians
- 4.4 Value Chain Analysis
- 4.5 Porter's Five Forces Analysis
- 4.5.1 Bargaining Power of Suppliers
- 4.5.2 Bargaining Power of Buyers
- 4.5.3 Threat of New Entrants
- 4.5.4 Threat of Substitutes
- 4.5.5 Competitive Rivalry
5 Market Size and Growth Forecasts (Value)
- 5.1 By Type
- 5.1.1 a- Fluorine
- 5.1.2 B- Fluorine
- 5.2 By Application
- 5.2.1 Electronics and Semiconductors
- 5.2.2 Energy and Nuclear
- 5.2.3 Sulfur Hexafluoride
- 5.2.4 Chemical Processing
- 5.2.5 Other Applications
- 5.3 By Geography
- 5.3.1 Asia-Pacific
- 5.3.1.1 China
- 5.3.1.2 India
- 5.3.1.3 Japan
- 5.3.1.4 South Korea
- 5.3.1.5 ASEAN Countries
- 5.3.1.6 Rest of Asia-Pacific
- 5.3.2 North America
- 5.3.2.1 United States
- 5.3.2.2 Canada
- 5.3.2.3 Mexico
- 5.3.3 Europe
- 5.3.3.1 Germany
- 5.3.3.2 United Kingdom
- 5.3.3.3 France
- 5.3.3.4 Italy
- 5.3.3.5 Spain
- 5.3.3.6 Russia
- 5.3.3.7 NORDIC Countries
- 5.3.3.8 Rest of Europe
- 5.3.4 South America
- 5.3.4.1 Brazil
- 5.3.4.2 Argentina
- 5.3.4.3 Rest of South America
- 5.3.5 Middle-East and Africa
- 5.3.5.1 Saudi Arabia
- 5.3.5.2 South Africa
- 5.3.5.3 Rest of Middle-East and Africa
- 5.3.1 Asia-Pacific
6 Competitive Landscape
- 6.1 Market Concentration
- 6.2 Strategic Moves
- 6.3 Market Share (%)/Ranking Analysis
- 6.4 Company Profiles (includes Global level Overview, Market level overview, Core Segments, Financials as available, Strategic Information, Products and Services, and Recent Developments)
- 6.4.1 Air Liquide
- 6.4.2 Air Products and Chemicals, Inc.
- 6.4.3 Arkema
- 6.4.4 Central Glass Co., Ltd.
- 6.4.5 DAIKIN INDUSTRIES, Ltd.
- 6.4.6 Deepak Nitrite Limited
- 6.4.7 DONGYUE GROUP
- 6.4.8 F2 Chemicals Ltd.
- 6.4.9 Inhance Technologies
- 6.4.10 KANTO DENKA KOGYO CO., LTD.
- 6.4.11 Linde PLC
- 6.4.12 Messer SE & Co. KGaA
- 6.4.13 Navin Fluorine International Limited
- 6.4.14 Pelchem SOC Ltd.
- 6.4.15 Resonac
- 6.4.16 Solvay
- 6.4.17 The Chemours Company
7 Market Opportunities and Future Outlook
- 7.1 White-space and Unmet-need Assessment
