

|
시장보고서
상품코드
2063232
스타디움 보안 시장 : 시장 점유율 분석, 업계 동향 및 통계, 성장 예측(2026-2031년)Stadium Security - Market Share Analysis, Industry Trends & Statistics, Growth Forecasts (2026 - 2031) |
||||||
 Mordor Intelligence
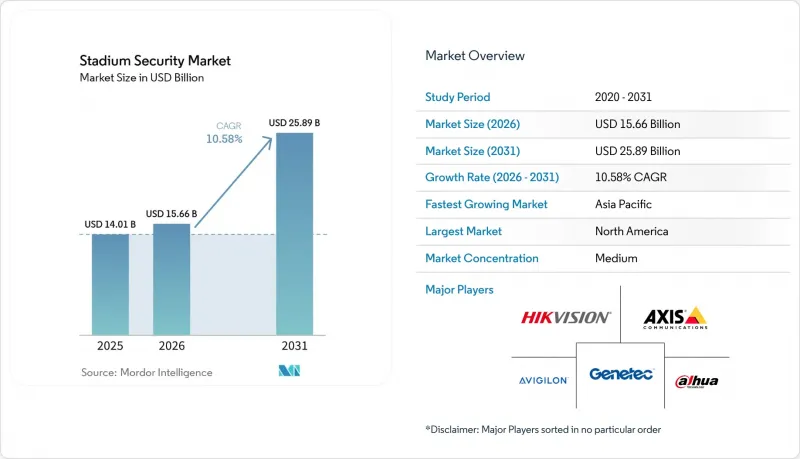
Mordor Intelligence에 의하면, 스타디움 보안 시장 규모는 2025년 140억 1,000만 달러로 평가되었고, 2026년 156억 6,000만 달러로 추정되고, 2031년까지 258억 9,000만 달러로 확대될 전망이며, 2026-2031년 연평균 복합 성장률(CAGR)은 10.58%를 나타낼 것으로 예측됩니다.
본 보고서는 구성 요소별(하드웨어, 소프트웨어, 서비스), 솔루션 유형별(비디오 감시 시스템, 출입 통제 시스템 등), 도입 모델별(온프레미스, 클라우드 기반), 경기장 수용 인원별(30,000석 미만, 30,000-50,000석, 50,000석 초과), 지역별(북미, 아시아태평양, 기타)로 분류되어 있습니다. 시장 전망은 금액(달러) 기준으로 제시되어 있습니다.
세계의 경기장 보안 시장 동향 및 분석
테러 위협의 고조로 인해 보안 규정 준수 의무화가 가속화되고 있습니다.
2024년 7월 코파 아메리카에서 발생한 경기장 난입 사건은 주변 경비의 취약성과 정보 수집의 미비를 드러냈으며, 규제 당국이 주최 계약에 보안 조항을 포함하도록 촉구했습니다. FEMA(미국 연방재난관리청)는 무기 감지, 드론 대응, 사이버 보안 분야의 각 단계별 목표 달성을 조건으로 6억 2,500만 달러의 보조금을 지원하며, 당초 5년 계획이었던 해당 시설의 구축 일정을 18개월로 단축할 것을 요구했습니다. 보험사들은 현재 보험료 할인을 AI 분석 및 생체 인증을 통한 접근 제어 도입 현황과 연계하고 있어, 소비가 위축되는 시기에도 안정적인 수요 기반을 확보하고 있습니다.
실시간 위협 감지를 위한 AI 기반 영상 분석의 급속한 확산
방치된 수하물, 급증하는 인파, 무기 특징을 감지하는 AI 영상 분석 시스템이 시범 운영 단계에서 본격적인 도입 단계로 넘어가고 있습니다. Convergint사는 물체 인식 소프트웨어를 통합하여 미국 내 여러 행사장에서 관제실 인력을 60% 감축했습니다. 로열 챌린저스 벵갈루루는 2026년 1월, 혼잡 예측 경보 및 얼굴 인식 기능을 위해 300대 이상의 AI 카메라를 도입하며, 아시아태평양에서의 획기적인 도입 진전을 보여주고 있습니다.
통합 보안 제품군을 도입하려면 막대한 초기 설비 투자가 필요합니다.
4만 명을 수용할 수 있는 중규모 경기장에서는 AI 카메라, 생체 인식, 침입 감지 센서 및 통합 지휘 센터에 800만-1,200만 달러의 예산을 배정하고 있습니다. 그러나 이러한 경기장에서는 예산 제약으로 인해 장비를 단계적으로 도입하는 경우가 많아, 그 결과 보안상의 취약점이 발생하고 투자 수익률(ROI)이 저하되고 있습니다. 보안 업그레이드에 대한 이러한 단편적인 접근 방식으로는 취약점이 장기간 방치될 가능성이 있습니다. 남미나 아프리카 등 지역에서는 운영 사업자들이 단계적인 업그레이드나 MaaS(Managed Security as a Service) 솔루션을 도입하는 경향이 강해지고 있습니다. 이러한 전략을 통해 일정한 운영 안정성을 유지하면서도 막대한 초기 설비 투자를 피할 수 있습니다. 또한, 이러한 접근 방식은 시간이 지남에 따라 변화하는 보안 요구 사항에 유연하게 대응할 수 있게 해줍니다.
부문별 분석
2025년 시점에서 카메라, 회전식 개찰구, 주변 센서를 배경으로 하드웨어가 경기장 보안 시장의 61.63%를 차지했으나, 경기장 측이 통합, 24시간 감시, 규정 준수 감사를 외부에 위탁함에 따라 서비스 부문은 2031년까지 연평균 성장률(CAGR) 10.78%로 시장 확대를 주도하고 있습니다. 이러한 변화는 사내 IT 전문 지식이 부족하여 알고리즘 조정이나 사고 대응을 위해 구독 모델로 전환하는 수용 인원 3만 명 미만의 시설에서 가장 두드러지게 나타납니다.
이 서비스 분야의 급속한 성장은 Genetec과 Convergint가 제공하는 관리형 보안 번들 서비스와 맥을 같이하며, 이러한 서비스는 자본 지출형 매출을 정기 수익형으로 전환하고 있습니다. 한편, 소프트웨어는 이 두 흐름의 중간에 위치하며, 영상 관리 라이선싱 및 예측형 군중 관리 모듈을 통해 IP 카메라로의 전환을 수익화하고 있습니다. Evolv Technologies의 '스캔당 수하물 검사 요금'은 공급업체가 어떻게 소비 중심 경제 모델로 전환하고, 빈번한 업데이트 주기 없이 고객 생애 가치(CLV)를 확대하고 있는지를 보여줍니다.
2025년, 경기장 보안 시장에서 비디오 감시가 43.28%를 차지했으며, 카메라가 주요 보안 수단으로서의 입지를 확고히 다졌습니다. 사이버 보안 시장은 점유율은 작지만, 랜섬웨어, 분산 서비스 거부(DDoS) 공격의 위험, 그리고 OT 네트워크의 취약성이 이벤트의 지속성을 위협하고 있어 연평균 성장률(CAGR) 10.91%로 급속히 확대되고 있습니다. Fortinet은 FC 바르셀로나에서 티켓 판매, POS, 모니터링 네트워크의 보안을 담당하고 있으며, 한편 Nozomi Networks는 HVAC 컨트롤러의 이상 트래픽을 모니터링하고 있습니다.
출입 통제, 경계 감지 및 경보 플랫폼은 중동 경기장에서 생체 인증이 의무화되고, 경기장 울타리에서 500미터 떨어진 곳까지 보호 범위를 확대하는 자동 PTZ 레이더 추적 기술의 지원에 힘입어, 안정적인 한 자릿수 중반대의 성장세를 보이고 있습니다. 보험사는 연례 침투 테스트를 의무화하고 있으며, 이로 인해 사이버 보안 요구 사항이 임대 계약이나 후원 계약에 사실상 포함되고 있습니다.
지역별 분석
2025년 북미는 경기장 보안 시장에서 38.55%의 점유율을 유지했습니다. 이는 FEMA(연방재난관리청)의 자금 지원, NFL 및 메이저리그 베이스볼의 보안 요건, 그리고 탄탄한 통합업체 생태계에 힘입은 결과입니다. 메트라이프 스타디움, 소피 스타디움, AT&T 스타디움은 모두 2026년 FIFA 월드컵을 앞두고 AI 분석 시스템, 생체 인식 게이트, 드론 감지 레이더로 시스템을 업그레이드했습니다. 캐나다와 멕시코의 경기장에서도 비슷한 추세가 나타나고 있으며, Axis Communications는 에스타디오 아스테카에 차량 번호판 인식 및 얼굴 인식 시스템을 도입했습니다.
아시아태평양은 연평균 성장률(CAGR) 11.31%를 기록하며 가장 빠르게 성장하고 있는 지역입니다. 로열 챌린저스 방갈로르의 2026년 1월 카메라 도입 프로젝트와 중국이 자금을 지원하는 동남아시아에서의 사업은 신규 건설 시 아날로그 시스템이 완전히 배제되고 있음을 여실히 보여주고 있습니다. 호주는 2032년 브리즈번 올림픽을 앞두고 UAS(무인 항공기) 대응 시스템을 도입하고 있으며, 일본은 응급 서비스를 위해 경기장 네트워크를 스마트 시티 인프라망에 통합하고 있습니다. 데이터 보호 관련 규제의 불일치는 여전히 불확실한 요소이며, 특히 인도의 경우 전국적인 생체 인식 관련 규정이 아직 확정되지 않은 상태입니다.
유럽, 중동 및 아프리카에서는 그 성장세에 차이가 보입니다. GDPR(EU 개인정보보호규정)에 따른 과징금이 스페인과 덴마크에서 생체 인식 도입을 억제하고 있지만, 파리 생제르맹의 개인정보 보호형 얼굴 인식 분석은 상업적인 해결책을 제시하고 있습니다. 사우디아라비아 정부의 자금 지원을 받는 15개 경기장 건설 계획은 중동에서 이 분야의 급속한 확산을 촉진하는 한편, 남미에서는 코파 아메리카에서 발생한 정보 유출 사건을 계기로 신뢰 회복이 진행되고 있으며, 브라질과 아르헨티나에서는 QR 코드 티켓 확인 및 경비원 증원이 의무화되었습니다. 아프리카의 행사장에서는 재정적 제약 속에서 단계적인 업그레이드를 우선시하며, 이를 착실히 추진하고 있습니다.
기타 혜택 :
- 엑셀 형식 시장 예측(ME) 시트
- 3개월간의 애널리스트 지원
자주 묻는 질문
목차
제1장 서론
제2장 조사 방법
제3장 주요 요약
제4장 시장 구도
제5장 시장 규모 및 성장 예측
제6장 경쟁 구도
제7장 시장 기회 및 향후 전망
AJY 26.06.22According to Mordor Intelligence, the stadium security market size is projected to expand from USD 14.01 billion in 2025 and USD 15.66 billion in 2026 to USD 25.89 billion by 2031, registering a CAGR of 10.58% between 2026 to 2031.
This report is Segmented by Component (Hardware, Software, and Services), Solution Type (Video Surveillance Systems, Access Control Systems, and More), Deployment Model (On-Premise, and Cloud-Based), Stadium Capacity (Less Than 30, 000 Seats, 30, 000-50, 000 Seats, and Greater Than 50, 000 Seats), and Geography (North America, Asia-Pacific, and More). The Market Forecasts are Provided in Terms of Value (USD).
Global Stadium Security Market Trends and Insights
Heightened Terrorism Threat Accelerating Mandatory Security Compliance
The July 2024 Copa America pitch invasion exposed perimeter weaknesses and intelligence gaps, motivating regulators to embed security clauses into hosting contracts. FEMA tied USD 625 million in grants to weapon-detection, counter-drone, and cybersecurity milestones, forcing venues that once planned five-year rollouts to compress projects into 18 months. Insurance carriers now peg premium discounts to AI analytics and biometric access control, ensuring a durable demand baseline even during discretionary-spending pauses.
Rapid Adoption of AI-Powered Video Analytics for Real-Time Threat Detection
AI video analytics that flag unattended bags, crowd surges, and weapon signatures are moving from pilots to mass deployment. Convergint integrated object-recognition software that cut control-room headcount by 60% at multiple U.S. venues. Royal Challengers Bangalore funded 300-plus AI cameras for predictive congestion alerts and facial recognition in January 2026, illustrating Asia-Pacific's leapfrog adoption.
High Upfront CapEx for Integrated Security Suites
A mid-tier stadium, with a capacity of 40,000 seats, allocates a budget of USD 8-12 million for AI cameras, biometrics, intrusion sensors, and a unified command center. However, these stadiums often stagger their purchases due to budget constraints, which creates security gaps and reduces their return on investment (ROI). This fragmented approach to security upgrades can leave vulnerabilities unaddressed for extended periods. In regions like South America and Africa, operators are increasingly turning to incremental upgrades or managed security as-a-service solutions. These strategies help them avoid significant upfront capital expenditures while maintaining a degree of operational security. Such approaches also allow for flexibility in adapting to evolving security needs over time.
Other drivers and restraints analyzed in the detailed report include:
- Government-Funded Smart-Stadium Renovations Ahead of 2026-2028 Mega-Events
- Migration from Analog CCTV to IP/PoE Lowering TCO
- Privacy Regulations Constraining Biometric Deployment
For complete list of drivers and restraints, kindly check the Table Of Contents.
Segment Analysis
Hardware anchored 61.63% of stadium security market share in 2025 on the back of cameras, turnstiles, and perimeter sensors, yet services are pacing the expansion at 10.78% CAGR to 2031 as venues outsource integration, 24-hour monitoring, and compliance audits. The shift is most visible in facilities under 30,000 seats that lack in-house IT depth and pivot to subscription models for algorithm tuning and incident response.
The services boom aligns with managed-security bundles from Genetec and Convergint that convert capital sales into annuities, while software sits between the two streams, monetizing IP camera migrations with video management licensing and predictive crowd modules. Evolv Technologies' per-scan bag-screening fees illustrate how hardware vendors pivot to consumption economics, extending customer lifetime value without heavy refresh cycles.
Video surveillance accounted for 43.28% of the stadium security market in 2025, cementing cameras as the primary security layer. Cybersecurity, though a smaller slice, is accelerating at 10.91% CAGR because ransomware, distributed denial-of-service risks, and OT network exposures threaten event continuity. Fortinet secured ticketing, point-of-sale, and surveillance networks at FC Barcelona, while Nozomi Networks monitors HVAC controllers for anomalous traffic.
Access control, perimeter detection, and alarm platforms post steady mid-single-digit growth, supported by biometrics mandates in Middle East venues and automated PTZ radar tracking that stretches protection 500 m beyond stadium fences. Insurers require annual penetration testing, effectively hard-wiring cybersecurity demand into lease covenants and sponsorship agreements.
Geography Analysis
North America retained 38.55% stadium security market share in 2025, lifted by FEMA funding, NFL and Major League Baseball security mandates, and a dense integrator ecosystem. MetLife Stadium, SoFi Stadium, and AT&T Stadium all upgraded to AI analytics, biometric gates, and counter-drone radar ahead of FIFA 2026. Canadian and Mexican venues mirror the pattern, with Axis Communications integrating license-plate recognition and facial analytics at Estadio Azteca.
Asia-Pacific, with a 11.31% CAGR, is the fastest-growing region. Royal Challengers Bangalore's January 2026 camera project and China-financed deployments in Southeast Asia underscore how new builds skip analog entirely. Australia is installing counter-UAS systems for the 2032 Brisbane Olympics, and Japan is tying stadium networks into smart-city grids for emergency services. Data-protection fragmentation remains a wild card, particularly in India, where national biometric rules are still pending.
Europe, the Middle East, and Africa show mixed momentum. GDPR fines temper biometric rollouts in Spain and Denmark, but privacy-preserving facial analytics at Paris Saint-Germain reveal a commercial workaround. Saudi Arabia's sovereign-funded 15-stadium initiative positions the Middle East for rapid category adoption, while South America rebuilds confidence after the Copa America breach, with Brazil and Argentina mandating QR ticket checks and expanded guard staffing. African venues proceed gradually, prioritizing incremental upgrades within fiscal constraints.
- Avigilon Corporation
- Genetec Inc.
- Axis Communications AB
- Hangzhou Hikvision Digital Technology Co., Ltd.
- Zhejiang Dahua Technology Co., Ltd.
- Dallmeier Electronic GmbH & Co. KG
- AxxonSoft Limited
- Rapiscan Systems, Inc.
- Evolv Technologies Holdings, Inc.
- Patriot One Technologies Inc. (Xtract One)
- Senstar Corporation
- BriefCam Ltd.
- Hanwha Vision Co., Ltd.
- Bosch Sicherheitssysteme GmbH
- NEC Corporation
- Teledyne FLIR LLC
- Gallagher Group Limited (Security Division)
- IDEMIA Group S.A.S.
- Magal Security Systems Ltd.
- Fortem Technologies, Inc.
Additional Benefits:
- The market estimate (ME) sheet in Excel format
- 3 months of analyst support
TABLE OF CONTENTS
1 INTRODUCTION
- 1.1 Study Assumptions and Market Definition
- 1.2 Scope of the Study
2 RESEARCH METHODOLOGY
3 EXECUTIVE SUMMARY
4 MARKET LANDSCAPE
- 4.1 Market Overview
- 4.2 Market Drivers
- 4.2.1 Heightened Terrorism Threat Accelerating Mandatory Security Compliance
- 4.2.2 Rapid Adoption of AI-Powered Video Analytics for Real-Time Threat Detection
- 4.2.3 Government-Funded Smart-Stadium Renovations Ahead of 2026-2028 Mega-Events
- 4.2.4 Migration from Analog CCTV to IP/PoE Lowering TCO
- 4.2.5 Monetization of Crowd-Flow Data for Sponsor Analytics
- 4.2.6 Temporary Private-5G Network-in-a-Box Kits for Event Security
- 4.3 Market Restraints
- 4.3.1 High Upfront CapEx for Integrated Security Suites
- 4.3.2 Privacy Regulations Constraining Biometric Deployment
- 4.3.3 Shortage of Skilled Security Analysts for AI Platforms
- 4.3.4 RF Congestion from Dense IoT Devices Causing Sensor Interference
- 4.4 Industry Value-Chain Analysis
- 4.5 Regulatory Landscape
- 4.6 Technological Outlook
- 4.7 Impact of Macroeconomic Factors on the Market
- 4.8 Porter's Five Forces Analysis
- 4.8.1 Threat of New Entrants
- 4.8.2 Bargaining Power of Suppliers
- 4.8.3 Bargaining Power of Buyers
- 4.8.4 Threat of Substitutes
- 4.8.5 Industry Rivalry
5 MARKET SIZE AND GROWTH FORECASTS (VALUE)
- 5.1 By Component
- 5.1.1 Hardware
- 5.1.2 Software
- 5.1.3 Services
- 5.2 By Solution Type
- 5.2.1 Video Surveillance Systems
- 5.2.2 Access Control Systems
- 5.2.3 Perimeter Intrusion Detection Systems
- 5.2.4 Alarm and Notification Systems
- 5.2.5 Cybersecurity and Network Monitoring
- 5.3 By Deployment Model
- 5.3.1 On-Premise
- 5.3.2 Cloud-Based
- 5.4 By Stadium Capacity
- 5.4.1 Less Than 30,000 Seats
- 5.4.2 30,000-50,000 Seats
- 5.4.3 Greater Than 50,000 Seats
- 5.5 By Geography
- 5.5.1 North America
- 5.5.1.1 United States
- 5.5.1.2 Canada
- 5.5.1.3 Mexico
- 5.5.2 Europe
- 5.5.2.1 Germany
- 5.5.2.2 United Kingdom
- 5.5.2.3 France
- 5.5.2.4 Russia
- 5.5.2.5 Rest of Europe
- 5.5.3 Asia-Pacific
- 5.5.3.1 China
- 5.5.3.2 Japan
- 5.5.3.3 India
- 5.5.3.4 South Korea
- 5.5.3.5 Australia
- 5.5.3.6 Rest of Asia-Pacific
- 5.5.4 South America
- 5.5.5 Middle East and Africa
- 5.5.1 North America
6 COMPETITIVE LANDSCAPE
- 6.1 Market Concentration
- 6.2 Strategic Moves
- 6.3 Market Share Analysis
- 6.4 Company Profiles (includes Global Level Overview, Market Level Overview, Core Segments, Financials as available, Strategic Information, Market Rank/Share, Products and Services, Recent Developments)
- 6.4.1 Avigilon Corporation
- 6.4.2 Genetec Inc.
- 6.4.3 Axis Communications AB
- 6.4.4 Hangzhou Hikvision Digital Technology Co., Ltd.
- 6.4.5 Zhejiang Dahua Technology Co., Ltd.
- 6.4.6 Dallmeier Electronic GmbH & Co. KG
- 6.4.7 AxxonSoft Limited
- 6.4.8 Rapiscan Systems, Inc.
- 6.4.9 Evolv Technologies Holdings, Inc.
- 6.4.10 Patriot One Technologies Inc. (Xtract One)
- 6.4.11 Senstar Corporation
- 6.4.12 BriefCam Ltd.
- 6.4.13 Hanwha Vision Co., Ltd.
- 6.4.14 Bosch Sicherheitssysteme GmbH
- 6.4.15 NEC Corporation
- 6.4.16 Teledyne FLIR LLC
- 6.4.17 Gallagher Group Limited (Security Division)
- 6.4.18 IDEMIA Group S.A.S.
- 6.4.19 Magal Security Systems Ltd.
- 6.4.20 Fortem Technologies, Inc.
7 MARKET OPPORTUNITIES AND FUTURE OUTLOOK
- 7.1 White-Space and Unmet-Need Assessment


