

|
시장보고서
상품코드
2114086
스마트 스타디움 : 시장 점유율 분석, 업계 동향 및 통계, 성장 예측(2026-2031년)Smart Stadium - Market Share Analysis, Industry Trends & Statistics, Growth Forecasts (2026 - 2031) |
||||||
 Mordor Intelligence
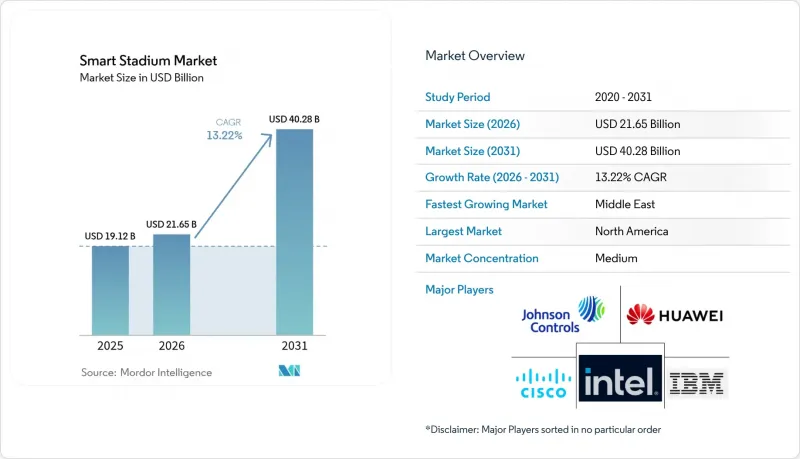
Mordor Intelligence에 의하면, 2026년 스마트 스타디움 시장 규모는 216억 5,000만 달러로 추정되고 있으며, 2025년 191억 2,000만 달러에서 확대될 전망입니다.
2031년 예측치는 402억 8,000만 달러로, 2026년부터 2031년까지 연평균 성장률(CAGR) 13.22%를 기록하며 성장할 것으로 전망됩니다.
본 보고서는 구성 요소(하드웨어, 소프트웨어, 서비스), 소프트웨어 솔루션(빌딩 자동화 관리 등), 배포 방식(On-Premise, 클라우드),연결 기술(Wi-Fi 6/7, 5G, 프라이빗 LTE 등), 용도 분야(스포츠 이벤트 등), 수익원(티켓 판매 및 굿즈 판매 등), 그리고 지역별로 분류되어 있습니다. 시장 예측은 금액(달러) 기준으로 제시되어 있습니다.
세계 스마트 스타디움 시장 동향 및 인사이트
5G 네트워크 구축이 고밀도 연결을 촉진
통신 사업자들의 mm파 및 C-밴드 주파수 대역에 대한 투자로 인해, 경기장에서는 수만 명의 동시 사용자에게 멀티 기가비트급 속도로 서비스를 제공할 수 있게 되었습니다. 이는 기존의 분산형 안테나 시스템으로는 경제적으로 실현할 수 없었던 성과입니다. 버라이즌은 2024년, NFL의 28개 경기장에서 5G 울트라 와이드밴드 구축을 완료하여 20밀리초 미만의 지연 시간이 필요한 증강현실(AR) 리플레이 및 좌석에서 베팅하는 기능을 가능하게 했습니다. 노트르담 스타디움에서는 2024년에 도입된 Wi-Fi 6E 오버레이를 통해 한 경기당 총 26Gbps의 통신 속도를 달성했으며, 이는 결정론적 IoT 텔레메트리를 실현하기 위해 프라이빗 LTE 코어와 결합되어 있습니다. 보다폰(Vodafone)이나 도이체 텔레콤(Deutsche Telekom)과 같은 유럽의 통신 사업자들은 경기장 내 통신망 밀도 향상을 독립형 5G 코어의 핵심 도입 사례로 삼고 있으며, 이를 통해 지자체 등의 구매자에게 슬라이싱 기술도 어필하고 있습니다. 전용 스몰 셀 네트워크는 액세스 포인트당 1,500건 이상의 연결이 발생하는 피크 시간대의 접속 집중 시 발생하는 간섭을 줄여줍니다. 이를 통해 확보된 대역폭은 1인당 지출과 스폰서 수입을 향상시키는 차세대 서비스를 뒷받침하고 있습니다.
메가 이벤트 일정이 디지털화 예산을 가속화
2026년 FIFA 월드컵과 2028년 로스앤젤레스 올림픽으로 인해, 10년에 걸친 업데이트 주기가 2년 간의 단기 집중 프로젝트로 단축되었습니다. 레노버는 2024년 FIFA와 체결한 세계 계약에 따라 미국, 멕시코, 캐나다의 16개 경기장에 엣지 서버와 AI 어플라이언스를 공급하고 있습니다. 멕시코의 아즈텍 스타디움에서는 2024년에 1억 5,000만 달러 규모의 개보수 공사가 시작되어, 4K 온디맨드 영상을 지원하는 ‘좌석까지 광섬유를 설치하는’ 연결 환경이 구축되었습니다. LA28 조직위원회는 오토데스크의 BIM 워크플로우를 활용하여 대회 종료 후에도 지속될 예측 유지보수를 통합하고 있습니다. 이러한 플래그십급 건설 프로젝트는 2차 시장에 올림픽 수준의 기준으로의 업그레이드를 촉진하는 시범 효과를 창출하여, 스마트 스타디움 시장을 개최 도시의 범위를 훨씬 뛰어넘어 확대시키고 있습니다.
레거시 시스템의 파편화가 개보수 비용을 상승시키고 있다.
1990년부터 2010년 사이에 건설된 유럽의 경기장에서는 공조(HVAC), 출입 통제, 감시 시스템에서 BACnet, Modbus, ONVIF와 같은 서로 다른 프로토콜에 기반한 독자적인 플랫폼이 운영되는 경우가 많습니다. 이러한 사일로화된 시스템을 통합하려면 맞춤형 미들웨어와 장기간에 걸친 현장 시운전이 필요하며, 그 결과 신축(그린필드)에 비해 좌석당 비용이 2배로 늘어날 가능성이 있습니다. 2024년 ‘스타디움 비즈니스 서밋’ 조사에 따르면, 운영자의 63%가 도입의 가장 큰 장벽으로 통합의 복잡성을 꼽았으며, 대규모 경기장의 경우 개보수 기간이 18개월에 달하는 것으로 나타났습니다. 운영자는 전환 기간 동안 시스템을 병행하여 유지 관리해야 하는 경우도 있어, 투자 수익률(ROI)을 저하시킵니다. EU의 ‘건축물 에너지 성능 지침’에 따라 구형 설비의 폐기가 가속화되고 있지만, 자금적 제약이나 지방자치단체의 임대차 계약상 제한으로 인해 설비의 일괄 교체가 지연되고 있어, 스마트 스타디움 시장의 성장을 저해하고 있습니다.
부문 분석
시스템 통합사업자가 기존의 전기, 기계, IT 자산을 단일 IoT 패브릭으로 통합한 결과, 2025년 매출의 51.88%를 서비스가 차지했습니다. 한편, 소프트웨어는 연평균 성장률(CAGR) 15.02%를 나타낼 것으로 예측되며, 스마트 스타디움 시장의 성장을 견인하는 가장 빠른 분야가 될 전망입니다. 운영 사업자들은 대규모 시스템 업데이트를 피할 수 있는 빌딩 자동화 및 관중 분석 모듈에 대해 구독형 라이선스를 선호하고 있습니다. 시스코의 2024년판 프라이빗 5G 번들은 무선 장비, 코어 소프트웨어, 전문 서비스를 단일 SKU로 통합하여 이러한 변화를 여실히 보여주고 있습니다. 범용 x86 서버가 전용 어플라이언스를 대체함에 따라, 경기장 측은 총 소유 비용(TCO)을 절감하고 기능 도입을 가속화하고 있습니다. 스마트 스타디움 업계에서는 소프트웨어를 새로운 수익원의 주요 원동력으로 보는 경향이 강해지고 있으며, 하드웨어 업데이트는 통신 사업자의 5G 로드맵이나 Wi-Fi 세대 교체 시기와 맞추어 이루어지고 있습니다.
하드웨어는 필수적인 중간적 위치를 차지하고 있습니다. 엣지 게이트웨이, 액세스 포인트, 센서 어레이는 특히 실시간 베팅 통합에서 방송 품질 수준의 지연 시간 기준을 충족해야 합니다. 업데이트 주기는 주요 시장에서의 Wi-Fi 7 채택 및 6GHz 대역 도입과 연동되어 있습니다. 펌웨어 업데이트나 AI 추론 기능을 기존 기기에 통합하는 벤더는 업데이트 수요를 확보하는 데 있어 가장 유리한 입장에 있습니다. 이러한 구성 요소의 변화는 스마트 스타디움 시장이 자본 집약적인 건설에서 지속적인 수익을 창출하는 서비스 모델로 전환되고 있음을 여실히 보여줍니다.
디지털 컨텐츠 및 팬 참여용 소프트웨어는 2025년 솔루션 매출의 28.10%를 차지하고 있으며, 이는 1인당 지출을 증가시키는 모바일 앱, 좌석 주문, 증강현실(AR) 오버레이에 대한 수요를 반영합니다. 연평균 성장률(CAGR) 13.95%가 예상되는 ‘스마트 티켓 및 주차장’ 분야가 급성장 분야로 부상하고 있습니다. 리버풀 FC의 NFC 도입으로 입장 소요 시간이 평균 12분에서 7분으로 단축되었을 뿐만 아니라, 광고주를 위한 타임스탬프가 포함된 이동 데이터가 생성되었습니다. SKIDATA사의 2024년형 클라우드 주차 솔루션은 이미 독일과 오스트리아에서 운영 중이며, 도시 교통 시스템과 연동하여 동적 가격 책정을 실현하고 있습니다.
빌딩 자동화 및 에너지 관리는 지속가능성 요건을 중심으로 융합이 진행되고 있습니다. 슈나이더 일렉트릭의 ‘EcoStruxure’ 플랫폼은 20-30%의 에너지 절감 효과를 내세우고 있으며, ‘니어 제로 에너지(Near-Zero Energy)’ 목표를 달성해야 하는 EU 운영 사업자들에게 매우 매력적인 지표가 되고 있습니다. 보안 소프트웨어는 UEFA와 FIFA가 AI를 활용한 관중 분석을 경기장 라이선스 요건에 포함시키려 하고 있는 만큼, 계속해서 규정 준수를 주도하는 추세를 보이고 있습니다. 모든 카테고리에서 모듈식이며 클라우드 네이티브인 설계가 스마트 스타디움의 대상 시장을 확대되고 있습니다.
지역별 분석
2025년, 북미는 스마트 스타디움 시장에서 37.10%의 점유율을 차지하며 시장을 주도했습니다. 이는 성숙한 도박 규제와 적극적인 5G 밀도 향상이 뒷받침한 결과입니다. 버라이즌이 NFL의 28개 경기장에 구축한 전용 스몰 셀 네트워크와 엣지 컴퓨팅 노드를 통해 증강현실(AR)을 활용한 리플레이 및 실시간 베팅이 가능해졌습니다. 캐나다와 멕시코에서는 2026년 월드컵을 앞두고 경기장 개보수가 진행되고 있으며, 에스타디오 아스테카에서 진행 중인 1억 5,000만 달러 규모의 ‘파이버 투 시트(Fiber to Seat)’ 업그레이드가 이 지역의 벤치마크가 되고 있습니다. 그러나 캘리포니아주의 개인정보 보호 규제로 인해 경기장 내에서는 위치 정보를 엣지 측에서 익명화해야 할 의무가 부과되어 있으며, 이로 인해 생체 인증 기술 도입이 지연되고 있습니다.
중동은 ‘비전 2030’에 따른 정부 자금 지원으로 메가 경기장이 건설됨에 따라, 14.45%라는 지역 내 가장 높은 연평균 성장률(CAGR)을 보일 것으로 전망됩니다. 리야드의 킹 살만 스타디움은 통합형 태양광 발전 시스템과 AI를 활용한 관중 분석을 통해 순제로 에너지를 목표로 하고 있는 반면, 두바이 아레나에서는 현금 없는 매점 판매와 동적 주차장 관리를 시행하고 있습니다. 연간 40일 미만의 행사 운영률은 투자 수익률(ROI)을 위협하고 있지만, 정부의 지원책이 재융자 위험을 완화하고 주요 프로젝트가 예정대로 완공되도록 보장하고 있습니다. 이러한 동향이 스마트 스타디움 시장의 확장을 뒷받침하고 있습니다.
아시아태평양과 유럽에서는 공공 자금 프로그램 및 규제의 영향으로 도입 진행 상황에 다양성이 나타나고 있습니다. 인도의 ‘케로 인디아 2.0’에서는 2024년부터 2025년에 걸쳐 2급 경기장의 IoT 업그레이드에 300억 루피(3억 6,000만 달러)를 배정했습니다. 중국의 ‘제14차 5개년 계획’에서는 경기장 IoT가 지방채 패키지에 포함되어 있어 광둥성과 절강성에서 도입이 가속화되고 있습니다. 유럽의 제로 트러스트 및 에너지 관련 지침은 기준 비용을 상향 조정하지만, 공급망 보안을 인증할 수 있는 기존 사업자를 보호하고 있습니다. 일본과 한국은 5G 보급을 활용해 무현금 결제 및 AR을 활용한 팬 경험을 실현하고 있지만, 내진 기준에 따른 개보수로 인해 자금 수요가 증가하고 있습니다. 각 지역에서 정책적 촉진요인이나 대형 이벤트 일정이 도입 시기를 좌우하지만, 커넥티드 팬 경험에 대한 꾸준한 수요로 인해 스마트 경기장 시장은 꾸준한 성장 궤도를 유지하고 있습니다.
기타 특전:
- 엑셀 형식 시장 예측(ME) 시트
- 3개월간의 애널리스트 지원
자주 묻는 질문
목차
제1장 서론
제2장 조사 방법
제3장 주요 요약
제4장 시장 구도
제5장 시장 규모와 성장 예측
제6장 경쟁 구도
제7장 시장 기회와 향후 전망
LSH 26.08.25According to Mordor Intelligence, smart stadium market size in 2026 is estimated at USD 21.65 billion, growing from 2025 value of USD 19.12 billion with 2031 projections showing USD 40.28 billion, growing at 13.22% CAGR over 2026-2031.
This report is Segmented by Component (Hardware, Software, and Services), Software Solution (Building Automation Management, and More), Deployment Mode (On-Premise, and Cloud), Connectivity Technology (Wi-Fi 6/7, 5G and Private LTE, and More), Application Area (Sports Events, and More), Revenue Stream (Ticketing and Merchandise, and More), and Geography. The Market Forecasts are Provided in Terms of Value (USD).
Global Smart Stadium Market Trends and Insights
5G Network Roll-outs Catalyzing High-Density Connectivity
Carrier investment in millimeter-wave and C-band spectrum is enabling stadiums to serve tens of thousands of concurrent users at multi-gigabit speeds, a feat that legacy distributed-antenna systems could not economically achieve. Verizon completed 5G Ultra Wideband builds across 28 NFL venues in 2024, supporting augmented-reality replays and in-seat betting that demand sub-20-millisecond latency. Notre Dame Stadium's 2024 Wi-Fi 6E overlay achieved an aggregate of 26 Gbps during a single game and is being paired with a private LTE core for deterministic IoT telemetry. European operators such as Vodafone and Deutsche Telekom are positioning stadium densification as anchor tenants for standalone 5G cores that also showcase slicing to municipal buyers. Dedicated small-cell grids reduce interference during peak ingress when device density exceeds 1,500 connections per access point. The resulting bandwidth is underpinning next-generation services that raise per-capita spending and sponsorship yield.
Mega-Event Pipeline Accelerating Digitization Budgets
The 2026 FIFA World Cup and 2028 Los Angeles Olympics are compressing decade-long refresh cycles into two-year sprints. Lenovo's 2024 global deal with FIFA supplies edge servers and AI appliances to 16 venues across the United States, Mexico, and Canada. Mexico's Estadio Azteca began a USD 150 million renovation in 2024, installing fiber-to-the-seat connectivity for 4K on-demand video. The LA28 organizing committee is utilizing Autodesk BIM workflows to integrate predictive maintenance that will continue beyond the games. These flagship builds create a demonstration effect that pushes secondary markets to upgrade to Olympic-grade standards, expanding the smart stadium market well beyond host cities.
Legacy System Fragmentation Elevating Retrofit Costs
European arenas built between 1990 and 2010 often run proprietary HVAC, access control, and surveillance platforms on disparate protocols such as BACnet, Modbus, and ONVIF. Converging these silos demands custom middleware and lengthy on-site commissioning, which can double the per-seat cost of a greenfield build. A 2024 Stadium Business Summit survey found that 63% of operators identified integration complexity as their top barrier to adoption, with retrofit timelines reaching 18 months for large venues. Operators must sometimes maintain parallel systems during migration, eroding ROI. Although the EU's Energy Performance of Buildings Directive accelerates decommissioning of obsolete equipment, capital constraints and municipal lease restrictions slow wholesale replacement, weighing on smart stadium market growth.
Other drivers and restraints analyzed in the detailed report include:
- EU Crowd-Safety Mandates Requiring Real-time Analytics
- In-Venue Sports Betting and Data Licensing Opening New Revenue Streams
- Rising Cyber-Liability Under GDPR and CCPA
For complete list of drivers and restraints, kindly check the Table Of Contents.
Segment Analysis
Services anchored 51.88% of 2025 revenue as system integrators mapped legacy electrical, mechanical, and IT assets into a single IoT fabric. Software, however, is forecast to grow at a 15.02% CAGR, making it the fastest driver of smart stadium market growth. Operators prefer subscription licenses for building-automation and crowd-analytics modules that avoid forklift upgrades. Cisco's 2024 Private 5G bundle illustrates the shift, combining radios, core software, and professional services into a single SKU. As commodity x86 servers replace proprietary appliances, venues cut the total cost of ownership and accelerate feature roll-outs. The smart stadium industry is increasingly treating software as the principal lever for new revenue streams, with hardware refreshes timed to coincide with carrier 5G roadmaps and Wi-Fi generational shifts.
Hardware occupies an essential middle ground. Edge gateways, access points, and sensor arrays must still meet broadcast-quality latency thresholds, particularly for real-time betting integrations. Replacement cycles align with the adoption of Wi-Fi 7 and the introduction of 6 GHz spectrum in major markets. Vendors that bundle firmware updates and AI inference capabilities into existing devices are best positioned to capture replacement demand. The evolving component mix underscores how the smart stadium market is migrating from capital-intensive builds toward recurring-revenue service models.
Digital Content and Fan Engagement software accounted for 28.10% of 2025 solution revenue, reflecting demand for mobile apps, in-seat ordering, and augmented-reality overlays that increase per-capita spending. Smart Ticketing and Parking, projected to post a 13.95% CAGR, is emerging as the breakout. Liverpool FC's NFC roll-out cut average ingress times from 12 to 7 minutes and produced timestamped mobility data for advertisers. SKIDATA's 2024 cloud parking solution, already live in Germany and Austria, integrates with city traffic systems to enable dynamic pricing.
Building Automation and Energy Management are converging around sustainability mandates; Schneider Electric's EcoStruxure platform claims 20-30% energy savings, a compelling metric for EU operators facing near-zero-energy targets. Security software remains compliance-driven as UEFA and FIFA push AI crowd analytics into venue licensure. Across categories, modular, cloud-native design is expanding the addressable market for smart stadiums.
Complete Report Scope:
- By Component
- Hardware
- Software
- Services
- By Software Solution
- Building Automation Management
- Stadium and Public Security
- Event and Crowd Management
- Digital Content and Fan Engagement
- Network Management
- Energy Management
- Smart Ticketing and Parking
- By Deployment Mode
- On-Premise
- Cloud
- By Connectivity Technology
- Wi-Fi 6/7
- 5G and Private LTE
- Distributed Antenna Systems (DAS)
- Bluetooth Low Energy / BLE Beacons
- Fiber and Edge Compute Infrastructure
- By Application Area
- Sports Events
- Concerts and Entertainment
- Esports Tournaments
- Corporate and Other Events
- By Revenue Stream
- Ticketing and Merchandise
- Concessions and Hospitality
- Advertising and Sponsorship
- Venue Rental and Non-Sport Events
- Data Monetization and Betting
- By Geography
- North America
- United States
- Canada
- Mexico
- South America
- Brazil
- Argentina
- Rest of South America
- Asia Pacific
- China
- India
- Japan
- South Korea
- Rest of Asia Pacific
- Europe
- Germany
- United Kingdom
- France
- Italy
- Spain
- Rest of Europe
- Middle East
- Saudi Arabia
- United Arab Emirates
- Rest of Middle East
- Africa
- South Africa
- Egypt
- Rest of Africa
- North America
Geography Analysis
North America led the smart stadium market with 37.10% share in 2025, lifted by mature betting regulations and aggressive 5G densification. Verizon's dedicated small-cell grids and edge-compute nodes across 28 NFL venues enable augmented-reality replays and real-time wagering. Canada and Mexico are renovating ahead of the 2026 World Cup, with Estadio Azteca's USD 150 million fiber-to-seat upgrade setting a regional benchmark. California's privacy rules, however, compel venues to anonymize location data at the edge, which slows biometric rollouts.
The Middle East is projected to post the fastest regional CAGR at 14.45% thanks to sovereign-funded mega-venues aligned with Vision 2030. Riyadh's King Salman Stadium is targeting net-zero energy through integrated solar arrays and AI crowd analytics, while Dubai Arena operates cashless concessions and dynamic parking. Underutilization below 40 event days per year threatens ROI, yet government backstops are mitigating refinancing risk to ensure showcase projects land on time, a dynamic that broadens the smart stadium market reach.
The Asia Pacific and Europe follow diverse adoption curves, shaped by public funding programs and regulations. India's Khelo India 2.0 earmarked INR 30 billion (USD 360 million) in 2024-2025 for IoT upgrades in tier-2 stadiums. China's 14th Five-Year Plan bundles stadium IoT into municipal bond packages, accelerating deployment in Guangdong and Zhejiang. Europe's zero-trust and energy directives lift baseline costs but protect incumbents that can certify supply-chain security. Japan and South Korea leverage 5G penetration for cashless payments and AR fan experiences, yet seismic-code retrofits raise capital needs. Across regions, policy drivers and mega-event timetables dictate timing, but the underlying demand for connected fan experiences keeps the smart stadium market on a steady growth path.
- Cisco Systems Inc.
- IBM Corporation
- Huawei Technologies Co. Ltd.
- Johnson Controls International plc
- Intel Corporation
- Schneider Electric SE
- Ericsson AB
- Honeywell International Inc.
- Hewlett Packard Enterprise (Aruba Networks)
- CommScope
- NEC Corporation
- Tech Mahindra Ltd.
- NXP Semiconductors N.V.
- JMA Wireless
- Axess AG
- AllGoVision Technologies Pvt. Ltd.
- Qualcomm Technologies Inc.
- KORE Wireless Group
- Daktronics Inc.
- SAP SE
- Oracle Corporation
- Schneider Electric
- Extreme Networks Inc.
- Zebra Technologies Corp.
- Panasonic Holdings Corp.
Additional Benefits:
- The market estimate (ME) sheet in Excel format
- 3 months of analyst support
TABLE OF CONTENTS
1 INTRODUCTION
- 1.1 Study Assumptions and Market Definition
- 1.2 Scope of the Study
2 RESEARCH METHODOLOGY
3 EXECUTIVE SUMMARY
4 MARKET LANDSCAPE
- 4.1 Market Overview
- 4.2 Market Drivers
- 4.2.1 5G Network Roll-outs Catalyzing High-Density Connectivity in North American and European Venues
- 4.2.2 Mega-Event Pipeline (2026 FIFA World Cup, 2028 LA Olympics) Accelerating Digitization Budgets
- 4.2.3 EU Crowd-Safety Mandates (Regulation 2023/1881) Requiring Real-time Analytics Platforms
- 4.2.4 In-Venue Sports Betting and Data Licensing Opening New Revenue Streams in the US
- 4.2.5 Smart-City Grants in APAC (e.g., India's Khelo India 2.0) Funding Stadium IoT Upgrades
- 4.2.6 Green-Deal Targets Driving Energy-Efficient Building Automation in EU Arenas
- 4.3 Market Restraints
- 4.3.1 Legacy System Fragmentation Elevating Retrofit Integration Costs in Europe
- 4.3.2 Rising Cyber-Liability Under GDPR and CCPA Slowing Fan-Data Platform Adoption
- 4.3.3 Prolonged Municipal Lease Approvals Delaying Capex in South America
- 4.3.4 Under-utilization (<40 days/yr) Curtailing ROI for Private Middle-East Stadium Investors
- 4.4 Industry Value Chain Analysis
- 4.5 Regulatory and Technological Outlook
- 4.6 Porter's Five Forces
- 4.6.1 Threat of New Entrants
- 4.6.2 Bargaining Power of Buyers
- 4.6.3 Bargaining Power of Suppliers
- 4.6.4 Threat of Substitute Products
- 4.6.5 Intensity of Competitive Rivalry
- 4.7 Investment and Funding Analysis
5 MARKET SIZE AND GROWTH FORECASTS (VALUE)
- 5.1 By Component
- 5.1.1 Hardware
- 5.1.2 Software
- 5.1.3 Services
- 5.2 By Software Solution
- 5.2.1 Building Automation Management
- 5.2.2 Stadium and Public Security
- 5.2.3 Event and Crowd Management
- 5.2.4 Digital Content and Fan Engagement
- 5.2.5 Network Management
- 5.2.6 Energy Management
- 5.2.7 Smart Ticketing and Parking
- 5.3 By Deployment Mode
- 5.3.1 On-Premise
- 5.3.2 Cloud
- 5.4 By Connectivity Technology
- 5.4.1 Wi-Fi 6/7
- 5.4.2 5G and Private LTE
- 5.4.3 Distributed Antenna Systems (DAS)
- 5.4.4 Bluetooth Low Energy / BLE Beacons
- 5.4.5 Fiber and Edge Compute Infrastructure
- 5.5 By Application Area
- 5.5.1 Sports Events
- 5.5.2 Concerts and Entertainment
- 5.5.3 Esports Tournaments
- 5.5.4 Corporate and Other Events
- 5.6 By Revenue Stream
- 5.6.1 Ticketing and Merchandise
- 5.6.2 Concessions and Hospitality
- 5.6.3 Advertising and Sponsorship
- 5.6.4 Venue Rental and Non-Sport Events
- 5.6.5 Data Monetization and Betting
- 5.7 By Geography
- 5.7.1 North America
- 5.7.1.1 United States
- 5.7.1.2 Canada
- 5.7.1.3 Mexico
- 5.7.2 South America
- 5.7.2.1 Brazil
- 5.7.2.2 Argentina
- 5.7.2.3 Rest of South America
- 5.7.3 Asia Pacific
- 5.7.3.1 China
- 5.7.3.2 India
- 5.7.3.3 Japan
- 5.7.3.4 South Korea
- 5.7.3.5 Rest of Asia Pacific
- 5.7.4 Europe
- 5.7.4.1 Germany
- 5.7.4.2 United Kingdom
- 5.7.4.3 France
- 5.7.4.4 Italy
- 5.7.4.5 Spain
- 5.7.4.6 Rest of Europe
- 5.7.5 Middle East
- 5.7.5.1 Saudi Arabia
- 5.7.5.2 United Arab Emirates
- 5.7.5.3 Rest of Middle East
- 5.7.6 Africa
- 5.7.6.1 South Africa
- 5.7.6.2 Egypt
- 5.7.6.3 Rest of Africa
- 5.7.1 North America
6 COMPETITIVE LANDSCAPE
- 6.1 Market Concentration
- 6.2 Strategic Moves
- 6.3 Market Share Analysis
- 6.4 Company Profiles (includes Global level Overview, Market level overview, Core Segments, Financials as available, Strategic Information, Market Rank/Share for key companies, Products AND Services, and Recent Developments)
- 6.4.1 Cisco Systems Inc.
- 6.4.2 IBM Corporation
- 6.4.3 Huawei Technologies Co. Ltd.
- 6.4.4 Johnson Controls International plc
- 6.4.5 Intel Corporation
- 6.4.6 Schneider Electric SE
- 6.4.7 Ericsson AB
- 6.4.8 Honeywell International Inc.
- 6.4.9 Hewlett Packard Enterprise (Aruba Networks)
- 6.4.10 CommScope
- 6.4.11 NEC Corporation
- 6.4.12 Tech Mahindra Ltd.
- 6.4.13 NXP Semiconductors N.V.
- 6.4.14 JMA Wireless
- 6.4.15 Axess AG
- 6.4.16 AllGoVision Technologies Pvt. Ltd.
- 6.4.17 Qualcomm Technologies Inc.
- 6.4.18 KORE Wireless Group
- 6.4.19 Daktronics Inc.
- 6.4.20 SAP SE
- 6.4.21 Oracle Corporation
- 6.4.22 Schneider Electric
- 6.4.23 Extreme Networks Inc.
- 6.4.24 Zebra Technologies Corp.
- 6.4.25 Panasonic Holdings Corp.
7 MARKET OPPORTUNITIES AND FUTURE OUTLOOK
- 7.1 White-Space and Unmet-Need Assessment


