
|
시장보고서
상품코드
2063260
커패시터 뱅크 : 시장 점유율 분석, 업계 동향 및 통계, 성장 예측(2026-2031년)Capacitor Bank - Market Share Analysis, Industry Trends & Statistics, Growth Forecasts (2026 - 2031) |
||||||
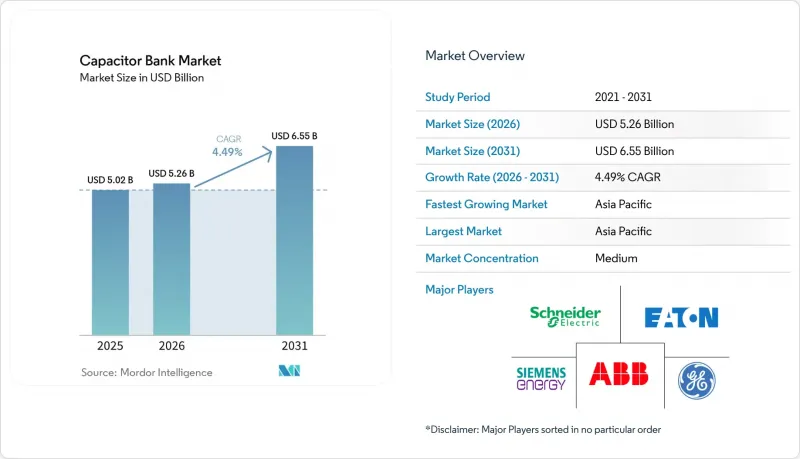
Mordor Intelligence에 의하면, 커패시터 뱅크 시장 규모는 2025년 50억 2,000만 달러로 평가되었습니다. 2026년 52억 6,000만 달러로 확대되어 2031년까지 65억 5,000만 달러에 이를 것으로 예상되며 2026년부터 2031년에 걸쳐 CAGR은 4.49%를 나타낼 전망입니다.

본 보고서는 유형별(야외 변전소, 기타), 전압 등급별(10 kV 미만의 저전압, 10-69 kV의 중전압, 69 kV 이상의 고전압), 용도별(역률 개선, 기타), 최종 사용자(유틸리티, 상업, 기타), 지역(북미, 유럽, 아시아태평양, 남미, 중동 및 아프리카)별로 분류되어 있습니다. 시장 전망은 금액(달러) 기준으로 제시되어 있습니다.
세계의 커패시터 뱅크 시장 동향 및 인사이트
송전망의 현대화와 분산형 에너지 자원(DER)의 도입
세계의 전력 회사들은 지붕 위 태양광 발전, 지역 배터리, 그리고 대규모 재생에너지에서 발생하는 양방향 전류에 대응하기 위해 송전망 보강을 추진하고 있습니다. MISO의 2025년 계획만 보더라도, 미네소타주와 아이오와주의 변전소에 설치되거나 이전된 97 MVAr의 커패시터 용량을 포함하는 432개 프로젝트에 123억 달러가 배정되었습니다. 서던 캘리포니아 에디슨(Southern California Edison)은 분산형 태양광 발전에 따른 주간 전압 상승을 관리하기 위해 배전 피더 전체에 자동 커패시터 뱅크 제어 장치를 도입하고 있습니다. 에버소스 에너지(EverSource Energy)는 2028년까지 162억 달러의 예산을 편성했으며, 이 중 일부는 계량기 뒤편의 축전 설비에서 공급되는 전력을 처리할 수 있는 2차 레벨 스위칭을 가능하게 하는 VAR 디스패치 시스템 업그레이드에 사용되고 있습니다. 이러한 프로그램 덕분에 커패시터 뱅크 시장은 ‘갱신 주기’에서 ‘확장 주기’로 전환되고 있습니다. 이는 새로운 각 피더 구간에서 현지에서의 VAR 지원이 필요하게 되었기 때문입니다. SCADA 인터페이스 및 상태 모니터링·진단 기능을 갖춘 턴키형 장비를 공급하는 업체는 송전망 운영 사업자와의 다년 계약을 체결할 유리한 위치에 있습니다.
전기차 충전 인프라의 급증
급속 충전기는 0.85라는 낮은 역률을 유발하기 때문에 연결 부하가 1MW를 초과할 경우 전력 회사는 현장에서 역률 보정을 의무화할 수밖에 없습니다. IEEE의 현장 테스트에 따르면, 350kW 충전기는 100kVAr의 무효 전력을 소비하며, 이는 20가구가 소비하는 무효 전력량에 해당합니다. CAISO의 2025-2026년 조사 보고서에 따르면, 베이 에어리어의 충전 관련 전압 강하 문제를 해결하기 위해 두 개의 70 kV 회선에 직렬 커패시터를 설치할 계획이 명시되어 있습니다. 따라서 부동산 개발업체들은 전력회사의 조사 결과를 기다리지 않고 몇 주 내에 가동 가능한 저전압 커패시터 캐비닛을 구매하고 있으며, 이 틈새 시장에서는 슈나이더 일렉트릭과 이튼이 납기 경쟁을 벌이고 있습니다. 전기차의 보급이 가속화됨에 따라 두 가지 시장 기회가 생겨나고 있습니다. 전력 회사는 피더의 전압을 안정화하기 위해 중전압 커패시터 뱅크를 조달하는 한편, 충전 네트워크 사업자는 충전소에 설치할 모듈식 유닛을 구매하고 있습니다.
MLCC 공급망의 변동이 필름 커패시터에도 파급
AI 서버 수요 증가로 인해 다층 세라믹 커패시터(MLCC) 생산이 대용량 등급으로 전환되면서, 필름 커패시터용 금속화 생산 능력이 감소했습니다. Supplyframe은 2024년 초 MLCC의 리드타임이 52주에 달했다고 기록했으며, TTI는 2025년 말에는 필름 커패시터의 리드타임이 19주에 이를 것이라고 보고했습니다. 이는 팬데믹 이전 수준보다 46% 증가한 수치입니다. 전략적 조달 계약을 맺지 않은 소규모 커패시터 뱅크 조립 제조업체들은 부품 부족에 직면해 있어 프로젝트 가동 시작이 지연되고 있습니다. 이 문제를 완화하기 위해서는 듀얼 소싱과 장기 대량 조달 계약이 핵심이지만, 이는 Tier 1 공급업체가 누리고 있는 이점이며, 지역 전문 제조업체가 쉽게 활용할 수 없는 것입니다.
부문별 분석
2025년에는 금속 케이스 어셈블리가 커패시터 뱅크 시장에서 점유율을 확대했으며, 도시 지역의 전력 회사들이 소형이고 내화 성능을 갖춘 장비를 우선적으로 채택함에 따라 연평균 성장률(CAGR) 5.7%를 나타낼 것으로 전망됩니다. 지방의 변전소에는 충분한 부지가 있기 때문에 실외 설치형은 여전히 전체 설치 건수의 42.7%를 차지하고 있지만, 환경 규제가 강화됨에 따라 그 성장세는 둔화되고 있습니다. 전주 설치형 유닛은 배전선 작업자가 기초 공사 없이 설비 유지보수 작업을 수행할 수 있는 지방의 피더선에서 여전히 인기가 높습니다. 그 밖의 이동식 또는 컨테이너형 변전소는 건설 현장이나 광산에서 일시적인 송전망 확충에 대응하며, 며칠 만에 설치할 수 있는 플러그 앤 플레이형 캐비닛의 틈새 시장을 창출하고 있습니다.
캘리포니아, 독일, 싱가포르에서 도시가 점점 더 밀집화됨에 따라, 개폐 장치와 동일한 장소에 설치되는 실내용 설계에 대한 수요가 증가하고 있습니다. 캘리포니아주 플레인필드 변전소에서는 산불 규제에 대응하기 위해 2026년 3월에 5 MVAr 용량의 금속 밀폐형 뱅크 2기를 추가했습니다. 이는 방화제방을 설치하지 않음으로써 설비 투자 비용의 추가 부담을 상쇄할 수 있음을 보여줍니다. 각 공급업체는 스테인리스 스틸 케이스, 아크 고장 배기 기능, 그리고 통합 릴레이 패널을 통해 차별화를 꾀하고 있습니다. 일반적으로 전압에 따라 유형을 선택하지만, 실외형 리액터와 밀폐형 커패시터 스텝을 결합한 하이브리드형 변전소가 비용 최적화를 위한 중간적인 대안으로 부상하고 있습니다.
중전압 뱅크(10 kV-69 kV)는 2025년에 매출의 47.9%를 차지했으며, 연평균 성장률(CAGR) 4.8%로 확대될 것으로 전망됩니다. 이는 피더 전압 조정 및 풍력 발전소의 전력 수집 시스템에서 이 장치가 수행하는 역할을 반영한 것입니다. 저전압 장치(10 kV 미만)는 데이터센터나 병원과 같은 시설의 건물 수준에서 전압 보정을 담당하고 있으며, 이러한 시설에서는 전력 회사의 기술자가 아닌 시설 관리자가 구매 결정을 주도하고 있습니다. 고전압 뱅크(69 kV 초과)는 송전 회랑에서 STATCOM이나 직렬 커패시터가 지지를 얻음에 따라 성장세가 완만해지겠지만, 전력 전자 장치의 유지보수 체계가 갖춰지지 않은 외딴 지역의 변전소에서는 여전히 수요가 있습니다.
중전압 장비의 커패시터 뱅크 시장 규모는 분산형 에너지 자원(DER)이 풍부한 새로운 피더마다 전압을 안정화하기 위한 다단식 뱅크가 필요하기 때문에 꾸준히 확대될 것으로 전망됩니다. 한편, 고전압 뱅크는 인구가 희박한 사막이나 산악 지대 등 STATCOM의 경제성이 확보되지 않는 지역에서 여전히 그 입지를 굳건히 지키고 있습니다. 내진 설계 및 사이버 보안 대책을 강화한 컨트롤러를 제공하는 벤더들은 전력 회사들이 기존의 IEC 60871 규격에 새로운 사양을 추가해 나가는 과정에서 시장 점유율을 확보하고 있습니다.
지역별 분석
아시아태평양은 2025년 매출의 45.2%를 차지했으며, 중국이 초고압 송전망을 확장하고 인도가 재생에너지 회랑을 건설함에 따라 2031년까지 연평균 성장률(CAGR) 5.2%를 유지할 전망입니다. 2025년 12월에 가동을 시작한 중국의 자위관 닝승 하이브리드 축전 프로젝트는 커패시터 뱅크가 정상 상태의 무효 전력을 관리하고, 슈퍼커패시터가 과도 현상에 대응하는 하이브리드화 추세를 보여주고 있습니다. 인도의 전력망이 히타치 에너지와 체결한 765kV 변압기 30대 계약은 막대한 병렬 용량이 필요한 송전망의 지속적인 확장을 뒷받침하고 있습니다.
북미에서는 도입 기반이 성숙해 있으며, 규제 대상인 유틸리티자들이 긴 승인 절차를 거쳐야 하기 때문에 성장 속도는 완만합니다. MISO의 123억 달러 규모의 2025년 확장 계획에는 여전히 수십 기의 중전압 커패시터 뱅크가 포함되어 있으며, PG&E의 플레인필드 프로젝트에서는 산불 방지 규정을 충족하기 위해 10MVAr 규모의 실내 설치형 용량이 추가될 예정입니다. 텍사스주와 버지니아주에서 진행 중인 데이터센터 건설은 저전압 자동 보상 장치에 대한 수요를 창출하고 있지만, 송전 회랑의 경우 STATCOM으로의 교체로 인해 그 수요 증가에는 한계가 있습니다.
유럽에서는 해상 풍력 발전의 통합에 동적 보상 장치가 선호되지만, 독일이나 북유럽의 도시 지역 전력 회사에서는 공간 제약이 있는 변전소를 위해 여전히 중전압 뱅크가 도입되고 있습니다. Ofgem이 네트워크 요금을 두 배로 인상함에 따라, 영국의 산업용 고객들은 벌금을 피하기 위해 온사이트 뱅크 설치를 서둘러야 하는 상황에 처해 있습니다. L&T가 홋카이도의 HVDC 허브 사업에 참여하고 있다는 사실은 컨버터 스테이션용 션트 커패시터에 대한 향후 수주 가능성을 시사합니다.
남미와 중동은 여전히 틈새 시장이며, 브라질의 재생에너지 입찰과 사우디아라비아의 에너지 저장 시스템 입찰이 성장의 견인차 역할을 하고 있습니다. 요금 규제에 얽매인 전력 회사들이 설비 갱신을 미루고 있는 만큼, 공급업체들은 산업용 전기화 프로젝트나 VAR 지원을 EPC 패키지에 포함시킨 배터리 파트너십에 주력하고 있습니다.
기타 혜택 :
- 엑셀 형식 시장 예측(ME) 시트
- 3개월간의 애널리스트 지원
자주 묻는 질문
목차
제1장 서론
제2장 조사 방법
제3장 주요 요약
제4장 시장 구도
제5장 시장 규모 및 성장 예측
제6장 경쟁 구도
제7장 시장 기회 및 향후 전망
KTHAccording to Mordor Intelligence, the capacitor bank market size is expected to increase from USD 5.02 billion in 2025 to USD 5.26 billion in 2026 and reach USD 6.55 billion by 2031, growing at a CAGR of 4.49% over 2026-2031.
This report is Segmented by Type (Open Air Substation, Others), Voltage Class (Low-Voltage Below 10 KV, Medium-Voltage 10 To 69 KV, High-Voltage Above 69 KV), Application (Power Factor Correction, Others), End-User (Utilities, Commercial, Others), and Geography (North America, Europe, Asia-Pacific, South America, Middle East and Africa). The Market Forecasts are Provided in Terms of Value (USD).
Global Capacitor Bank Market Trends and Insights
Grid-modernization & DER build-out
Utilities worldwide are hardening grids to accommodate bidirectional flows from rooftop solar, community batteries, and utility-scale renewables. MISO's 2025 plan alone earmarks USD 12.3 billion for 432 projects that include 97 MVAr of new or relocated capacitor capacity across Minnesota and Iowa substations. Southern California Edison is embedding automated capacitor-bank controllers across its distribution feeders to manage midday voltage climb caused by distributed photovoltaics. Eversource Energy has budgeted USD 16.2 billion through 2028, with a portion dedicated to var-dispatch upgrades that allow second-level switching in response to behind-the-meter storage injections. These programs convert the capacitor bank market from a replacement cycle to an expansion cycle because each new feeder section now needs local var support. Suppliers offering turnkey enclosures with SCADA interfaces and health-monitoring diagnostics are positioned to win multiyear framework agreements with transmission system operators.
Surge in EV Charging Infrastructure
Fast chargers impose lagging power factors as low as 0.85, forcing utilities to mandate on-site compensation when connected load exceeds 1 MW. IEEE field tests show a 350 kW charger can draw 100 kVAr, equivalent to the reactive demand of 20 homes. CAISO's 2025-2026 study specifies series-capacitor insertion on two 70 kV corridors to counteract Bay-Area charging-related voltage sag. Property developers, therefore, purchase low-voltage capacitor cabinets that commission in weeks without utility studies, a niche where Schneider Electric and Eaton compete on delivery speed. As vehicle adoption accelerates, a dual-channel opportunity emerges: utilities procure medium-voltage banks for feeder stiffening, while charging-network operators buy modular units for depot installations.
MLCC supply-chain volatility spilling into film capacitors
AI-server demand pulled multilayer ceramic capacitor (MLCC) production toward high-capacitance grades, reducing metallization capacity for film devices. Supplyframe recorded 52-week MLCC lead times in early 2024, and TTI reported film-capacitor lead times stretching to 19 weeks in late 2025, up 46% from pre-pandemic norms. Smaller capacitor-bank assemblers without strategic sourcing contracts face component shortages that delay project commissioning. Mitigation hinges on dual-sourcing and long-term volume agreements, advantages enjoyed by Tier 1 vendors but not readily available to regional specialists.
Other drivers and restraints analyzed in the detailed report include:
- Electrification of Heat-Intensive Industries
- Rising Power-Quality Penalties from Utilities
- Slow Utility Cap-Ex Cycles in Price-Controlled Regions
For complete list of drivers and restraints, kindly check the Table Of Contents.
Segment Analysis
Metal-enclosed assemblies accounted for a growing slice of the capacitor bank market in 2025 and are projected to grow at a 5.7% CAGR as urban utilities prioritize compact, fire-rated gear. Open-air yards still represent 42.7% of installations because rural substations have ample land, but their growth lags under tightening environmental constraints. Pole-mounted units remain popular in rural feeders where linemen can service equipment without pad construction. Other mobile or containerized banks address temporary grid reinforcement at construction sites and mines, creating a niche for plug-and-play cabinets that deploy within days.
Urban densification in California, Germany, and Singapore accelerates demand for indoor-rated designs that co-locate with switchgear. The Plainfield substation in California added two 5 MVAr metal-enclosed banks in March 2026 to meet wildfire regulations, illustrating how the capital premium is offset by avoided containment berms. Suppliers differentiate through stainless-steel housings, arc-fault venting, and integrated relay panels. Although type choice often aligns with voltage, hybrid yards that mix open-air reactors with enclosed capacitor steps are emerging as a cost-optimized middle ground.
Medium-voltage banks (10 kV-69 kV) generated 47.9% of revenue in 2025 and are forecast to expand at 4.8% CAGR, reflecting their role in feeder voltage regulation and wind-farm collector systems. Low-voltage units (< 10 kV) dominate building-level corrections in data centers and hospitals, where facility managers rather than utility engineers drive purchase decisions. High-voltage banks (> 69 kV) grow slowly as STATCOMs and series capacitors gain favor in transmission corridors, yet they persist in remote substations lacking the maintenance bandwidth for power electronics.
The capacitor bank market size for medium-voltage equipment is projected to rise steadily because each new DER-rich feeder requires multi-step banks to stabilize voltage. Conversely, high-voltage banks defend pockets where STATCOM economics falter, such as sparsely populated deserts or mountain passes. Vendors offering seismic-rated designs and cybersecurity-hardened controllers capture share as utilities layer new specifications onto legacy IEC 60871 compliance.
Geography Analysis
Asia-Pacific generated 45.2% of 2025 revenue and will sustain a 5.2% CAGR through 2031 as China extends its ultra-high-voltage network and India builds renewable corridors. China's Jiayuguan NingSheng hybrid storage project, commissioned in December 2025, illustrates the hybridization trend in which capacitor banks manage steady-state vars while supercapacitors address transients. India's Power Grid contract with Hitachi Energy for 30 units of 765 kV transformers underscores continued grid expansion that necessitates substantial shunt capacitance.
North America grows more slowly because the installed base is mature, and regulated utilities follow lengthy approval cycles. MISO's USD 12.3 billion 2025 expansion plan still contains dozens of medium-voltage banks, and PG&E's Plainfield project adds 10 MVAr of enclosed capacity to meet wildfire-hardening rules. Data-center buildouts in Texas and Virginia create demand for low-voltage automatic banks, but STATCOM substitution limits upside in transmission corridors.
Europe favors dynamic compensators for offshore wind integration, yet urban utilities in Germany and the Nordics still procure medium-voltage banks for space-constrained substations. Ofgem's doubled network charges push U.K. industrial customers to install on-site banks and avoid penalties. L&T's involvement in North Sea HVDC hubs signals future orders for converter-station shunt capacitors.
South America and the Middle East remain niche, driven by renewable auctions in Brazil and storage tenders in Saudi Arabia. Tariff-constrained utilities defer replacements, so vendors focus on industrial electrification projects and battery-storage partnerships that bundle var support into EPC packages.
- ABB Ltd
- Siemens Energy AG
- Schneider Electric SE
- Eaton Corporation plc
- General Electric Co.
- Arteche Group
- Larsen & Toubro Limited
- Hitachi Energy Ltd
- Mitsubishi Electric Corp.
- Toshiba Energy Systems & Solutions
- CG Power & Industrial Solutions
- Hyosung Heavy Industries
- Nissin Electric Co. Ltd
- Trench Group (Siemens)
- Kondas Elektrik Kapasitor
- ZEZ Silko s.r.o.
- FRANKLIN Grid Solutions
- Enerlux Power SRL
- Samwha Electric Co. Ltd
- Cooper Power Systems (Eaton)
Additional Benefits:
- The market estimate (ME) sheet in Excel format
- 3 months of analyst support
TABLE OF CONTENTS
1 Introduction
- 1.1 Study Assumptions & Market Definition
- 1.2 Scope of the Study
2 Research Methodology
3 Executive Summary
4 Market Landscape
- 4.1 Market Overview
- 4.2 Market Drivers
- 4.2.1 Grid-modernisation & DER build-out
- 4.2.2 Surge in EV charging infrastructure
- 4.2.3 Electrification of heat-intensive industries
- 4.2.4 Rising power-quality penalties from utilities
- 4.2.5 Breakthroughs in dry-type polypropylene film
- 4.2.6 AI-enabled predictive switching of capacitor banks
- 4.3 Market Restraints
- 4.3.1 MLCC supply-chain volatility spilling into film capacitors
- 4.3.2 Slow utility cap-ex cycles in price-controlled regions
- 4.3.3 Fire-event recalls in oil-impregnated banks
- 4.3.4 Increasing competition from STATCOMs & SVCs
- 4.4 Supply-Chain Analysis
- 4.5 Regulatory Landscape
- 4.6 Technological Outlook
- 4.7 Porter's Five Forces
- 4.7.1 Threat of New Entrants
- 4.7.2 Bargaining Power of Buyers
- 4.7.3 Bargaining Power of Suppliers
- 4.7.4 Threat of Substitutes
- 4.7.5 Competitive Rivalry
5 Market Size & Growth Forecasts
- 5.1 By Type
- 5.1.1 Open air substation
- 5.1.2 Metal enclosed substation
- 5.1.3 Pole mounted
- 5.1.4 Others
- 5.2 By Voltage Class
- 5.2.1 Low-Voltage (Below 10 kV)
- 5.2.2 Medium-Voltage (10 to 69 kV)
- 5.2.3 High-Voltage (Above 69 kV)
- 5.3 By Application
- 5.3.1 Power factor correction
- 5.3.2 Harmonic filter
- 5.3.3 Voltage regulation
- 5.3.4 Renewable integration
- 5.3.5 Industrial application
- 5.3.6 Data centers
- 5.3.7 Others
- 5.4 By End-User
- 5.4.1 Utilities
- 5.4.2 Commercial
- 5.4.3 Industrial
- 5.4.4 Residential
- 5.5 Geography
- 5.5.1 North America
- 5.5.1.1 United States
- 5.5.1.2 Canada
- 5.5.1.3 Mexico
- 5.5.2 Europe
- 5.5.2.1 Germany
- 5.5.2.2 United Kingdom
- 5.5.2.3 France
- 5.5.2.4 Italy
- 5.5.2.5 NORDIC Countries
- 5.5.2.6 Russia
- 5.5.2.7 Rest of Europe
- 5.5.3 Asia-Pacific
- 5.5.3.1 China
- 5.5.3.2 India
- 5.5.3.3 Japan
- 5.5.3.4 South Korea
- 5.5.3.5 ASEAN Countries
- 5.5.3.6 Rest of Asia-Pacific
- 5.5.4 South America
- 5.5.4.1 Brazil
- 5.5.4.2 Argentina
- 5.5.4.3 Rest of South America
- 5.5.5 Middle East and Africa
- 5.5.5.1 Saudi Arabia
- 5.5.5.2 United Arab Emirates
- 5.5.5.3 South Africa
- 5.5.5.4 Egypt
- 5.5.5.5 Rest of Middle East and Africa
- 5.5.1 North America
6 Competitive Landscape
- 6.1 Market Concentration
- 6.2 Strategic Moves (M&A, Partnerships, PPAs)
- 6.3 Market Share Analysis (Market Rank/Share for key companies)
- 6.4 Company Profiles (includes Global level Overview, Market level overview, Core Segments, Financials as available, Strategic Information, Products & Services, and Recent Developments)
- 6.4.1 ABB Ltd
- 6.4.2 Siemens Energy AG
- 6.4.3 Schneider Electric SE
- 6.4.4 Eaton Corporation plc
- 6.4.5 General Electric Co.
- 6.4.6 Arteche Group
- 6.4.7 Larsen & Toubro Limited
- 6.4.8 Hitachi Energy Ltd
- 6.4.9 Mitsubishi Electric Corp.
- 6.4.10 Toshiba Energy Systems & Solutions
- 6.4.11 CG Power & Industrial Solutions
- 6.4.12 Hyosung Heavy Industries
- 6.4.13 Nissin Electric Co. Ltd
- 6.4.14 Trench Group (Siemens)
- 6.4.15 Kondas Elektrik Kapasitor
- 6.4.16 ZEZ Silko s.r.o.
- 6.4.17 FRANKLIN Grid Solutions
- 6.4.18 Enerlux Power SRL
- 6.4.19 Samwha Electric Co. Ltd
- 6.4.20 Cooper Power Systems (Eaton)
