
|
시장보고서
상품코드
2063262
파력 에너지 : 시장 점유율 분석, 업계 동향 및 통계, 성장 예측(2026-2031년)Wave Energy - Market Share Analysis, Industry Trends & Statistics, Growth Forecasts (2026 - 2031) |
||||||
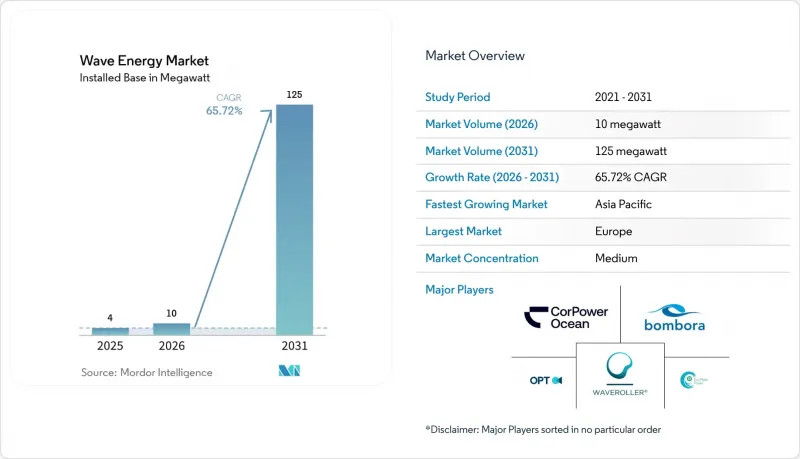
Mordor Intelligence에 의하면, 파력 에너지 시장 도입 용량은 2025년에 4 메가와트로 평가되었습니다. 2026년에 10 메가와트가 되어, 2031년까지 125 메가와트에 이를 것으로 예측됩니다.
2026년부터 2031년까지 연평균 성장률(CAGR) 65.72%를 나타낼 것으로 전망됩니다.

본 보고서는 유형별(진동 수주형, 기타), 설치 장소별(육상, 연안, 연안 얕은 해역, 연안 깊은 해역), 용도별(발전, 해수 담수화, 환경 보호, 기타) 및 지역별(북미, 유럽, 아시아태평양, 남미, 중동 및 아프리카)로 분류되어 있습니다. 시장 전망은 용량(MW) 단위로 제시되어 있습니다.
세계의 파력 에너지 시장 동향과 인사이트
EU 및 APAC 지역에서의 고정가격 임베디드제도(FIT) 및 차액결제방식(CfD)의 확대
유럽 재생에너지 지침 III에 따른 회원국의 목표에 따르면, 2025년부터 2030년까지 신규 재생에너지 용량의 5%를 혁신적인 발전원에서 확보해야 하며, 여기에는 파력 기술이 명시적으로 포함되어 있습니다. 아일랜드의 해양 에너지 프로그램, 호라이즌 유럽 보조금, 그리고 대만 최초의 파력 에너지 차액결제계약(CfD)은 초기 단계 프로젝트의 위험을 완화하는 예측 가능한 수익원을 창출하고 있습니다. 이러한 인센티브 덕분에 투자 회수 기간이 단축되고 벤처 캐피탈의 출자가 유치되면서, 파력 에너지 시장은 시제품 단계에서 상용화 전 클러스터 단계로 전환되고 있습니다. 인도 및 포르투갈의 개발 사업자들은 초기 해상 풍력 지원 제도와 마찬가지로 프리미엄이 적용된 장기 임베디드 가격을 이미 확보하고 있습니다. 이러한 프레임워크의 성공에 힘입어, 아시아·태평양 지역의 다른 국가 정부들도 유사한 지원 메커니즘을 마련하고 있으며, 투자 대상이 될 프로젝트의 파이프라인이 확대되고 있습니다.
풍력·태양광 발전의 균형을 맞추기 위한 해양 기반 베이스로드 재생에너지에 대한 수요
파력 발전 설비는 현재 25-35%의 설비 가동률을 달성하고 있으며, 최적화된 예측에 따르면 최대 40-48%에 달하고, 태양광 및 풍력 발전량이 감소하는 시간대의 전력 공급을 안정화시킵니다. 하와이, 카나리아 제도, 킹섬의 도서 지역 전력망에서는 대규모 배터리 시스템에 의존하지 않고 파력 발전 어레이를 도입하여 디젤 발전을 대체하고 있습니다. 'Waves to Water Prize'와 같은 미국 연방 프로그램은 송전망에서 공급되는 전력이 아닌 직접적인 기계적 압력을 이용하는 Off-grid형 해수 담수화 부표에 자금을 지원하고 있습니다. 외딴 지역의 광산 및 양식장 운영업체들은 연료 운송 비용을 절감하고 배출량에 따른 벌금을 줄이기 위해 파력 에너지를 도입하고 있습니다. 이러한 베이스로드 용도들이 결합되어 고객 기반을 확대하고, 파력 에너지 시장 규모의 경제를 가속화하고 있습니다.
성숙한 재생에너지와 비교했을 때 높은 설비 투자(CAPEX)와 LCOE 간의 격차
2025년 기준 파력 발전의 균등화 발전 비용(LCOE)은 388-618달러/MWh로, 이는 대규모 태양광 발전 비용의 3-6배에 달하여 민간 투자를 저해했습니다. NREL의 학습 곡선에 관한 연구에 따르면, 수 기가와트 규모의 도입이 진행되면 2050년까지 비용이 0.07-0.13달러/kWh까지 낮아질 가능성이 있는 것으로 나타났습니다. 따라서 초기 도입자들은 1MWh당 351달러를 초과하는 임베디드 가격이나 직접적인 자본 보조금에 의존할 수밖에 없습니다. 신흥 시장에서는 지불 의향 가격이 1kWh당 0.10달러 미만으로 나타나고 있어, 자금 조달 격차를 더욱 확대시키고 있습니다. 지속적인 정책 지원이 없다면, 파력 에너지 시장은 규모의 경제 효과로 인해 비용이 전력 시장 가격과 동등한 수준에 도달하기 전에 정체될 위험이 있습니다.
부문별 분석
주로 포인트 어브소버로 구성된 진동체 컨버터는 2025년 설치 용량의 59.7%를 차지했습니다. 이 부문의 파력 에너지 시장 규모는 표준화된 모듈의 양산에 힘입어 연평균 성장률(CAGR) 93.5%를 나타낼 전망입니다. HiWave-5 등의 장치에 탑재된 위상 제어 알고리즘 덕분에 에너지 포집률이 향상되었으며, 이는 투자자들이 이 기술이 상용화 단계에 접어들었다고 보는 한 가지 이유가 되고 있습니다. 해당 부문의 신뢰성 향상은 생존성 시험에서 수익 중심 도입으로의 광범위한 전환을 뒷받침하고 있습니다.
포인트 흡수 장치에 대한 수요는 유연한 계류 옵션 덕분에 증가하고 있으며, 방파제 개보수 공사나 얕은 수심의 기초 공사 모두에 적합합니다. 복합재로 피복하면 부식성이 강한 해양 환경에서 내구 연한을 연장하고, 가동 중단 시간을 연례 정기 점검 시로만 제한할 수 있습니다. 이러한 개선 덕분에 보험 및 자금 조달 비용이 절감되어, 파력 에너지 시장에서 진동체 변환기가 확고한 우위를 확보하고 있습니다.
지역별 분석
유럽은 2025년 설치 용량의 75.1%를 차지하며, 파력 에너지 시장의 중심이 되었습니다. ‘재생에너지 지침 III’에 따른 강력한 정책 지원에 더해, ‘호라이즌 유럽’의 해양 에너지 예산 2억 7,378만 달러를 통해 1-10MW 규모의 어레이가 꾸준히 도입되고 있으며, 현재는 아시아태평양으로 부품을 수출하는 지역 공급망을 뒷받침하고 있습니다. 영국, 아일랜드, 포르투갈은 각각 고정가격 임베디드 제도와 시범 사이트 인프라를 결합하여 학습 곡선을 가속화하고 있습니다.
아시아태평양은 가장 빠른 성장세를 보이고 있으며, 2031년까지의 연평균 성장률(CAGR)은 84.4%를 나타낼 것으로 전망됩니다. 이는 인도의 40GW라는 이론상의 잠재력, 대만의 중기 목표인 20MW, 그리고 일본의 NEDO가 지원하는 실증 사업에 힘입은 결과입니다. 인도네시아와 말레이시아의 현지 대형 석유 및 가스 기업들은 공동 개발 구역이라는 개념을 시범적으로 도입하고 있으며, 초기 설비 구축을 위한 주요 고객을 확보하고 있습니다. 중국 북부만에서 도입된 중공식 호안 시스템은 그리드 패리티에 근접한 균등화 발전 비용을 기록하며, 인건비가 낮은 시장에서 이 시스템의 실현 가능성을 입증하고 있습니다.
북미, 남미, 중동은 신흥 시장으로 부상하고 있습니다. 캘리포니아주 상원 법안 제605호는 주 내 연안 자원으로 37GW를 지정하고 있으나, 현재 PacWave South만이 완전한 허가를 취득한 상태입니다. 브라질의 10억 달러 규모의 산타카타리나 이니셔티브는 수입 대체를 목적으로 하는 정부계 펀드의 지원을 보여주는 좋은 사례입니다. 사우디아라비아의 NEOM은 2032년까지 120GW 규모의 재생에너지 도입을 목표로 하는 계획의 일환으로 홍해에서 시제품 평가를 진행 중이며, 일조량이 풍부하고 파력 자원이 풍부한 새로운 지역을 하이브리드 솔루션에 개방할 가능성이 있습니다.
기타 혜택 :
- 엑셀 형식 시장 예측(ME) 시트
- 3개월간의 애널리스트 지원
자주 묻는 질문
목차
제1장 서론
제2장 조사 방법
제3장 주요 요약
제4장 시장 구도
제5장 시장 규모 및 성장 예측
제6장 경쟁 구도
제7장 시장 기회 및 향후 전망
KTHAccording to Mordor Intelligence, the wave energy market size in terms of installed base is projected to be 4 megawatt in 2025, 10 megawatt in 2026, and reach 125 megawatt by 2031, growing at a CAGR of 65.72% from 2026 to 2031.
This report is Segmented by Type (Oscillating Water Column, Others), Deployment Location (Onshore, Near-Shore, Offshore Shallow Shelf, Offshore Deep Water), Application (Power Generation, Desalination, Environmental Protection, Others), and Geography (North America, Europe, Asia-Pacific, South America, Middle East and Africa). The Market Forecasts are Provided in Terms of Volume (MW).
Global Wave Energy Market Trends and Insights
Feed-in-tariff & Contract-for-difference Schemes Expand in EU & APAC
Member-state targets under the European Renewable Energy Directive III require that 5% of new renewable capacity between 2025 and 2030 come from innovative sources, explicitly naming wave technologies. Ireland's Marine Energy Programme, Horizon Europe grants, and Taiwan's first contract-for-difference agreement for wave power create predictable revenue streams that derisk early projects. These incentives shorten payback periods, attract venture backing, and move the wave energy market from prototype trials to pre-commercial clusters. Developers in India and Portugal are already securing long-term tariffs at premiums that mirror early offshore-wind support schemes. The success of these frameworks is prompting other Asia-Pacific governments to draft similar support mechanisms, enlarging the investable project pipeline.
Demand for Ocean-Sourced Baseload Renewables to Balance Wind and Solar
Wave devices deliver capacity factors of 25-35% today and up to 40-48% in optimized forecasts, smoothing supply during solar and wind lulls. Island grids in Hawaii, the Canary Islands, and King Island deploy wave arrays to displace diesel generation without relying on large battery systems. U.S. federal programs such as the Waves to Water Prize fund off-grid desalination buoys that use direct mechanical pressure rather than grid electricity. Commercial operators of remote mining and aquaculture sites adopt wave energy to cut fuel logistics and lower emissions penalties. Collectively, these baseload applications widen the customer base and accelerate scale economies for the wave energy market.
High CAPEX & LCOE Gap Versus Mature Renewables
Wave energy's 2025 levelized cost of USD 388-618 MWh is three to six times that of utility-scale solar, deterring merchant investments. Learning-curve studies by NREL show costs may drop to USD 0.07-0.13 kWh by 2050, conditional on multi-gigawatt roll-outs. Early adopters, therefore, depend on tariffs exceeding USD 351 MWh or direct capital subsidies. In emerging markets, willingness to pay is below USD 0.10 kWh, widening the financing gap. Without continued policy support, the wave energy market risks stalling before economies of scale can unlock parity.
Other drivers and restraints analyzed in the detailed report include:
- Cost Decline from Composite Structures & Modular PTOs
- Rising Venture & Infrastructure Fund Investments in Demonstrator Arrays
- Grid Interconnection & Multi-Agency Permitting Hurdles
For complete list of drivers and restraints, kindly check the Table Of Contents.
Segment Analysis
Oscillating body converters, mainly point absorbers, captured 59.7% of installed capacity in 2025. The wave energy market size for this segment is on course to grow at a 93.5% CAGR, supported by serial production of standardized modules. Phase-control algorithms in devices such as HiWave-5 have lifted energy-capture ratios, helping investors view the technology as near-commercial. The segment's rising reliability underpins a broader shift from survivability testing to revenue-focused deployments.
Demand for point absorbers is reinforced by their flexible mooring options, making them suitable for both breakwater retrofits and shallow-shelf foundations. Composite cladding extends service lives in corrosive marine environments, limiting downtime to scheduled annual inspections. These improvements lower the cost of insurance and financing, securing a durable lead for oscillating body converters within the wave energy market.
Geography Analysis
Europe anchors the wave energy market with 75.1% of installed capacity in 2025. Robust policy support under Renewable Energy Directive III, plus Horizon Europe's USD 273.78 million marine-energy budget, ensures a steady queue of 1-10 MW arrays, feeding a regional supply chain that now exports components to Asia-Pacific. The United Kingdom, Ireland, and Portugal each combine feed-in premiums with test-site infrastructure, accelerating learning rates.
Asia-Pacific shows the fastest growth, charting an 84.4% CAGR through 2031, powered by India's 40 GW theoretical potential, Taiwan's 20 MW medium-term target, and Japan's NEDO-backed demonstrations. Local oil and gas majors in Indonesia and Malaysia are trialing co-location concepts, providing anchor customers for early arrays. China's Beibu Gulf cavity revetment system reports levelized costs near grid parity, proving feasibility in low-labor-cost markets.
North America, South America, and the Middle East are emerging frontiers. California's Senate Bill 605 flags 37 GW of state coastal resources, yet only PacWave South is fully permitted. Brazil's USD 1 billion Santa Catarina initiative exemplifies sovereign-wealth backing aimed at import substitution. Saudi Arabia's NEOM evaluates Red Sea prototypes within its 120 GW 2032 renewable commitment, potentially opening a new high-insolation yet wave-rich geography to hybrid solutions.
- Ocean Power Technologies, Inc.
- Eco Wave Power Ltd.
- Carnegie Clean Energy Ltd.
- CorPower Ocean AB
- AW-Energy Oy
- SINN Power GmbH
- Mocean Energy Ltd.
- Wello Oy
- Wave Swell Energy Ltd.
- Seabased AB
- Resolute Marine Energy, Inc.
- Oscilla Power, Inc.
- Bombora Wave Power Pty Ltd.
- Infinite Power Ltd.
- Havkraft AS
- Floating Power Plant A/S
- Seatricity Ltd.
- AWS Ocean Energy Ltd.
- Wave Dragon ApS
- INGINE Inc.
Additional Benefits:
- The market estimate (ME) sheet in Excel format
- 3 months of analyst support
TABLE OF CONTENTS
1 Introduction
- 1.1 Study Assumptions & Market Definition
- 1.2 Scope of the Study
2 Research Methodology
3 Executive Summary
4 Market Landscape
- 4.1 Market Overview
- 4.2 Market Drivers
- 4.2.1 Feed-in-tariff & contract-for-difference schemes expand in EU & APAC
- 4.2.2 Demand for ocean-sourced baseload renewables to balance wind/solar
- 4.2.3 Cost decline from composite structures & modular PTOs
- 4.2.4 Rising venture & infrastructure fund investments in demonstrator arrays
- 4.2.5 Power-to-X hubs (green hydrogen/ammonia) integrating wave devices
- 4.2.6 Decarbonisation mandates for offshore O&G platforms driving co-location
- 4.3 Market Restraints
- 4.3.1 High CAPEX & LCOE gap versus mature renewables
- 4.3.2 Grid interconnection & multi-agency permitting hurdles
- 4.3.3 Marine-spatial conflict with future deep-sea mining zones
- 4.3.4 Shortage of specialised far-shore maintenance vessels & crew
- 4.4 Supply-Chain Analysis
- 4.5 Regulatory Landscape
- 4.6 Technological Outlook
- 4.7 Porter's Five Forces
- 4.7.1 Threat of New Entrants
- 4.7.2 Bargaining Power of Buyers
- 4.7.3 Bargaining Power of Suppliers
- 4.7.4 Threat of Substitutes
- 4.7.5 Competitive Rivalry
5 Market Size & Growth Forecasts
- 5.1 By Type
- 5.1.1 Oscillating Water Column
- 5.1.2 Oscillating Body Converters
- 5.1.3 Overtopping Converters
- 5.2 By Deployment Location
- 5.2.1 Onshore (fixed breakwater)
- 5.2.2 Near-shore (Up to 2 km, Over 25 m depth)
- 5.2.3 Offshore - Shallow Shelf (2 to 20 km, 25 to 60 m)
- 5.2.4 Offshore - Deep Water (More than 20 km, More than 60 m)
- 5.3 By Application
- 5.3.1 Power Generation
- 5.3.2 Desalination
- 5.3.3 Environmental Protection (breakwaters, reef restoration)
- 5.3.4 Others
- 5.4 By Geography
- 5.4.1 North America
- 5.4.1.1 United States
- 5.4.1.2 Canada
- 5.4.1.3 Mexico
- 5.4.2 Europe
- 5.4.2.1 United Kingdom
- 5.4.2.2 France
- 5.4.2.3 Spain
- 5.4.2.4 Netherland
- 5.4.2.5 Denmark
- 5.4.2.6 Russia
- 5.4.2.7 Rest of Europe
- 5.4.3 Asia-Pacific
- 5.4.3.1 China
- 5.4.3.2 India
- 5.4.3.3 Japan
- 5.4.3.4 South Korea
- 5.4.3.5 ASEAN Countries
- 5.4.3.6 Australia and New Zealand
- 5.4.3.7 Rest of Asia-Pacific
- 5.4.4 South America
- 5.4.4.1 Brazil
- 5.4.4.2 Argentina
- 5.4.4.3 Colombia
- 5.4.4.4 Rest of South America
- 5.4.5 Middle East and Africa
- 5.4.5.1 United Arab Emirates
- 5.4.5.2 Saudi Arabia
- 5.4.5.3 South Africa
- 5.4.5.4 Egypt
- 5.4.5.5 Rest of Middle East and Africa
- 5.4.1 North America
6 Competitive Landscape
- 6.1 Market Concentration
- 6.2 Strategic Moves (M&A, Partnerships, PPAs)
- 6.3 Market Share Analysis (Market Rank/Share for key companies)
- 6.4 Company Profiles (includes Global level Overview, Market level overview, Core Segments, Financials as available, Strategic Information, Products & Services, and Recent Developments)
- 6.4.1 Ocean Power Technologies, Inc.
- 6.4.2 Eco Wave Power Ltd.
- 6.4.3 Carnegie Clean Energy Ltd.
- 6.4.4 CorPower Ocean AB
- 6.4.5 AW-Energy Oy
- 6.4.6 SINN Power GmbH
- 6.4.7 Mocean Energy Ltd.
- 6.4.8 Wello Oy
- 6.4.9 Wave Swell Energy Ltd.
- 6.4.10 Seabased AB
- 6.4.11 Resolute Marine Energy, Inc.
- 6.4.12 Oscilla Power, Inc.
- 6.4.13 Bombora Wave Power Pty Ltd.
- 6.4.14 Infinite Power Ltd.
- 6.4.15 Havkraft AS
- 6.4.16 Floating Power Plant A/S
- 6.4.17 Seatricity Ltd.
- 6.4.18 AWS Ocean Energy Ltd.
- 6.4.19 Wave Dragon ApS
- 6.4.20 INGINE Inc.
7 Market Opportunities & Future Outlook
- 7.1 White-space & Unmet-need Assessment
