
|
시장보고서
상품코드
2063581
세포 분석용 이미지 기반 유세포 분석 : 시장 점유율 분석, 업계 동향 및 통계, 성장 예측(2026-2031년)Image-Based Cytometry In Cell Analysis - Market Share Analysis, Industry Trends & Statistics, Growth Forecasts (2026 - 2031) |
||||||
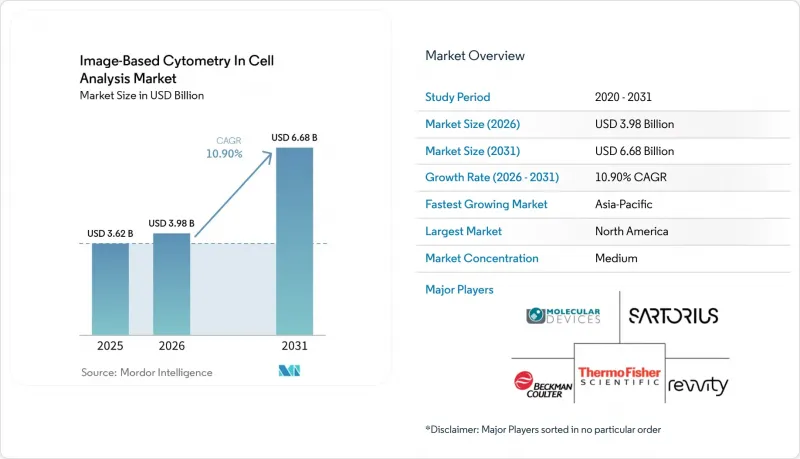
세포 분석용 이미지 기반 유세포 분석 시장 규모는 2025년 36억 2,000만 달러로 평가되었습니다. 2026년에는 39억 8,000만 달러로 확대되어 2031년까지 66억 8,000만 달러에 이를 것으로 예측되며, 2026년부터 2031년에 걸쳐 CAGR 10.90%로 성장할 전망입니다.

본 보고서는 제품별(장비, 소모품 및 시약 등), 용도별(신약 개발 등), 최종 사용자별(제약·바이오기술 기업 등), 지역별(북미, 유럽, 아시아·태평양, 중동 및 아프리카, 남미)로 분류되어 있습니다. 시장 전망은 금액(달러) 기준으로 제시되어 있습니다.
세계의 세포 분석용 이미지 기반 유세포 분석 시장 동향 및 인사이트
AI를 활용한 이미지 분석이 표현형 스크리닝과 예측 독성학의 규모를 확대합니다.
딥러닝 모델은 수동 파이프라인에 비해 이미지 기반 표현형 스크리닝의 정확도와 처리량을 향상시키고 있으며, CG-RecNet은 이미징 유세포분석법에서 라벨이 없는 신경줄기세포 계통 분류에서 96.40%의 정확도를 달성한 것으로 보고되었습니다. PhenoProfiler로 알려진 이 엔드투엔드 모델은 대규모 하이컨텐츠 데이터셋에서 ResNet50 기준 모델에 비해 20%의 정확도 향상을 달성하는 동시에, 다단계 전처리 과정을 생략했습니다. 이를 통해 설치 시간이 단축되고 전문가의 업무 부담도 줄어듭니다. 화학적 특성과 Cell Painting 이미지 특징을 결합한 상용 플랫폼은 이미지만 사용하는 모델보다 더 강력한 독성 예측 능력을 보여주고 있으며, 이를 통해 연구팀은 히트에서 리드로 이어지는 과정에서 위험 요인을 더 조기에 발견할 수 있게 됩니다. 이러한 성과를 바탕으로 연구팀은 발견 워크플로우의 초기 단계에서 단순한 형태학적 라이브러리에서 작용기전 및 안전성 위험을 매핑하는 예측 모델로 전환해 나가고 있습니다. 또한, 임상시험의 전자 시스템 및 기록에 관한 미국의 지침에 따라, 의뢰인은 모델의 검증을 문서화하고, 추적 가능하며 변조 방지 기능을 갖춘 데이터를 유지해야 하며, 이에 따라 검증 근거가 갖춰진 경우 알고리즘을 통한 평가 지표 채택이 장려되고 있습니다.
고도의 이미지 계측 기술이 필요한 3D 세포 모델 및 오가노이드의 급속한 확산
오가노이드 및 기타 3D 세포 모델은 임상 결과와의 일치도가 높아짐에 따라, 전임상 연구에서 그 비중을 확대되고 있습니다. 최근 데이터셋에 따르면, 명시야 이미징에 기반한 약물 반응 지표가 환자 결과와 75-85%의 일치율을 보이고 있습니다. 이미징 하드웨어와 워크플로는 마이크로플루이딕스 아가로스 칩의 도입에 따라 점차 개선되고 있습니다. 이를 통해 채취 중인 시료의 무결성을 유지하면서, 수동 방식에 비해 오가노이드 처리 능력을 35배로 높였습니다. 가상 염색을 이용한 라벨 프리 분석을 통해, 세포 대사를 변화시키는 형광 표지자를 사용하지 않고도 공동 배양에서 T세포의 활성화 정도를 평가할 수 있게 되었으며, 이를 통해 종단적 연구가 지원되고 멀티오믹스 분석용 시료가 보존됩니다. 배지의 조성이나 접종 밀도가 다른 경우, 스페로이드의 크기 등의 지표에서 실험실 간 유의미한 편차가 계속해서 보고되고 있으며, 이는 표준화된 프로토콜과 메타데이터의 필요성을 강조하고 있습니다. 대규모 오가노이드 스크리닝에서 처리량과 측정 재현성을 안정화하고, 며칠에 걸친 실험에서 실험자의 영향을 줄이기 위해 모듈식 자동화 배양 및 이미징 플랫폼이 등장하고 있습니다.
고성능 이미징 사이토미터 및 시약에 드는 막대한 초기 투자 비용과 운영 비용
첨단 시스템은 막대한 구입비와 유지보수비가 필요하기 때문에 소규모 연구실이나 신흥 시장의 기관에게는 예산상의 부담이 됩니다. 운영비는 환경 제어 모듈 및 장기 보존 연구용 소모품에도 적용되며, 연간 유지보수비 외에도 지속적인 비용이 발생합니다. 형광에 의존하는 프로토콜의 경우, 형광 감쇠 방지제나 광 퇴색 방지 대책이 필요하기 때문에 고처리량 스크리닝에서 시약비 부담이 증가합니다. 공유 코어 시설은 고성능 플랫폼에 대한 접근권을 공동으로 활용함으로써 설비 투자 장벽을 낮출 수 있지만, 입지나 이용 시간 배분 측면에서는 자원이 더 풍부한 센터가 유리합니다. 이미징 핵심 시설과 전문 지식의 분포가 고르지 않은 것은 대규모 신약 개발 프로그램에서 처리 능력과 생산성의 지역 간 격차를 더욱 확대시킬 가능성이 있습니다.
부문별 분석
2025년, 소모품 및 시약은 이미지 기반 세포계측기 시장의 58.51%를 차지했습니다. 이는 일상적인 스크리닝 과정에서 색소 패널, 항체, 플레이트, 완충액에 대한 지속적인 수요에 힘입은 결과입니다. 세포 분석용 이미지 기반 유세포 분석 시장 규모 동향은 소프트웨어의 성장에 점점 더 의존하고 있습니다. 이는 사용자들이 구독형 분석 및 자동 해석으로 전환함에 따라, 소프트웨어 및 이미지 분석 분야가 2026년부터 2031년까지 연평균 성장률(CAGR) 12.89%를 달성할 것으로 예측되기 때문입니다. 딥러닝을 활용한 표현형 분석은 엔터프라이즈 플랫폼 내에서 점차 표준화되고 있으며, 이를 통해 운영자에 대한 의존도가 낮아지고, 대규모 운영에서도 결과의 예측 가능성이 높아지고 있습니다. 견고한 분할, 특징 추출, 분류를 턴키 모듈로 제품화한 벤더는 전담 바이오 이미지 분석 팀을 보유하지 않은 연구소 시장 진입 장벽을 낮추고 있습니다. 데이터 수집 및 분석 간의 연계 강화는 물론, 규정 준수를 고려한 데이터 파이프라인을 통해 GxP 워크플로우에서 적합성 확인 후 고객의 충성도 확보가 강화되고 있습니다.
사용자들이 기기나 거점을 초월해 확장 가능한 자동화에 투자함에 따라, 소프트웨어 및 이미지 분석 시장 규모는 하드웨어를 넘어설 것으로 전망됩니다. 한편, 소모품의 성장세는 대규모 선별 검사 프로그램의 도입 기반 확대에 발맞추고 있습니다. 세포 분석용 이미지 기반 유세포 분석 업계에서는 AI의 정확도와 설명 가능한 출력, 배치 간 안정적인 성능을 모두 갖춘 솔루션이 계속해서 높이 평가받고 있으며, 이에 따라 표현형 스크리닝에서 위양성 결과가 감소하고 있습니다.
가격 모델은 초기 라이선스 비용에서 분석 데이터 양에 따른 종량제 과금 방식으로 전환되었으며, 이를 통해 지출과 제공되는 가치가 연동되도록 되었습니다. 경쟁 환경에서는 적절한 감사 추적 기록과 데이터 무결성 보호 조치를 갖추고, 규제 대상인 제조 환경 및 임상 지원 환경으로의 방법 이전을 용이하게 하는 생태계가 우위를 점하고 있습니다. 예측 기간 동안 이러한 추세로 인해 이미지 기반 사이토메트리 시장에서 단독 하드웨어 업그레이드에 비해 소프트웨어 로드맵의 전략적 중요성이 높아질 것으로 전망됩니다.
지역별 분석
2025년 기준으로 북미는 47.44%의 점유율을 차지했습니다. 북미가 지역적으로 선도적인 위치를 차지하고 있는 배경에는 제약 기업의 후원사와 중개연구센터가 집중되어 있다는 점, 그리고 전자 기록 및 데이터 무결성에 대한 명확한 기대 속에서 AI를 활용한 분석이 조기에 도입되고 있다는 점이 꼽힙니다. 또한, 미국 연구개발(R&D) 그룹 전체에 걸쳐 생세포 이미징 기술을 적극적으로 도입함으로써, 플레이트 규모의 표현형 스크리닝 및 동역학 분석을 확대할 때 성능 향상을 뒷받침하고 있습니다. 북미의 세포 분석용 이미지 기반 세포계측학 시장 규모는 광범위한 핵심 시설 네트워크와 공급업체의 존재 덕분에 혜택을 보고 있으며, 이로 인해 새로운 이미징 소프트웨어 및 규정 준수 데이터 파이프라인의 도입 기간이 단축되고 있습니다.
아시아태평양은 이미지 기반 사이토메트리 시장에서 2031년까지 연평균 성장률(CAGR) 12.32%를 기록하며 가장 빠르게 성장하는 지역이 될 것으로 전망됩니다. 아시아태평양에서는 신약 개발, 효능 시험 및 오가노이드 이미징을 지원하기 위해 CRO 및 트랜스레이셔널 허브 전반에 걸쳐 체계가 구축되어 있으며, 이를 통해 바이오의약품 파트너십 전반에 걸친 활용이 확대되고 있습니다. 라벨 프리 분석법 및 가상 염색 도구의 도입은 취약한 시료에 대한 경과 시간에 따른 이미징을 가능하게 하며, 면역학 및 종양학 연구에서 발생하는 교란 요인을 줄여줍니다. 마이크로플루이딕스 유기체 플랫폼을 둘러싼 하드웨어 혁신으로 인해 처리량이 향상되고 수작업이 줄어들고 있으며, 이는 아시아태평양의 주요 연구센터에서 진행 중인 스크리닝 프로그램의 확대 추세와 부합합니다. 점점 더 많은 프로그램이 연구 용도에서 규제 대상 워크플로로 전환됨에 따라, 안전한 이미징 데이터 관리와 감사 가능한 기록에 대한 수요가 아시아태평양의 소프트웨어 조달 방향을 결정짓게 될 것입니다. 이러한 성장 추세에 힘입어 아시아태평양은 세포 분석 시장에서 이미지 기반 세포계측법에 대한 수요 증가의 주요 원동력으로서의 입지를 확고히 하고 있습니다.
유럽 수요는 신약 개발 및 중개 연구 분야에서 견조한 추세를 보이고 있으며, 영상 워크플로우의 표준화와 첨단 플랫폼에 대한 접근성 확대를 추진하는 산학 컨소시엄이 활기를 띠고 있습니다. EU AI법에서는 많은 의료용 영상 분석 시스템이 고위험으로 분류되어 있으며, 이에 따라 문서화 요건과 시판 후 모니터링이 강화되는 한편, 도입을 위한 조화로운 로드맵이 제시되고 있습니다. 중동 및 아프리카 및 남미 각 지역에서는 고해상도 이미징 및 생세포 플랫폼에 대한 접근성을 개선하기 위한 표적화된 노력과 핵심 시설에 대한 투자를 통해, 특정 거점에서의 이미징 역량 확충이 계속되고 있습니다. 예측 기간 동안, 유럽 및 기타 지역의 조달 결정은 이미지 기반 세포계측학 시장에서 강력한 규정 준수 대응 도구와 검증된 이미지 분석법에 대한 명확한 지원을 제공하는 공급업체를 우대하는 방향으로 이루어질 것입니다.
기타 혜택 :
- 엑셀 형식 시장 예측(ME) 시트
- 3개월간의 애널리스트 지원
자주 묻는 질문
목차
제1장 서론
제2장 조사 방법
제3장 주요 요약
제4장 시장 구도
제5장 시장 규모 및 성장 예측
제6장 경쟁 구도
제7장 시장 기회 및 향후 전망
KTH 26.06.26According to Mordor Intelligence, the image-Based cytometry in cell analysis market size is expected to increase from USD 3.62 billion in 2025 to USD 3.98 billion in 2026 and reach USD 6.68 billion by 2031, growing at a CAGR of 10.90% over 2026-2031.
This report is Segmented by Product (Instruments, Consumables & Reagents, and More), Application (Drug Discovery & Development, and More), End User (Pharmaceutical & Biotechnology Companies, and More), and Geography (North America, Europe, Asia-Pacific, Middle East and Africa, South America). The Market Forecasts are Provided in Terms of Value (USD).
Global Image-Based Cytometry In Cell Analysis Market Trends and Insights
AI-Accelerated Image Analysis Scales Phenotypic Screening and Predictive Toxicology
Deep-learning models are raising accuracy and throughput in image-based phenotypic screens compared with manual pipelines, with CG-RecNet reporting 96.40% accuracy for label-free neural stem cell lineage classification in imaging flow cytometry. An end-to-end model known as PhenoProfiler achieved a 20% accuracy improvement over ResNet50 baselines on a large high-content dataset while removing multi-step preprocessing, which shortens setup time and reduces expert effort. Commercial platforms that combine chemical features with Cell Painting image descriptors have shown stronger toxicity prediction than image-only models, which helps teams find liabilities sooner in the hit-to-lead cycle. These gains are steering teams away from descriptive morphology libraries to predictive models that map to mechanism of action and safety risk early in discovery workflows. U.S. guidance on electronic systems and records in clinical investigations is also pushing sponsors to document model validation and maintain traceable, tamper-evident data, which supports the acceptance of algorithmic endpoints when validation evidence is in place.
Rapid Uptake of 3D Cell Models and Organoids Requiring Advanced Image Cytometry
Organoids and other 3D cell models are gaining share in preclinical studies due to stronger alignment with clinical outcomes, with brightfield imaging-based drug response metrics achieving 75-85% concordance with patient results in recent datasets. Imaging hardware and workflows are adapting with microfluidic agarose chips that raise organoid-throughput by 35-fold versus manual methods while preserving sample integrity during acquisition. Label-free analysis with virtual staining now scores T cell activation in co-culture without fluorescent labels that alter cellular metabolism, which supports longitudinal studies and preserves material for multi-omics assays. Studies continue to show meaningful inter-lab variability in spheroid metrics such as size when media composition and seeding densities differ, which underscores the need for standardized protocols and metadata. Modular, automated culture and imaging platforms are emerging to stabilize throughput and measurement repeatability in large organoid screens and to reduce operator effects over multi-day experiments.
High Capital and Operating Costs for Advanced Imaging Cytometers and Reagents
Advanced systems require significant purchase and service commitments, which strain budgets for smaller labs and for institutions in emerging markets. Operating expenses extend to environmental control modules and consumables for long-term lapse studies, which adds recurring cost on top of annual maintenance. Protocols that rely on fluorescence require anti-fade chemistries and photobleaching mitigations, which add to reagent outlays in high-throughput screening. Shared core facilities can offset capital barriers by pooling access to premium platforms, although locations and time allocations favor better-resourced centers. The uneven spread of imaging cores and expertise can reinforce regional disparities in throughput and productivity in large discovery programs.
Other drivers and restraints analyzed in the detailed report include:
- Potency Assurance in Cell & Gene Therapies Elevates Demand for Quantitative Imaging Assays
- Live-Cell Kinetic Imaging Enabling Longitudinal, Non-Perturbing Cell Analytics
- Data Volume, Storage, and Analytics Complexity, Along With Talent Shortages in Bioimage Informatics
For complete list of drivers and restraints, kindly check the Table Of Contents.
Segment Analysis
Consumables & Reagents held 58.51% of the Image-Based Cytometry in Cell Analysis market share in 2025, supported by recurring demand for dye panels, antibodies, plates, and buffers in routine screening. The Image-Based Cytometry in Cell Analysis market size dynamics increasingly hinge on software growth, since Software & Image Analysis is projected to deliver a 12.89% CAGR over 2026-2031 as users shift to subscription analytics and automated interpretation. Deep-learning phenotypic analysis is becoming standard inside enterprise platforms, which reduces operator dependence and makes outcomes more predictable at scale. Vendors that productize robust segmentation, feature extraction, and classification into turnkey modules are lowering the barrier for labs without dedicated bioimage analysis teams. Tighter links between acquisition and analytics, plus compliance-friendly data pipelines, are strengthening customer lock-in after qualification in GxP workflows.
Software & Image Analysis is set to outpace hardware as users fund automation that scales across instruments and sites, while consumables growth follows the expanding installed base in large screening programs. The Image-Based Cytometry in Cell Analysis industry continues to reward solutions that couple AI accuracy with explainable outputs and stable performance across batches, which reduces false positives in phenotypic screens.
Pricing models are moving from upfront licenses toward usage-based billing linked to data analyzed, which aligns spending to delivered value. Competition favors ecosystems that ease method transfer into regulated manufacturing and clinical support settings with proper audit trails and data integrity safeguards. Over the forecast period, this mix raises the strategic weight of software roadmaps relative to standalone hardware upgrades in the Image-Based Cytometry in Cell Analysis Market.
Geography Analysis
North America held 47.44% in 2025. The regional lead in North America reflects a concentration of pharmaceutical sponsors, translational research centers, and early adoption of AI-enabled analysis under clear expectations for electronic records and data integrity. Strong live-cell imaging adoption across U.S. R&D groups also supports performance gains when scaling phenotypic screening and kinetic assays at plate scale. The Image-Based Cytometry in Cell Analysis market size in North America benefits from extensive core-facility networks and vendor presence, which shortens deployment timelines for new imaging software and compliant data pipelines.
Asia-Pacific is projected as the fastest-growing region with a 12.32% CAGR through 2031 for the Image-Based Cytometry in Cell Analysis Market. Asia-Pacific is building capacity across CROs and translational hubs to support discovery, potency testing, and organoid imaging, which is raising utilization across biopharma partnerships. Adoption of label-free assays and virtual staining tools supports longitudinal imaging on fragile samples and reduces perturbation in immunology and oncology studies. Hardware innovation around microfluidic organoid platforms is increasing throughput and driving down manual handling, which aligns with expanding screening programs in key APAC research centers. As more programs move from research use to regulated workflows, the need for secure imaging data management and auditable records will shape software procurement in APAC. This growth profile positions Asia-Pacific as the key engine for incremental demand in the Image-Based Cytometry in Cell Analysis Market.
Europe's demand is steady across discovery and translational use, with momentum in academic-industry consortia that standardize imaging workflows and expand access to advanced platforms. The EU AI Act labels many healthcare image-analysis systems as high risk, which raises documentation needs and post-market monitoring but provides a harmonized route for deployment. Regions in the Middle East and Africa and in South America continue to expand imaging capability at select hubs, often through targeted initiatives and core facility investments that improve access to high-content and live-cell platforms. Over the forecast, procurement decisions across Europe and other regions will reward vendors with strong compliance tooling and clear support for validated image assays in the Image-Based Cytometry in Cell Analysis Market.
- Agilent Technologies
- Beckman Coulter Life Sciences
- ChemoMetec
- Cytek Biosciences
- DeNovix
- Evident (Olympus)
- Miltenyi Biotec
- Molecular Devices
- Nikon Instruments
- Phasefocus
- Revvity
- Sartorius
- SYNENTEC
- Tecan Group
- Thermo Fisher Scientific
- Yokogawa Electric
- ZEISS
Additional Benefits:
- The market estimate (ME) sheet in Excel format
- 3 months of analyst support
TABLE OF CONTENTS
1 Introduction
- 1.1 Study Assumptions & Market Definition
- 1.2 Scope of the Study
2 Research Methodology
3 Executive Summary
4 Market Landscape
- 4.1 Market Overview
- 4.2 Market Drivers
- 4.2.1 AI-accelerated image analysis scales phenotypic screening and predictive toxicology
- 4.2.2 Expansion of drug discovery & development workflows using high-content imaging
- 4.2.3 Rapid uptake of 3D cell models and organoids requiring advanced image cytometry
- 4.2.4 Live-cell kinetic imaging enabling longitudinal, non-perturbing cell analytics
- 4.2.5 Potency assurance in cell & gene therapies elevates demand for quantitative imaging assays
- 4.2.6 Data-integrity and audit-trail compliance (21 CFR Part 11) push validated image-data platforms
- 4.3 Market Restraints
- 4.3.1 High capital and operating costs for advanced imaging cytometers and reagents
- 4.3.2 Data volume, storage, and analytics complexity; talent shortages in bioimage informatics
- 4.3.3 Phototoxicity/photobleaching constraints limiting live-cell assay fidelity and throughput
- 4.3.4 Validation and metric-standardization gaps for AI pipelines in regulated use cases
- 4.4 Supply-Chain Analysis
- 4.5 Regulatory Landscape
- 4.6 Technological Outlook
- 4.7 Porter's Five Forces
- 4.7.1 Threat of New Entrants
- 4.7.2 Bargaining Power of Suppliers
- 4.7.3 Bargaining Power of Buyers
- 4.7.4 Threat of Substitutes
- 4.7.5 Industry Rivalry
5 Market Size & Growth Forecasts (Value, USD)
- 5.1 By Product
- 5.1.1 Instruments
- 5.1.2 Consumables & Reagents
- 5.1.3 Software & Image Analysis
- 5.1.4 Services
- 5.2 By Application
- 5.2.1 Drug Discovery & Development
- 5.2.2 Advanced Cell Models
- 5.2.3 Cell & Gene Therapy Analytics
- 5.2.4 Clinical Research & Diagnostics
- 5.3 By End User
- 5.3.1 Pharmaceutical & Biotechnology Companies
- 5.3.2 Academic & Research Institutes
- 5.3.3 CROs & CDMOs
- 5.3.4 Hospitals & Clinical Laboratories
- 5.4 By Geography
- 5.4.1 North America
- 5.4.1.1 United States
- 5.4.1.2 Canada
- 5.4.1.3 Mexico
- 5.4.2 Europe
- 5.4.2.1 Germany
- 5.4.2.2 United Kingdom
- 5.4.2.3 France
- 5.4.2.4 Italy
- 5.4.2.5 Spain
- 5.4.2.6 Rest of Europe
- 5.4.3 Asia-Pacific
- 5.4.3.1 China
- 5.4.3.2 Japan
- 5.4.3.3 India
- 5.4.3.4 Australia
- 5.4.3.5 South Korea
- 5.4.3.6 Rest of Asia-Pacific
- 5.4.4 Middle East and Africa
- 5.4.4.1 GCC
- 5.4.4.2 South Africa
- 5.4.4.3 Rest of Middle East and Africa
- 5.4.5 South America
- 5.4.5.1 Brazil
- 5.4.5.2 Argentina
- 5.4.5.3 Rest of South America
- 5.4.1 North America
6 Competitive Landscape
- 6.1 Market Concentration
- 6.2 Market Share Analysis
- 6.3 Company Profiles {(includes Global level Overview, Market level overview, Core Segments, Financials as available, Strategic Information, Market Rank/Share for key companies, Products & Services, and Recent Developments)}
- 6.3.1 Agilent Technologies
- 6.3.2 Beckman Coulter Life Sciences
- 6.3.3 ChemoMetec
- 6.3.4 Cytek Biosciences
- 6.3.5 DeNovix
- 6.3.6 Evident (Olympus)
- 6.3.7 Miltenyi Biotec
- 6.3.8 Molecular Devices
- 6.3.9 Nikon Instruments
- 6.3.10 Phasefocus
- 6.3.11 Revvity
- 6.3.12 Sartorius
- 6.3.13 SYNENTEC
- 6.3.14 Tecan Group
- 6.3.15 Thermo Fisher Scientific
- 6.3.16 Yokogawa Electric Corporation
- 6.3.17 ZEISS
7 Market Opportunities & Future Outlook
- 7.1 White-space & unmet-need assessment
