
|
시장보고서
상품코드
2063895
서유럽의 재생에너지 시장 : 시장 점유율 분석, 업계 동향 및 통계, 성장 예측(2026-2031년)West Europe Renewable Energy - Market Share Analysis, Industry Trends & Statistics, Growth Forecasts (2026 - 2031) |
||||||
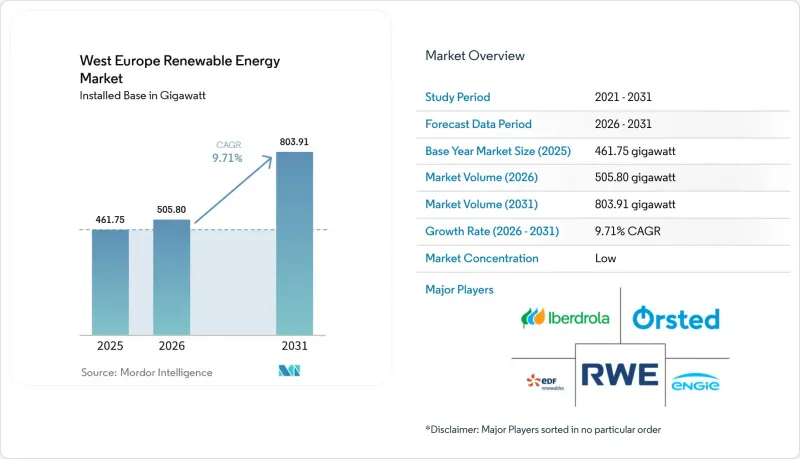
Mordor Intelligence에 의하면, 서유럽 재생에너지 시장 규모(도입 용량 기반)는 2025년 461.75기가와트로 평가되었고, 2026년에는 505.80기가와트로 추정되고, 2031년까지 803.91기가와트에 이를 것으로 예측되며, 2026-2031년 CAGR 9.71%로 성장할 전망입니다.

본 보고서는 기술별(태양광, 풍력, 수력, 바이오에너지, 지열, 해양 에너지), 최종 사용자별(유틸리티, 상업 및 산업, 주택), 지역별(독일, 영국, 프랑스, 아일랜드, 네덜란드, 벨기에, 룩셈부르크, 기타 서유럽)로 분류되어 있습니다. 시장 전망은 용량(GW) 단위로 제시되어 있습니다.
서유럽의 재생에너지 시장 동향 및 인사이트
EU 그린딜과 2030년 목표
유럽연합 집행위원회는 ‘REPowerEU’ 계획에 따라 모든 회원국에 2030년까지 재생에너지의 전력 점유율을 42.5%로 높일 것을 의무화하고 있으며, 목표치로 45%의 상한선을 설정하고 있습니다. 독일의 개정 기후법은 2030년까지 재생에너지 발전 비중을 80%로 높일 것을 의무화하고 있으며, 2025년 기준치를 넘어 추가로 115GW의 태양광 발전과 30GW의 해상 풍력 발전이 필요합니다. 2025년 12월 아일랜드에서 결정된 900MW 규모의 ORESS Tonn Nua 입찰에서는 기준 가격이 98.719유로/MWh로 설정되어, 지역별 연평균 성장률(CAGR) 15.50%를 뒷받침하고 있습니다. 재생에너지에 의한 열 공급 및 운송 부문의 분야별 세부 목표는 간접적인 전력 수요를 더욱 높이고 있는 반면, ‘재생에너지 우선’ 지역에서는 인허가까지 소요되는 기간을 9년에서 2년 이하로 단축할 것으로 전망됩니다. 이 구역에서 이미 부지를 확보한 개발업체는 선구자로서 비용 면에서 우위를 점할 수 있습니다.
풍력·태양광 발전의 LCOE의 급격한 하락
유럽의 재생에너지 평균 LCOE는 2025년에 7% 하락했으며, 북해 해상 풍력 발전의 경우 2026년 가동 예정인 프로젝트에서 50-60유로/MWh까지 떨어졌습니다. 배출권 비용이 톤당 80유로인 탓에, 가스 발전소의 운영 비용에 40-50유로/MWh가 추가되어, 경쟁 구도가 재생에너지 쪽으로 기울고 있습니다. 그러나 영국의 제7차 할당 라운드에서 73파운드/MWh 전후의 행사 가격으로 인해, 2026년 초 현재 계획 중인 82개 프로젝트 중 75개는 여전히 최종 투자 결정에 이르지 못하고 있습니다. 독일의 온사이트 태양광 발전 PPA 계약 기간이 평균 19년으로, 오프사이트 계약보다 7년 더 긴 점을 보아도 알 수 있듯이, 기업 구매자들은 절대적인 비용보다 수익의 안정성을 점점 더 중요하게 여기고 있습니다. 이러한 추세는 하드웨어 비용의 하락에도 불구하고 마진이 압박받고 있음을 보여주며, 즉 송전망 접근성과 가격 헤지가 순수한 LCOE(균등화 발전 원가) 기준보다 더 중요하게 여겨지게 되었음을 의미합니다.
송전망의 혼잡과 상호 연결의 병목 현상
2024년, 60TWh의 재생에너지 발전량이 억제되거나 우회된 결과, 유럽의 송전 재조정 비용은 43억 유로에 달했습니다. 한편, 국경을 넘는 연계선의 이용률은 규제 당국이 설정한 70% 목표에 비해 54% 수준에서 정체되어 있습니다. 독일의 남북 회랑에서는 슐레스비히-홀슈타인 주의 해상 풍력 발전이 바이에른 주 수요 중심지로의 송전 용량을 압도하고 있어, 이미 연간 최대 8TWh가 제한되고 있습니다. 영국에서는 2026년 초까지 82건의 해상 풍력 발전 프로젝트 중 최종 투자 결정에 이른 것은 고작 7건에 그쳐, 2030년 목표인 55GW에 비해 12.4GW의 격차가 발생하고 있습니다. 이는 항만이나 송전망의 현대화 작업에 대부분의 자금 조달 기간보다 6-10년 더 오래 걸리기 때문입니다. 네덜란드의 TenneT는 육상 변전소의 제약으로 인해 북해로의 신규 연결을 2029년까지 연기했습니다. 이로 인해 국가 목표 달성에 필요한 연간 3GW의 증설 속도에 비해, 실질적으로는 연간 1.5GW의 증설로 제한되게 됩니다. 이러한 병목 현상으로 인해, 송전망의 대기 현상을 완전히 피할 수 있는 ‘계량기 뒤편’의 태양광 발전 및 분산형 축전지의 전략적 가치가 높아지고 있습니다. 대규모 송전망의 현대화가 가속화되지 않는 한, 계통 연계 상한선으로 인해 예상되는 연평균 성장률(CAGR)이 약 1.4포인트 하락하는 추세가 지속될 것으로 전망됩니다.
부문별 분석
해양 에너지는 기준선상에서는 소규모였으나, 서유럽의 재생에너지 시장에서 기술별로는 가장 높은 연평균 성장률(CAGR) 17.45%를 기록하며 성장할 것으로 전망됩니다. 이 부문은 몰레(Morlais)에 위치한 30MW 규모의 HydroWing 조력 발전 어레이와, 시제품 단계에서 다중 터빈 어레이로 전환되고 있는 프랑스의 250MW 규모 프로젝트의 혜택을 받고 있습니다. 태양광 발전은 2025년 기준 설치 용량의 46.63%를 차지했으며, 30유로/MWh 이하의 LCOE(균등화 발전 원가) 덕분에 프로젝트 파이프라인은 탄탄하지만, 부지 확보의 제약과 출력 제한에 대한 우려로 인해 대규모 발전소의 신규 건설은 주춤하고 있습니다. 풍력 발전은 15MW급 터빈과 부유식 기초의 보급에 힘입어, 여전히 대규모 전력 공급의 핵심 원천으로서의 위상을 유지하고 있습니다. 수력 발전과 바이오에너지는 조절형 안정 공급원이 되지만, 유럽의 직접 일사량이 중간 수준이기 때문에 CSP의 점유율은 여전히 극히 미미합니다.
해양 발전 자산은 예측 가능한 일주기 출력을 가능하게 하고, 저녁 시간대의 출력 조정을 용이하게 함으로써, 10GW 규모의 도입 시 송전 사업자가 연간 14억 6,000만 영국 파운드의 시스템 비용을 절감하는 데 기여합니다. 용량 시장 규정이 개정되어 송전망 지원의 이점이 금전적으로 평가되자, 벤더 파이낸싱은 프로젝트 담보형 채권으로 전환되었습니다. 조수의 예측 가능성, 파력 자원의 규모, 개정된 보상 체계가 맞물리면서 서유럽 재생에너지 시장 규모에 대한 해양 기술의 기여도가 가속화되고 있는 이유를 설명하고 있습니다. 이베르드롤라(Iberdrola)사의 274MW 풍력+타메가(Tame) 계획과 같은 병렬 양수 발전 하이브리드 방식은 새로운 가스 피크 발전소를 추가하지 않고도 조절형 재생에너지가 어떻게 확대되고 있는지를 보여줍니다.
기타 혜택
- 엑셀 형식 시장 예측(ME) 시트
- 3개월간의 애널리스트 지원
자주 묻는 질문
목차
제1장 서론
제2장 조사 방법
제3장 주요 요약
제4장 시장 구도
제5장 시장 규모 및 성장 예측
제6장 경쟁 구도
제7장 시장 기회 및 향후 전망
AJYAccording to Mordor Intelligence, the west europe renewable energy market size in terms of installed base is expected to increase from 461.75 gigawatt in 2025 to 505.80 gigawatt in 2026 and reach 803.91 gigawatt by 2031, growing at a CAGR of 9.71% over 2026-2031.
This report is Segmented by Technology (Solar Energy, Wind Energy, Hydropower, Bioenergy, Geothermal, Ocean Energy), End-User (Utilities, Commercial and Industrial, Residential), and Geography (Germany, United Kingdom, France, Ireland, Netherlands, Belgium, Luxembourg, Rest of West Europe). Market Forecasts are Provided in Terms of Volume (GW).
West Europe Renewable Energy Market Trends and Insights
EU Green Deal & 2030 Targets
The European Commission requires every member state to meet a 42.5% renewable-electricity share by 2030, with an aspirational 45% ceiling under REPowerEU. Germany's updated climate act mandates 80% renewable power by 2030, demanding a further 115 GW of solar and 30 GW of offshore wind beyond 2025 baselines. Ireland's 900 MW ORESS Tonn Nua award in December 2025 set a benchmark price of EUR 98.719/MWh, underpinning a 15.50% geographic CAGR. Sectoral sub-targets for renewable heat and transport intensify indirect electricity demand, while "renewables-go-to" areas promise to cut permitting lead-times from nine years to fewer than two. Developers that have already secured land in these zones gain a first-mover cost advantage.
Rapid LCOE Decline for Wind & Solar
Europe's average renewable LCOE fell 7% in 2025, with offshore wind in the North Sea dipping to EUR 50-60/MWh for 2026-bound projects . At EUR 80/tonne, emission-allowance costs add EUR 40-50/MWh to gas-plant dispatch, pivoting competitiveness toward renewables. However, U.K. Allocation Round 7 strike prices near GBP 73/MWh still left 75 of 82 pipeline projects without final investment decisions as of early 2026 . Corporate buyers increasingly prize revenue stability over absolute cost, as demonstrated by German on-site solar PPAs averaging 19-year terms seven years longer than off-site deals. The pattern reveals margin compression despite falling hardware costs, meaning grid access and price hedging now trump pure LCOE benchmarks.
Grid Congestion & Interconnection Bottlenecks
Europe's transmission redispatch costs reached EUR 4.3 billion in 2024 after 60 TWh of renewable output was curtailed or rerouted, while cross-border interconnector utilization stalled at 54 % against the 70 % target set by regulators. Germany's north-south corridor already curtails up to 8 TWh a year because offshore wind in Schleswig-Holstein overwhelms grid capacity to Bavarian demand centers . In the U.K., only 7 of 82 offshore-wind projects reached final investment decision by early 2026, exposing a 12.4 GW gap to the 55 GW 2030 goal because port and grid upgrades require 6-10 years longer than most financing windows. The Netherlands' TenneT delayed new North Sea connections until 2029 owing to onshore substation constraints, effectively capping annual additions at 1.5 GW versus the 3 GW pace needed to hit national targets. These bottlenecks elevate the strategic value of behind-the-meter solar and distributed batteries that bypass transmission queues altogether. Unless large-scale grid modernization accelerates, interconnection caps will continue to shave roughly 1.4 percentage points from forecast CAGR.
Other drivers and restraints analyzed in the detailed report include:
- Corporate PPAs Surge
- Battery-ready Co-location Mandates (2025 reform)
- Lengthy Permitting Procedures
For complete list of drivers and restraints, kindly check the Table Of Contents.
Segment Analysis
Ocean energy held a modest baseline yet is forecast to grow at 17.45% CAGR, the fastest rate among technologies in the West Europe renewable energy market . The segment benefits from the 30 MW HydroWing tidal array at Morlais and France's 250 MW pipeline moving from prototype toward multi-turbine arrays. Solar retained 46.63% of installed capacity in 2025 as sub-EUR 30/MWh LCOE kept project pipelines full, although land limits and curtailment headwinds slow incremental utility-scale builds. Wind power, bolstered by 15 MW turbines and floating foundations, remains the foundational bulk-capacity provider. Hydropower and bioenergy supply dispatchable stability, while CSP's share stays negligible owing to Europe's moderate direct normal irradiance.
Ocean assets also enable predictable diurnal output that eases evening ramps, helping transmission operators cut system costs by GBP 1.46 billion annually at 10 GW deployment. Vendor financing has shifted toward project-backed bonds once grid-support benefits are monetized under updated capacity-market rules. The confluence of tidal predictability, wave resource scale, and updated remuneration frameworks explains the accelerating contribution of ocean technologies to the West Europe renewable energy market size. Parallel pumped-storage hybrids, such as Iberdrola's 274 MW wind-plus-Tamega scheme, showcase how dispatchable renewables are expanding without adding new gas peakers.
List of Companies Covered in this Report:
- Orsted A/S
- Iberdrola SA
- EDF Renewables (Electricite de France)
- Engie SA
- RWE Renewables GmbH
- Vestas Wind Systems A/S
- Siemens Gamesa Renewable Energy SA
- TotalEnergies SE
- Enel Green Power SpA
- Statkraft AS
- General Electric Co. (GE Vernova)
- Renewable Energy Systems Ltd. (RES)
- Nordex SE
- ACCIONA Energia
- BayWa r.e. AG
- EDP Renovaveis
- Lightsource BP
- Equinor ASA
- JinkoSolar Holding Co. Ltd.
- Ecotricity Group Ltd.
Additional Benefits:
- The market estimate (ME) sheet in Excel format
- 3 months of analyst support
TABLE OF CONTENTS
1 Introduction
- 1.1 Study Assumptions & Market Definition
- 1.2 Scope of the Study
2 Research Methodology
3 Executive Summary
4 Market Landscape
- 4.1 Market Overview
- 4.2 Market Drivers
- 4.2.1 EU Green Deal & 2030 Targets
- 4.2.2 Rapid LCOE Decline for Wind & Solar
- 4.2.3 Corporate PPAs Surge
- 4.2.4 Battery-ready Co-location Mandates (2025 reform)
- 4.2.5 Hydrogen-linked Renewable Projects
- 4.2.6 Indexed CfD-style Auctions
- 4.3 Market Restraints
- 4.3.1 Grid Congestion & Interconnection Bottlenecks
- 4.3.2 Lengthy Permitting Procedures
- 4.3.3 Rare-earth & Installation Vessel Shortages
- 4.3.4 Farmland-use Opposition to Utility Solar
- 4.4 Supply-Chain Analysis
- 4.5 Regulatory Landscape
- 4.6 Technological Outlook
- 4.7 Porter's Five Forces
- 4.7.1 Bargaining Power of Suppliers
- 4.7.2 Bargaining Power of Buyers
- 4.7.3 Threat of New Entrants
- 4.7.4 Threat of Substitutes
- 4.7.5 Competitive Rivalry
5 Market Size & Growth Forecasts
- 5.1 By Technology
- 5.1.1 Solar Energy (PV and CSP)
- 5.1.2 Wind Energy (Onshore and Offshore)
- 5.1.3 Hydropower (Small, Large, PSH)
- 5.1.4 Bioenergy
- 5.1.5 Geothermal
- 5.1.6 Ocean Energy (Tidal and Wave)
- 5.2 By End-User
- 5.2.1 Utilities
- 5.2.2 Commercial and Industrial
- 5.2.3 Residential
- 5.3 By Geography
- 5.3.1 Germany
- 5.3.2 United Kingdom
- 5.3.3 France
- 5.3.4 Ireland
- 5.3.5 Netherlands
- 5.3.6 Belgium
- 5.3.7 Luxembourg
- 5.3.8 Rest of West Europe
6 Competitive Landscape
- 6.1 Market Concentration
- 6.2 Strategic Moves (M&A, JVs, Funding, PPAs)
- 6.3 Market Share Analysis (Market Rank/Share for key companies)
- 6.4 Company Profiles (includes Global-level Overview, Market-level Overview, Core Segments, Financials, Strategic Information, Products & Services, Recent Developments)
- 6.4.1 Orsted A/S
- 6.4.2 Iberdrola SA
- 6.4.3 EDF Renewables (Electricite de France)
- 6.4.4 Engie SA
- 6.4.5 RWE Renewables GmbH
- 6.4.6 Vestas Wind Systems A/S
- 6.4.7 Siemens Gamesa Renewable Energy SA
- 6.4.8 TotalEnergies SE
- 6.4.9 Enel Green Power SpA
- 6.4.10 Statkraft AS
- 6.4.11 General Electric Co. (GE Vernova)
- 6.4.12 Renewable Energy Systems Ltd. (RES)
- 6.4.13 Nordex SE
- 6.4.14 ACCIONA Energia
- 6.4.15 BayWa r.e. AG
- 6.4.16 EDP Renovaveis
- 6.4.17 Lightsource BP
- 6.4.18 Equinor ASA
- 6.4.19 JinkoSolar Holding Co. Ltd.
- 6.4.20 Ecotricity Group Ltd.
7 Market Opportunities & Future Outlook
- 7.1 White-Space & Unmet-Need Assessment
