
|
시장보고서
상품코드
2063897
자동 수요 반응 관리 시스템 시장 : 시장 점유율 분석, 업계 동향 및 통계, 성장 예측(2026-2031년)Automated Demand Response Management System - Market Share Analysis, Industry Trends & Statistics, Growth Forecasts (2026 - 2031) |
||||||
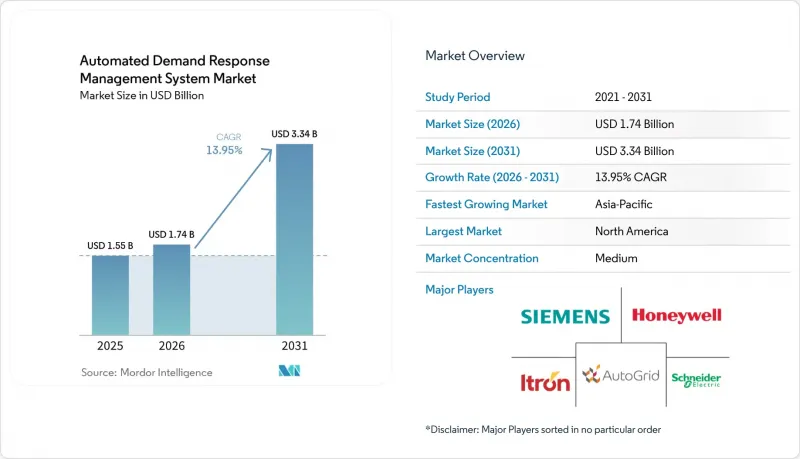
Mordor Intelligence에 의하면, 자동 수요 반응 관리 시스템 시장 규모는 2025년 15억 5,000만 달러로 평가되었고, 2026년 17억 4,000만 달러로 추정되고, 2031년까지 33억 4,000만 달러로 확대될 전망이며, 2026-2031년 연평균 복합 성장률(CAGR)은 13.95%를 나타낼 것으로 예측됩니다.

본 보고서는 솔루션별(자동 DR 관리 및 분석 플랫폼, 기타), 통신 기술별(유선, 기타), 배포 모델별(온프레미스, 클라우드 기반), 최종 사용자 산업별(주택, 기타), 지역별(북미, 유럽, 아시아태평양, 남미, 중동 및 아프리카)로 분류되어 있습니다. 시장 전망은 금액(달러) 기준으로 제시되어 있습니다.
세계의 자동 수요 반응 관리 시스템 시장 동향 및 인사이트
동적 전기요금의 보급
시간대별 요금 및 실시간 가격 책정을 통해 고객은 도매 가격 변동의 영향을 받게 되며, 피크 시간대에 전력을 자동으로 절감할 경우 이에 대한 보상이 주어지게 됩니다. 서던 캘리포니아 에디슨(Southern California Edison)의 2024년 유연 가격 책정 시범 사업에서 참여 가구의 요금이 12% 절감되었으며, 예냉식 온도 조절기의 대규모 자동화가 가능하다는 사실이 입증되었습니다. 뉴질랜드의 2025년 요금 개혁에 따라, 2027년까지 모든 소매업체는 동적 요금 옵션을 제공해야 하며, 상업용 포트폴리오에서 냉장 및 HVAC 부하의 전환이 촉진되고 있습니다. 영국의 ‘애자일(Agile)’ 프로그램에서 2024-2025년 실시된 계통 서비스 점검 결과, 저녁 시간대 수요가 9% 감소했습니다. 이를 통해 신속한 출동과 투명한 요금 체계를 결합한 조치의 효과가 입증되었습니다. 어그리게이터는 수요의 급증에 대비하기 위해 머신러닝을 활용한 가격 예측 기능을 도입했으며, 이를 통해 고객의 비용 절감 효과와 참여율이 더욱 향상되고 있습니다.
고도 계량 인프라(AMI)의 전국적 확대
미국 내 스마트 계량기 보급률은 2019년 50%에서 2024년에는 88%에 달했으며, 전력 회사에는 5분 간격의 가격 신호와 부하 검증에 필요한 간격 데이터가 제공되게 되었습니다. 컨솔리데이티드 에디슨(Consolidated Edison)사가 뉴욕 전역에 이 시스템을 도입함에 따라 양방향 통신 보급률이 98%에 달했으며, 안전한 펌웨어 업데이트에 기반한 가정용 프로그램의 길이 열렸습니다. EU의 스마트 계량기 지침이나 중국 국가전망의 의무화 조치 역시 이와 같은 업그레이드를 추진하고 있지만, 지방 협동조합이나 지방자치단체의 유틸리티자들은 설비 투자 제약으로 인해 뒤처지고 있습니다. 고해상도 데이터를 통해 AI 모델은 가전제품의 부하를 분석하고 배전을 미세 조정할 수 있게 되었지만, 이는 월별 검침으로는 불가능했습니다.
양방향 DR 통신의 사이버 보안 취약점
NIST IR 8473에는 송전 신호 탈취나 사용량 데이터 유출을 유발할 가능성이 있는 37가지 공격 시나리오가 나열되어 있으며, 이에 따라 전력 회사들은 인증서 기반 인증 및 장치 수준의 이상 감지를 요구하고 있습니다. 국제에너지기구(IEA)의 보고서에 따르면, 2024년 에너지 부문에서 발생한 사이버 사고는 25% 증가했으며, 그중 일부는 수요 반응(DR) 플랫폼을 표적으로 한 것이었습니다. IEEE의 조사에 따르면, 도입 사례의 62%에서 여전히 완전한 종단 간암호화가 이루어지지 않고 있으며, 이로 인해 조달 과정에서 침투 테스트 의무화 및 침해 보험 조항의 도입이 추진되고 있습니다.
부문별 분석
2025년에는 전력 회사가 기존 SCADA 시스템과 통합함에 따라, 자동 수요 대응 관리 및 분석 플랫폼이 매출의 41.4%를 차지했습니다. 전력 회사가 ISO(독립계통운영기관)의 스케줄링, 가입 절차, 결제 업무를 제3자 전문 업체에 이관함에 따라, 서비스 부문의 자동 수요 반응 관리 시스템 시장 규모는 2031년까지 연평균 성장률(CAGR) 15.3%로 확대될 것으로 전망됩니다. 매니지드 서비스 공급업체는 온도 조절기, 배터리, 전기차 충전기 등 다양한 기기를 통합함으로써 엔드포인트당 비용을 절감하는 한편, 성능 관련 위험을 감수하고 있습니다. EnergyHub 인수 이후의 포트폴리오와 같은 턴키형 서비스는 현재 250만 건 이상의 분산형 에너지 자원(DER)을 포괄하고 있으며, 이는 대부분의 유틸리티자가 자체적으로 달성할 수 없는 규모입니다.
서비스의 성장은 공정한 성과를 이끌어내야 한다는 규제적 압력도 반영하고 있습니다. 프로그램 관리자는 애그리게이터의 콜센터와 디지털 포털을 활용하여 소외된 지역사회를 신속하게 모집하고 있습니다. 수직 통합형 유틸리티자들은 여전히 수익 유출을 막기 위해 독자적인 DERMS(분산형 에너지 자원 관리 시스템) 도입을 검토하고 있는 반면, 경쟁 소매 공급업체들은 시장 정산 가격에 연동된 성과 기반 계약을 선호합니다. 그 결과, 플랫폼 공급업체들은 컨설팅, 통합, 결제 서비스를 통합된 구독 서비스로 묶어가고 있습니다.
2025년 도입 실적에서 무선 메시가 42.8%를 차지했으나, 유틸리티자들이 AMI 보안 요건을 충족하는 통신사업자의 네트워크를 선호함에 따라 셀룰러 프로토콜은 연평균 성장률(CAGR) 17.4%로 성장할 것으로 전망됩니다. 셀룰러 방식의 자동 수요 반응 관리 시스템(DERMS) 시장 점유율은 고가의 게이트웨이를 도입할 필요 없이 CPUC의 암호화 규정을 충족하는 SIM 기반 키 프로비저닝에 힘입어 유지되고 있습니다. NB-IoT의 5달러 미만 모듈과 10년 이상의 배터리 수명 덕분에, 주거용 엔드포인트당 비용은월2달러 미만으로 떨어지며, 이는 대규모 도입에 있어 매우 중요합니다.
『Studies in Sensors』지에 따르면, LoRa 하이브리드 방식에서는 94%의 패킷 전달률이 확인되었으나, 과금 백엔드와의 통합에 어려움이 있다는 점이 지적되고 있습니다. 한편, PRIME 규격이 정착된 유럽에서는 PLC가 여전히 틈새 시장 수준에 머물러 있습니다. 지연 제약으로 인해, 정밀도가 높은 주파수 제어는 유선 이더넷이나 광섬유에 맡겨지고, 5분 단위의 디스패치 서비스는 셀룰러 단말기에 맡겨져 있습니다. 따라서 유틸리티자는 온프레미스 고속 루프와 LTE-M을 통해 제공되는 클라우드 분석을 결합한 계층형 아키텍처를 채택하고 있습니다.
지역별 분석
북미는 2025년 수익의 47.1%를 차지했으며, 분산형 에너지 자원(DER)에 관한 가장 정교한 규제 체계를 갖추고 있습니다. 캘리포니아주는 2025-2027년 수요 반응(DR)에 2억 달러 이상의 예산을 편성하고, 1GW의 신규 유연 용량을 확보하는 것을 목표로 하는 한편, 참가자의 60%를 취약 계층이 거주하는 지역에서 확보하도록 의무화하고 있습니다. ERCOT는 2024년에 3,200MW 규모의 경제적 수요 반응(DR) 용량을 등록했으나, 며칠간 지속된 폭염 시 백업 전원에 대한 우려로 인해 주택 부문의 기여도는 여전히 10% 미만에 그치고 있습니다. 캐나다 온타리오주 ISO는 2024년 용량 경매를 수요 반응(DR) 자원에 개방했으며, 멕시코는 몬테레이에서 시간대별 요금 시범 사업을 시작하여 미국을 넘어 대륙 차원의 확대를 시사하고 있습니다.
아시아태평양은 가장 성장세가 두드러지는 지역으로, 연평균 성장률(CAGR)은 16.7%로 전망됩니다. 중국의 국가 가상 발전소(VPP) 프로그램은 초여름 운영 기간 동안 1MW 이상의 출력을 조절하며, 2030년까지 전국 규모로 확대하기 위한 정부의 지원을 받고 있습니다. 인도 중앙전력청은 2030년까지 27GW 규모의 배터리 저장 설비와 20GW 규모의 양수 발전 설비를 구축할 것을 요청하고 있습니다. AutoGrid와 PTC India의 제휴를 통해 AI 오케스트레이션을 활용하여 유연한 공조(HVAC) 및 전기차(EV) 부하를 통합할 계획입니다. 일본은 주택 물량을 포함시키기 위해 수급 조정 시장의 최저 입찰 규모를 폐지했습니다. 한편, 한국과 아세안에서는 2028년까지 동적 가격 책정 방식으로 발전할 가능성이 있는 정액 요금제 하에서 산업용 수요 반응(DR) 시범 사업이 진행되고 있습니다.
유럽에서는 ‘ 수요 반응에 관한 네트워크 코드’ 초안이 2027년까지 텔레메트리 표준화를 목표로 하고 있습니다. 그러나 보상 하한액에 차이가 있기 때문에 국경을 넘는 집계는 여전히 복잡한 상황입니다. 영국에서는 ‘애자일 요금’을 통해 2024-2025년 저녁 시간대의 피크 수요가 9% 감소했습니다. 독일은 주파수 유지용 최소 입찰 요건을 1MW에서 100kW로 낮추어, 집계된 축전지의 참여를 가능하게 했습니다. 북유럽 국가들에서는 95% 이상의 스마트 계량기 보급률을 활용하여, 히트펌프의 가동을 풍력 발전 예측과 연동시키고 있습니다. 반면, 남유럽과 동유럽에서는 첨단 계량 인프라(AMI)의 도입이 제한적이어서 어려움을 겪고 있으며, 세르비아와 몬테네그로의 도입률은 20% 미만인 것으로 보고되고 있습니다. 전쟁 중 전력망의 문제점에도 불구하고, 우크라이나는 6개 에너지 저장 통합 사업자에게 면허를 부여했습니다.
기타 혜택
- 엑셀 형식 시장 예측(ME) 시트
- 3개월간의 애널리스트 지원
자주 묻는 질문
목차
제1장 서론
제2장 조사 방법
제3장 주요 요약
제4장 시장 구도
제5장 시장 규모 및 성장 예측
제6장 경쟁 구도
제7장 시장 기회 및 향후 전망
AJYAccording to Mordor Intelligence, the automated demand response management system market size is projected to expand from USD 1.55 billion in 2025 and USD 1.74 billion in 2026 to USD 3.34 billion by 2031, registering a CAGR of 13.95% between 2026 to 2031.
This report is Segmented by Solution (Automated DR Management and Analytics Platforms, and More), Communication Technology (Wired, and More), Deployment Model (On-Premise, Cloud-Based), End-User Industry (Residential, and More), and Geography (North America, Europe, Asia-Pacific, South America, Middle East and Africa). The Market Forecasts are Provided in Terms of Value (USD).
Global Automated Demand Response Management System Market Trends and Insights
Proliferation of Dynamic Electricity Tariffs
Time-of-use and real-time pricing are exposing customers to wholesale volatility, rewarding automated curtailment during peak periods. Southern California Edison's 2024 Flexible Pricing Pilot cut enrolled household bills by 12% and proved that pre-cooling thermostats can be automated at scale . New Zealand's 2025 tariff reforms require every retailer to offer a dynamic option by 2027, pushing commercial portfolios to shift refrigeration and HVAC loads . The United Kingdom's Agile program saw a 9% drop in evening demand during 2024-2025 grid-service trials, validating the role of fast dispatch paired with transparent tariffs. Aggregators embed machine-learning price forecasts to anticipate spikes, which further increases customer savings and enrollment.
Nationwide Roll-out of Advanced Metering Infrastructure (AMI)
Smart-meter penetration in the United States reached 88% in 2024, up from 50% in 2019, giving utilities the interval data needed for five-minute price signals and load verification. Consolidated Edison's rollout across New York achieved 98% two-way communication, clearing the path for residential programs that rely on secure firmware updates. The EU smart-meter directive and China's State Grid mandate are driving similar upgrades, although rural cooperatives and municipal utilities lag due to capex constraints. High-resolution data lets AI models disaggregate appliance loads and fine-tune dispatch, which was impossible under monthly reads.
Cyber-security Vulnerabilities in Two-way DR Communications
NIST IR 8473 cataloged 37 attack scenarios that could hijack dispatch signals or exfiltrate usage data, prompting utilities to demand certificate-based authentication and device-level anomaly detection . The International Energy Agency reported a 25% increase in energy-sector cyber incidents in 2024, several of which targeted demand-response platforms. IEEE surveys found 62% of installations still lack full end-to-end encryption, pushing procurement cycles to include mandatory penetration testing and breach-insurance clauses.
Other drivers and restraints analyzed in the detailed report include:
- Integration of DERs and Micro-grids Requiring Real-Time Flexibility
- AI-enabled Predictive Load Analytics Improving DR Program ROI
- Fragmented Regulatory Mandates Across States and Regions
For complete list of drivers and restraints, kindly check the Table Of Contents.
Segment Analysis
In 2025, Automated DR Management & Analytics Platforms accounted for 41.4% of revenue as utilities integrated with existing SCADA. The Automated Demand Response Management System market size for Services is projected to expand at a 15.3% CAGR to 2031 as utilities shift ISO scheduling, enrollment, and settlement tasks to third-party specialists. Managed-service vendors pool device integration across thermostats, batteries, and EV chargers, lowering per-endpoint cost while assuming performance risk. Turnkey offerings like EnergyHub's post-acquisition portfolio now cover over 2.5 million DERs, a scale most utilities cannot match internally.
Services growth also reflects regulatory pressure to deliver equity outcomes; program administrators leverage aggregator call centers and digital portals to recruit disadvantaged communities quickly. Vertically integrated utilities still explore proprietary DERMS to avoid revenue leakage, but competitive retail suppliers prefer performance-based contracts tied to market clearing prices. As a result, platform vendors are bundling consulting, integration, and settlement into unified subscriptions.
Wireless mesh held 42.8% of 2025 deployments, yet cellular protocols are forecast to grow at 17.4% CAGR as utilities favor carrier networks that meet AMI security mandates. Automated Demand Response Management System market share for cellular is bolstered by SIM-based key provisioning that satisfies CPUC encryption rules without costly gateway rollouts. NB-IoT's sub-USD 5 modules and decade-long battery life bring residential per-endpoint costs below USD 2 monthly, critical for mass enrollment.
Studies in Sensors showed 94% packet delivery for LoRa hybrids but flagged integration gaps with billing back-ends, while PLC remains niche in Europe where PRIME standards persist. Latency constraints channel high-value frequency regulation to wired Ethernet or fiber, leaving 5-minute dispatch services to cellular endpoints. Utilities are therefore adopting tiered architectures that combine on-premise fast loops with cloud analytics delivered via LTE-M.
Geography Analysis
North America accounted for 47.1% of 2025 revenue and hosts the most sophisticated regulatory framework for aggregated DERs. California budgeted over USD 200 million for demand response between 2025 and 2027, targeting 1 GW of new flexible capacity while mandating that 60% of participants come from disadvantaged communities. ERCOT registered 3,200 MW of economic DR capacity in 2024, yet residential contributions remain below 10% due to backup-power concerns during multi-day heat waves. Canada's Ontario ISO opened its 2024 capacity auction to DR resources, and Mexico launched time-of-use pilots in Monterrey, signaling continental expansion beyond the United States.
Asia-Pacific is the fastest growing region, with a forecast CAGR of 16.7%. China's national virtual-power-plant program dispatched more than 1 MW during its first summer and has state backing to scale nationwide by 2030. India's Central Electricity Authority calls for 27 GW of battery storage and 20 GW of pumped hydro by 2030; AutoGrid's partnership with PTC India will use AI orchestration to aggregate flexible HVAC and EV loads. Japan dropped minimum bid sizes in balancing markets to include residential capacity, while South Korea and ASEAN economies are piloting industrial DR under flat tariffs that may evolve into dynamic pricing by 2028.
In Europe, the draft Network Code on Demand Response aims to standardize telemetry by 2027. However, variations in compensation floors continue to complicate cross-border aggregation. In the United Kingdom, the Agile tariff reduced evening peak demand by 9% during 2024-2025. Germany has lowered its minimum frequency-containment bid requirement from 1 MW to 100 kW, enabling the participation of aggregated batteries. Nordic countries utilize over 95% smart-meter penetration to synchronize heat-pump dispatch with wind energy forecasts. In contrast, Southern and Eastern Europe face challenges due to limited advanced metering infrastructure (AMI) deployment, with Serbia and Montenegro reporting rollout rates below 20%. Despite wartime grid challenges, Ukraine has licensed six storage aggregators.
- ABB Ltd
- AutoGrid Systems Inc.
- C3.ai Inc.
- Cisco Systems Inc.
- Eaton Corporation plc
- Enel X S.r.l.
- General Electric Company
- Hitachi Energy Ltd.
- Honeywell International Inc.
- Itron Inc.
- Johnson Controls International plc
- Landis+Gyr Group AG
- Mitsubishi Electric Corporation
- Oracle Corporation
- Schneider Electric SE
- Siemens AG
- Tata Power DDL
- Tendril (Uplight)
- Virtual Peaker Inc.
- Yokogawa Electric Corporation
Additional Benefits:
- The market estimate (ME) sheet in Excel format
- 3 months of analyst support
TABLE OF CONTENTS
1 Introduction
- 1.1 Study Assumptions & Market Definition
- 1.2 Scope of the Study
2 Research Methodology
3 Executive Summary
4 Market Landscape
- 4.1 Market Overview
- 4.2 Market Drivers
- 4.2.1 Proliferation of dynamic electricity tariffs
- 4.2.2 Nationwide roll-out of advanced metering infrastructure (AMI)
- 4.2.3 Integration of DERs & micro-grids requiring real-time flexibility
- 4.2.4 Utility push for peak-load shaving to avoid costly capacity additions
- 4.2.5 AI-enabled predictive load analytics improving DR program ROI
- 4.2.6 Growth of transactive energy pilots leveraging blockchain
- 4.3 Market Restraints
- 4.3.1 Cyber-security vulnerabilities in two-way DR communications
- 4.3.2 Fragmented regulatory mandates across states & regions
- 4.3.3 Customer fatigue & opt-out risk due to event over-notification
- 4.3.4 Scarcity of open, vendor-agnostic ADRMS standards
- 4.4 Supply-Chain Analysis
- 4.5 Regulatory Landscape
- 4.6 Technological Outlook
- 4.7 Porter's Five Forces
- 4.7.1 Bargaining Power of Suppliers
- 4.7.2 Bargaining Power of Consumers
- 4.7.3 Threat of New Entrants
- 4.7.4 Threat of Substitutes
- 4.7.5 Intensity of Competitive Rivalry
5 Market Size & Growth Forecasts
- 5.1 By Solution
- 5.1.1 Automated DR Management and Analytics Platforms
- 5.1.2 DR Control and Aggregation Software
- 5.1.3 Customer Enrollment and Engagement Portals
- 5.1.4 Services (Consulting, Integration, Managed DR)
- 5.2 By Communication Technology
- 5.2.1 Wired (PLC, Ethernet)
- 5.2.2 Wireless (Wi-Sun, ZigBee, RF Mesh)
- 5.2.3 Cellular (LTE-M, NB-IoT, 5G)
- 5.3 By Deployment Model
- 5.3.1 On-premise
- 5.3.2 Cloud-based
- 5.4 By End-user Industry
- 5.4.1 Residential
- 5.4.2 Commercial
- 5.4.3 Industrial
- 5.5 By Geography
- 5.5.1 North America
- 5.5.1.1 United States
- 5.5.1.2 Canada
- 5.5.1.3 Mexico
- 5.5.2 Europe
- 5.5.2.1 Germany
- 5.5.2.2 United Kingdom
- 5.5.2.3 France
- 5.5.2.4 Italy
- 5.5.2.5 NORDIC Countries
- 5.5.2.6 Russia
- 5.5.2.7 Rest of Europe
- 5.5.3 Asia-Pacific
- 5.5.3.1 China
- 5.5.3.2 India
- 5.5.3.3 Japan
- 5.5.3.4 South Korea
- 5.5.3.5 ASEAN Countries
- 5.5.3.6 Rest of Asia-Pacific
- 5.5.4 South America
- 5.5.4.1 Brazil
- 5.5.4.2 Argentina
- 5.5.4.3 Rest of South America
- 5.5.5 Middle East and Africa
- 5.5.5.1 Saudi Arabia
- 5.5.5.2 United Arab Emirates
- 5.5.5.3 South Africa
- 5.5.5.4 Egypt
- 5.5.5.5 Rest of Middle East and Africa
- 5.5.1 North America
6 Competitive Landscape
- 6.1 Market Concentration
- 6.2 Strategic Moves (M&A, Partnerships, PPAs)
- 6.3 Market Share Analysis (Market Rank/Share for key companies)
- 6.4 Company Profiles (includes Global level Overview, Market level overview, Core Segments, Financials as available, Strategic Information, Products & Services, and Recent Developments)
- 6.4.1 ABB Ltd
- 6.4.2 AutoGrid Systems Inc.
- 6.4.3 C3.ai Inc.
- 6.4.4 Cisco Systems Inc.
- 6.4.5 Eaton Corporation plc
- 6.4.6 Enel X S.r.l.
- 6.4.7 General Electric Company
- 6.4.8 Hitachi Energy Ltd.
- 6.4.9 Honeywell International Inc.
- 6.4.10 Itron Inc.
- 6.4.11 Johnson Controls International plc
- 6.4.12 Landis+Gyr Group AG
- 6.4.13 Mitsubishi Electric Corporation
- 6.4.14 Oracle Corporation
- 6.4.15 Schneider Electric SE
- 6.4.16 Siemens AG
- 6.4.17 Tata Power DDL
- 6.4.18 Tendril (Uplight)
- 6.4.19 Virtual Peaker Inc.
- 6.4.20 Yokogawa Electric Corporation
7 Market Opportunities & Future Outlook
- 7.1 White-space & Unmet-need Assessment
