
|
시장보고서
상품코드
2064408
아시아태평양의 수요 반응 관리 시스템 시장 : 시장 점유율 분석, 산업 동향 및 통계 데이터, 성장 예측(2026-2031년)Asia-Pacific Demand Response Management System - Market Share Analysis, Industry Trends & Statistics, Growth Forecasts (2026 - 2031) |
||||||
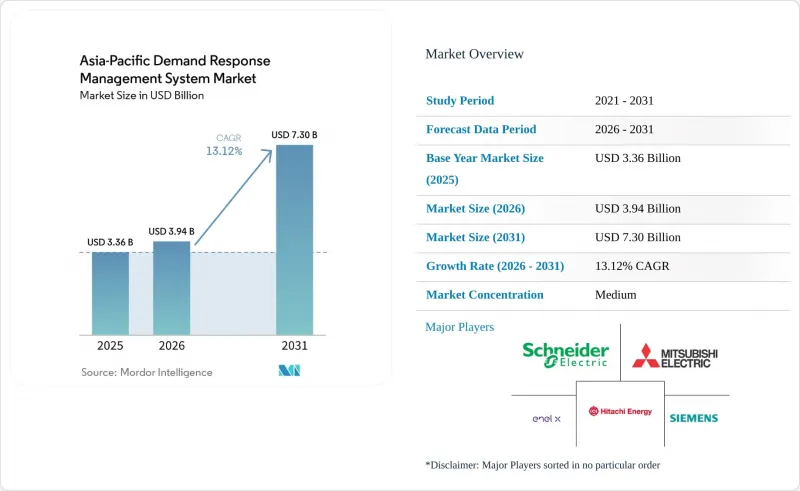
Mordor Intelligence에 의하면, 아시아태평양의 수요 반응 관리 시스템 시장 규모는 2025년에 33억 6,000만 달러로 평가되었고, 2026년 39억 4,000만 달러로 추정되고, 2031년까지 73억 달러에 이를 것으로 예측되며, 예측 기간(2026-2031년) CAGR은 13.12%를 나타낼 전망입니다.
본 보고서는 유형별(기존, 기타), 프로그램 유형별(요금 기반, 기타), 솔루션 구성 요소별(하드웨어, 기타), 배포 방식별(클라우드 호스팅형, 기타), 최종 사용자별(주거용, 기타), 지역별(호주 및 뉴질랜드, 중국, 인도, 일본, 한국, 아세안(ASEAN) 국가, 기타 아시아태평양 국가)으로 분류되어 있습니다. 시장 전망은 금액(달러) 기준으로 제시되어 있습니다.
아시아태평양의 수요 반응 관리 시스템 시장 동향 및 인사이트
지역 전체의 용량 시장의 급속한 확대
일본은 2024년에 용량 시장을 개시하여, 제1차 경매 주기에서 약 1GW 규모 수요 반응 계약을 체결했으며, 2024년 여름 피크 시간대에는 19차례의 출력 조정이 발생했습니다(Enel X). 호주의 도매 수요 반응(DR) 메커니즘은 2023년 69MW에서 2025년 6월까지 92MW로 확대되었으며, 50만 호주 달러 미만의 비용으로 532만 호주 달러의 순 시스템 이익을 창출했습니다. 한국은 2026년 봄에 반집중형 디스패치 규정을 도입하여 VPP 애그리게이터가 20MW 미만의 자산을 통합할 수 있도록 하는 한편, 2038년까지 16.3GW의 피크 부하 감축을 목표로 하고 있습니다. 이러한 프레임워크는 유연한 부하를 안정적인 수익원으로 전환함으로써, 애그리게이터가 텔레메트리 인프라와 기준선의 정확도를 높이는 머신러닝 분석에 자금을 투자할 수 있도록 합니다.
유연한 ‘계량기 뒤편’ 태양광 발전 및 에너지 저장 시스템의 급증
2025년에 전 세계적으로 도입된 14.8GWh 규모의 신규 가정용 배터리 중 아시아태평양이 58%를 차지했으며, 이는 2024년 대비 42% 증가한 수치입니다. 일본에서는 2025년 말까지 18만 대의 V2H(Vehicle-to-Home) 충전기가 도입되어, 전기차 소유자가 피크 시간대와 비피크 시간대의 요금 차이를 활용해 수익을 얻을 수 있게 되었습니다. 호주에서는 가정용 축전지의 누적 설치 대수가 50만 대를 돌파했으며, 중국에서는 국가발전개혁위원회(NDRC)가 시행한 성급 자가소비 보조금을 배경으로 2025년 가정용 축전 시장이 87% 성장했습니다. 축전지가 1대 늘어날 때마다 VPP(가상 발전소)의 운영 한계 비용이 낮아지고, 공급업체의 투자 회수 기간이 단축됨과 동시에, 수요 반응 관리 시스템 시장의 주택용 잠재 고객 기반이 확대되고 있습니다.
각국 규제 당국에 따른 요금 체계의 차이
아세안(ASEAN) 회원국에서는 시간대별 요금 적용 시간대, 피크 시간대 발동 조건, 용량 지급 방식이 국가마다 달라, 국경을 초월한 VPP 통합을 복잡하게 만들고 있습니다. 인도에서는 주마다 요금 체계가 제각각이기 때문에 중개업체는 상충되는 피크 시간대 정의에 대응할 수밖에 없어 규모의 경제성이 저해되고 있습니다. 중국의 성별 용량 시장에서는 지역별 출력 우선순위가 적용되기 때문에 고객 확보 비용이 높아지고, 소프트웨어 공급업체의 투자 회수 기간이 길어지고 있습니다.
부문별 분석
수요 반응 관리 시스템 시장에서 자동화 플랫폼은 2025년 매출의 63.8%를 차지했으며, 2031년까지 연평균 성장률(CAGR) 14.8%로 확대될 것으로 전망됩니다. 이러한 우위는 부가 서비스 이용을 가능하게 하는 1초 미만의 응답 시간에 기반을 두고 있습니다. 2025년 한국의 실시간 시장 확대에 따라 5분 단위의 입찰이 가능해졌는데, 이는 기존의 수동 방식으로는 불가능한 빈도입니다. 2024년 여름 일본의 전력 계통 운영에서 자동화 포트폴리오를 통해 7GWh가 기록되었으며, 전력 회사 차원의 신뢰성이 확인되었습니다. 축전지의 보급이 확대됨에 따라, 하루에 여러 차례 축전 설비를 사이클링하는 머신러닝 주도형 오케스트레이션으로 인해 기존 시스템과의 성능 격차가 확대될 것이며, 수요 반응 관리 시스템 시장 규모에 관한 논의에서 자동화의 주도적 지위가 확고해질 것입니다.
기존 프로그램은 여전히 신속한 원격 측정 기능이 필요하지 않은 기존 산업용 계약을 관리하고 있지만, 전력 회사들이 신규 입찰에 하드웨어 원격 측정 및 클라우드 API를 도입함에 따라 그 점유율은 해마다 감소하고 있습니다. 현재 신규 스마트 계량기 도입의 대부분에 첨단 통신 모듈이 포함되어 있기 때문에 자동화 로직을 추가하는 데 드는 추가 비용은 줄어들고 있습니다. 그 결과, 소규모 상업시설의 경우에도 옵트인 방식의 전화 알림에서 완전 자동화된 수요 억제 방식으로의 전환이 비용 대비 효과가 뛰어나다고 판단되고 있습니다.
가격 기반 요금 체계는 2025년 매출의 59.5%를 차지했지만, 인센티브 제도는 2031년까지 연평균 성장률(CAGR) 14.5%로 성장할 것으로 전망됩니다. 일본과 한국의 용량 경매, 필리핀의 예비력 시장, 호주의 긴급 수요 억제 계약은 용량, 에너지 및 부수적 수익을 창출하여 애그리게이터의 수익성을 높이고 있습니다. 산업용 고객은 변동이 심한 요금 절감보다 보장된 요금을 선호하는 경향이 있어, 조달 방식을 인센티브 모델로 전환함으로써 수요 반응 관리 시스템 내 가용성 지급 시장 점유율을 확대되고 있습니다.
주택용 부문은 전력 회사가 청구 시스템만 업그레이드하면 도입할 수 있기 때문에 여전히 시간대별 요금제에 의존하고 있습니다. 그러나 시간이 지남에 따라 이용자들의 행동적 피로감으로 인해 응답률이 떨어지고 있기 때문에 규제 당국은 참여도를 유지하기 위해 소액의 용량 보너스를 추가한 혼합 모델의 시범 운영을 추진하고 있습니다. 가정용 배터리 및 V2H(Vehicle-to-Home) 충전기의 도입이 확대됨에 따라, 예측 기간 후반에는 자동화된 인센티브 프로그램으로의 전환이 가속화될 것입니다.
기타 혜택 :
- Excel 형식 시장 예측(ME) 시트
- 3개월간의 애널리스트 지원
자주 묻는 질문
목차
제1장 서론
제2장 분석 방법
제3장 주요 요약
제4장 시장 구도
제5장 시장 규모 및 성장률 예측
제6장 경쟁 구도
제7장 시장 기회 및 향후 전망
AJYAccording to Mordor Intelligence, the asia-Pacific demand response management system market size was valued at USD 3.36 billion in 2025 and is estimated to grow from USD 3.94 billion in 2026 to reach USD 7.30 billion by 2031, at a CAGR of 13.12% during the forecast period (2026-2031).

This report is Segmented by Type (Conventional, Others), Program Type (Price-Based, Others), Solution Component (Hardware, Others), Deployment Mode (Cloud-Hosted, Others), End-Use (Residential, More), and Geography (Australia and New Zealand, China, India, Japan, South Korea, ASEAN Countries, Rest of Asia Pacific). The Market Forecasts are Provided in Terms of Value (USD).
Asia-Pacific Demand Response Management System Market Trends and Insights
Rapid Roll-Out of Region-Wide Capacity Markets
Japan activated its capacity market in 2024 and cleared roughly 1 GW of demand-response contracts in the first auction cycle, with 19 dispatch events during the 2024 summer peak Enel X. Australia's Wholesale Demand Response mechanism scaled from 69 MW in 2023 to 92 MW by June 2025, delivering net system benefits of AUD 5.32 million against costs below AUD 0.5 million. South Korea adopted semi-centralized dispatch rules in spring 2026, allowing VPP aggregators to pool sub-20 MW assets and targeting 16.3 GW of peak reduction by 2038. These frameworks convert flexible load into a bankable revenue stream, enabling aggregators to finance telemetry infrastructure and machine-learning analytics that sharpen baseline accuracy.
Surge in Flexible, Behind-the-Meter PV-Plus-Storage
Asia-Pacific absorbed 58% of the 14.8 GWh of new residential batteries installed worldwide in 2025, a 42% jump from 2024. Japan added 180,000 vehicle-to-home chargers by year-end 2025, empowering electric-vehicle owners to arbitrage peak and off-peak tariffs. Australia surpassed 500,000 cumulative home-battery installations, while China's household storage segment expanded 87% in 2025 on the back of provincial self-consumption subsidies NDRC. Each incremental battery lowers the marginal cost of VPP dispatch, shortening vendor payback periods and expanding the residential addressable base of the demand response management system market.
Disparate Tariff Structures Across National Regulators
ASEAN members operate divergent time-of-use windows, critical-peak triggers, and capacity-payment formulas that complicate cross-border VPP aggregation. India's state-level tariff patchwork forces aggregators to juggle conflicting peak definitions, reducing scale efficiencies. China's provincial capacity markets impose localized dispatch priorities, creating higher customer-acquisition costs and longer payback periods for software vendors.
Other drivers and restraints analyzed in the detailed report include:
- Smart-Meter Mandate Completions
- Green Data-Center Procurement of DR Capacity
- Low Residential Participation Due to Aggregator Caps
For complete list of drivers and restraints, kindly check the Table Of Contents.
Segment Analysis
Automated platforms owned 63.8% of 2025 revenue in the demand response management system market and are forecast to expand at 14.8% CAGR through 2031. Their dominance is anchored in sub-second response times that enable ancillary-services participation. South Korea's real-time market expansion in 2025 allows 5-minute bidding, a cadence impossible for conventional manual schemes. Japan's summer 2024 dispatch logged 7 GWh from automated portfolios, confirming reliability at utility scale. As battery penetration rises, machine-learning-driven orchestration that cycles storage multiple times per day will widen the performance gap over conventional systems, solidifying automation's leadership position in the demand response management system market size discussions.
Conventional programs still manage legacy industrial contracts that do not require rapid telemetry, yet their share declines annually as utilities embed hard telemetry and cloud APIs into new tenders. The incremental cost of adding automated logic is falling because most new smart-meter rollouts now include advanced communications modules. Consequently, even smaller commercial facilities find it cost-effective to migrate from opt-in phone notifications to fully automated curtailment.
Price-based tariffs still generated 59.5% of 2025 revenue; however, incentive schemes are projected to grow at 14.5% CAGR to 2031. Capacity auctions in Japan and South Korea, reserve markets in the Philippines, and emergency curtailment contracts in Australia stack capacity, energy, and ancillary revenues, improving aggregator economics. Industrial customers favor guaranteed fees over volatile bill savings, shifting procurement toward incentive models and expanding the demand response management system market share of availability payments.
Residential segments remain anchored to time-of-use tariffs because utilities can implement them with billing upgrades alone. Yet behavioral fatigue erodes response over time, prompting regulators to pilot blended models that add small capacity bonuses to retain engagement. Growing deployment of home batteries and vehicle-to-home chargers will accelerate the pivot toward automated incentive programs in the back half of the forecast period.
List of Companies Covered in this Report:
- Schneider Electric SE
- Siemens AG
- Hitachi Energy Ltd
- Mitsubishi Electric Corp.
- ABB Ltd.
- Enel X (Enel SpA)
- Eaton Corp. plc
- Itron Inc. (ex-Silver Spring Networks)
- AutoGrid Systems Inc.
- CPower Energy Management
- Tata Power Delhi Distribution
- KEPCO (Korea Electric Power Corp.)
- Landis+Gyr Group
- Digital Energy Corp. (Japan)
- Comverge (now ICF)
- EnerNOC (now Enel X)
- Regen Energy (now Encycle)
- Yokogawa Electric Corp.
- Nuvve Holding Corp.
- GridPoint Inc.
Additional Benefits:
- The market estimate (ME) sheet in Excel format
- 3 months of analyst support
TABLE OF CONTENTS
1 Introduction
- 1.1 Study Assumptions & Market Definition
- 1.2 Scope of the Study
2 Research Methodology
3 Executive Summary
4 Market Landscape
- 4.1 Market Overview
- 4.2 Market Drivers
- 4.2.1 Rapid roll-out of region-wide capacity markets
- 4.2.2 Surge in flexible, behind-the-meter PV-plus-storage
- 4.2.3 Smart-meter mandate completions (Japan 2025; India 2027)
- 4.2.4 Green data-centre procurement of DR capacity
- 4.2.5 Electrification of industrial boilers in China & S-Korea
- 4.3 Market Restraints
- 4.3.1 Disparate tariff structures across national regulators
- 4.3.2 Low residential participation due to aggregator caps
- 4.3.3 Cyber-security spending lag at distribution utilities
- 4.4 Supply-Chain Analysis
- 4.5 Regulatory Landscape
- 4.6 Technological Outlook
- 4.7 Porter's Five Forces
- 4.7.1 Bargaining Power of Suppliers
- 4.7.2 Bargaining Power of Consumers
- 4.7.3 Threat of New Entrants
- 4.7.4 Threat of Substitute Products & Services
- 4.7.5 Intensity of Competitive Rivalry
5 Market Size & Growth Forecasts
- 5.1 By Type
- 5.1.1 Conventional Demand Response
- 5.1.2 Automated/Advanced Demand Response
- 5.2 By Program Type
- 5.2.1 Price-based (TOU, CPP, RTP)
- 5.2.2 Incentive-based (CBP, DLC, Emergency DR, Ancillary)
- 5.3 By Solution Component
- 5.3.1 Hardware (AMI, Load-control switches, Gateways)
- 5.3.2 Software (DRMS, VPP platforms)
- 5.3.3 Services (Aggregation, Curtailment, Enrolment)
- 5.4 By Deployment Mode
- 5.4.1 Cloud-hosted
- 5.4.2 On-premise/Edge
- 5.5 By End-use
- 5.5.1 Residential
- 5.5.2 Commercial
- 5.5.3 Industrial
- 5.6 By Geography
- 5.6.1 Australia
- 5.6.2 China
- 5.6.3 India
- 5.6.4 Japan
- 5.6.5 South Korea
- 5.6.6 ASEAN Countries
- 5.6.7 Australia and New Zealand
- 5.6.8 Rest of Asia-Pacific
6 Competitive Landscape
- 6.1 Market Concentration
- 6.2 Strategic Moves (M&A, Partnerships, PPAs)
- 6.3 Market Share Analysis (Market Rank/Share for key companies)
- 6.4 Company Profiles (includes Global level Overview, Market level overview, Core Segments, Financials as available, Strategic Information, Products & Services, and Recent Developments)
- 6.4.1 Schneider Electric SE
- 6.4.2 Siemens AG
- 6.4.3 Hitachi Energy Ltd
- 6.4.4 Mitsubishi Electric Corp.
- 6.4.5 ABB Ltd.
- 6.4.6 Enel X (Enel SpA)
- 6.4.7 Eaton Corp. plc
- 6.4.8 Itron Inc. (ex-Silver Spring Networks)
- 6.4.9 AutoGrid Systems Inc.
- 6.4.10 CPower Energy Management
- 6.4.11 Tata Power Delhi Distribution
- 6.4.12 KEPCO (Korea Electric Power Corp.)
- 6.4.13 Landis+Gyr Group
- 6.4.14 Digital Energy Corp. (Japan)
- 6.4.15 Comverge (now ICF)
- 6.4.16 EnerNOC (now Enel X)
- 6.4.17 Regen Energy (now Encycle)
- 6.4.18 Yokogawa Electric Corp.
- 6.4.19 Nuvve Holding Corp.
- 6.4.20 GridPoint Inc.
7 Market Opportunities & Future Outlook
- 7.1 White-space & Unmet-need Assessment
