|
시장보고서
상품코드
2064411
미국의 셰일가스 시장 : 시장 점유율 분석, 산업 동향 및 통계 데이터, 성장 예측(2026-2031년)United States Shale Gas - Market Share Analysis, Industry Trends & Statistics, Growth Forecasts (2026 - 2031) |
||||||
 Mordor Intelligence
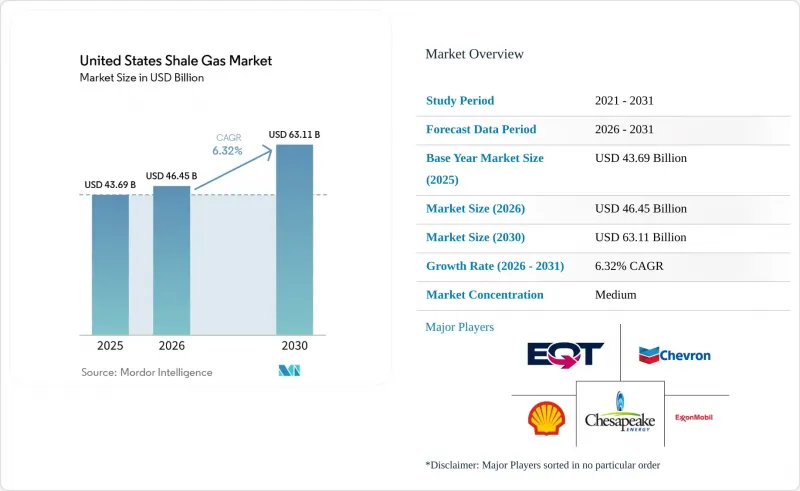
Mordor Intelligence에 의하면, 미국의 셰일가스 시장 규모는 2025년에 436억 9,000만 달러로 평가되었고, 2026년 464억 5,000만 달러로 추정되고, 2030년까지 631억 1,000만 달러에 이를 것으로 예상되며, 예측 기간(2026-2030년) CAGR은 6.32%를 나타낼 전망입니다.
본 보고서는 탄화수소 유형별(셰일가스, 셰일오일), 추출 기술별(수평 시추만, 수압 파쇄만, 수평 시추와 수압 파쇄의 병용), 용도별(발전, 산업·석유화학용 원료, 주거용·상업용 난방, 운송)로 분류되어 있습니다. 시장 전망은 금액(달러) 기준으로 제시되어 있습니다.
미국의 셰일가스 시장 동향 및 인사이트
2026년 이후 LNG 수출 능력의 꾸준한 확대
골든 패스 LNG는 2026년 초에 일일 2억 3천만 입방피트(Bcf/d) 규모로 가동을 시작하며, 셰니에르의 코퍼스 크리스티 3단계 확장 프로젝트는 2029년까지 일일 2억 7천만 입방피트(Bcf/d)를 추가로 공급할 예정입니다. 플라크민스와 칼카슈 패스를 합쳐, 이 프로젝트들은 하루 7-8억 입방피트의 증분 공급을 흡수하여 수급 균형을 조여주고, 헨리 허브의 가격을 2024년 1MMBtu당 2.21달러에서 2025년에는 3.52달러로 끌어올릴 것입니다. 연방에너지규제위원회(FERC)는 건설 전 일정을 최대 18개월 단축함으로써 최종 투자 결정 과정을 신속하게 진행할 수 있게 했습니다.
블루 수소 프로젝트에 따른 수요 증가
베이타운에서 셰브론이 추진하는 50억 달러 규모의 ‘프로젝트 래브라도’는 2027년에 저탄소 수소 생산 능력이 연간 120만 톤에 도달할 경우, 하루에 0.3 Bcf의 가스를 소비하게 될 것입니다. 에어 프로덕츠의 루이지애나 복합 시설 역시 비슷한 규모를 자랑합니다. '인플레이션 억제법'에 따른 45V 세액 공제(kg당 최대 3달러) 덕분에, 투자자들은 파이프라인을 통한 이산화탄소 저장이 가능한 가스 공급형 프로젝트로 유도되고 있습니다.
공유지에 대한 연방 임대 계약의 일시 중지
BLM(미국 토지관리국)의 지침서 IM-2025-028에 따라, 구획 심사 기간이 6개월로 단축되었으며, 분기별 매각이 재개되었습니다. 이로 인해 2021-2024년 80% 감소했던 리스 건수가 회복되었습니다. '원 빅 뷰티풀 빌(One Big Beautiful Bill) 법안'은 로열티 하한선을 12.5%로 고정하고, 뉴멕시코주와 와이오밍주의 매장량을 미국의 셰일가스 시장에 진출하는 기업들에게 개방했습니다.
부문별 분석
2025년, 셰일가스는 미국의 셰일가스 시장 점유율 78.8%를 유지했으나, 퍼미안 분지의 운영사들이 배럴당 40달러 미만의 손익분기점을 기록하는 액상 탄화수소가 풍부한 지대를 추구하는 가운데, 셰일오일은 2031년까지 연평균 성장률(CAGR) 6.8%로 확대될 전망입니다. 데본 에너지는 2026년 2월, 투자자들에게 '가능한 한 석유 생산에 주력하겠다'고 밝혔습니다. 이 방침에 따라 헤인즈빌에서 델라웨어 분지로 시추 장비가 재배치되었으며, 이에 따른 가스 생산량은 전년 대비 11% 증가한 하루 27.7억 입방피트에 달했습니다. 이러한 방침 전환으로 인해 2026년 초까지 해당 분지의 가스 대 원유 시추 비율은 1대 5로 축소되었으나, 액상 탄화수소 개발이 필연적으로 메탄 생산량을 끌어올렸기 때문에 총 가스 공급량은 감소하지 않았습니다. 애팔래치아 지역의 마르셀러스층과 유티카층은 여전히 거의 전적으로 건성 가스로 구성되어 있습니다. EQT사는 2025년 중반에 일일 6억 2천만 입방피트의 생산량을 달성하고, 연간 450만 톤 규모의 장기 LNG 계약을 체결했습니다. 이를 통해 생산량의 3분의 1에 대해 현물 가격 변동 위험을 헤지하고 있습니다.
액화탄화수소 가격의 급등은 퍼미안 분지 이외의 지역으로의 자본 유입에도 영향을 미치고 있습니다. 2024년 10월, 셰브론이 캐나다의 오일샌드 및 듀버네이 셰일 자산을 65억 달러에 매각함에 따라, 인프라가 잘 갖춰져 있고 규제 절차 기간이 짧은 미국의 퍼미안 분지에서의 시추를 위한 자금이 확보되었습니다. 반면, 헤인즈빌의 각 운영사들은 2025년에 헨리 허브의 가격이 3.52달러/MMBtu까지 회복된 후에야 비로소 더 깊고 비용이 많이 드는 지층의 시추에 착수했습니다. 이는 기업이 ‘규율 있는 성장’을 표방하고 있음에도 불구하고, 여전히 상품 가격이 활동의 방향성을 결정하고 있음을 증명하고 있습니다. 그렇다고는 해도, 액체 탄화수소가 풍부한 지역에서의 시추는 생산량 격차를 줄여줄 뿐, 해소해 주지는 않습니다. 건조 가스 생산 지역은 탐사 비용이 저렴하고 기존 파이프라인망이 잘 갖춰져 있어, 계속해서 미국의 셰일가스 시장 규모를 지탱하고 있습니다. 그 결과, 공급 구조는 양극화되어 있으며, 건조 가스 생산 지역은 가격 안정성을 제공하는 반면, 액체 탄화수소가 풍부한 지역은 원유 가격이 상승하는 국면에서 이익률 향상을 가져오고 있습니다.
기타 혜택 :
- Excel 형식 시장 예측(ME) 시트
- 3개월간의 애널리스트 지원
자주 묻는 질문
목차
제1장 서론
제2장 분석 방법
제3장 주요 요약
제4장 시장 구도
제5장 시장 규모 및 성장률 예측
제6장 경쟁 구도
제7장 시장 기회 및 향후 전망
AJY 26.06.26According to Mordor Intelligence, the united states shale gas market size was valued at USD 43.69 billion in 2025 and is estimated to grow from USD 46.45 billion in 2026 to reach USD 63.11 billion by 2030, at a CAGR of 6.32% during the forecast period (2026-2030).
This report is Segmented by Hydrocarbon Type (Shale Gas, Shale Oil), Extraction Technology (Horizontal Drilling Only, Hydraulic Fracturing Only, Combined Horizontal and Hydraulic Fracturing), and Application (Power Generation, Industrial and Petrochemical Feedstock, Residential and Commercial Heating, Transportation). The Market Forecasts are Provided in Terms of Value (USD).
United States Shale Gas Market Trends and Insights
Robust LNG Export Capacity Additions Post-2026
Golden Pass LNG began service in early 2026 with 2.3 Bcf/d, while Cheniere's Corpus Christi Stage 3 expansion adds 2.7 Bcf/d by 2029. Together with Plaquemines and Calcasieu Pass, these projects absorb 7-8 Bcf/d of incremental supply, tightening balances and lifting Henry Hub from USD 2.21/MMBtu in 2024 to USD 3.52/MMBtu in 2025. The Federal Energy Regulatory Commission trimmed pre-construction timelines by up to 18 months, enabling faster final-investment decisions.
Rising Demand from Blue-Hydrogen Projects
Chevron's USD 5 billion Project Labrador in Baytown will consume 0.3 Bcf/d of gas when it reaches 1.2 million t/yr of low-carbon hydrogen capacity in 2027. Air Products' Louisiana complex follows a comparable scale. The Inflation Reduction Act's 45V credit of up to USD 3/kg steers investors toward gas-fed projects where pipeline CO2 storage is available.
Federal Leasing Pauses on Public Lands
BLM's Instruction Memorandum IM-2025-028 shortened parcel reviews to six months and reinstated quarterly sales, reversing an 80% decline in lease volumes between 2021 and 2024. The One Big Beautiful Bill Act locked in a 12.5% royalty floor, unlocking inventory in New Mexico and Wyoming for United States shale gas market participants.
Other drivers and restraints analyzed in the detailed report include:
- Depletion-Driven Shift from Conventional to Shale
- Growth in Data-Center Power-Purchase Agreements
- Escalating EPA Waste Emissions Charge
For complete list of drivers and restraints, kindly check the Table Of Contents.
Segment Analysis
Shale gas retained a 78.8% United States shale gas market share in 2025, but shale oil is expanding at a 6.8% CAGR through 2031 as Permian operators chase liquids-rich zones where breakevens sit below USD 40 per barrel. Devon Energy told investors in February 2026 that it would "stay as oily as we can," a stance that redirected rigs from the Haynesville to the Delaware Basin even though associated gas output still climbed 11% year over year to 27.7 Bcf/d. This pivot compressed the basin's gas-to-oil drilling ratio to 1:5 by early 2026, yet it did not erode total gas supply because liquids development inevitably lifts methane volumes. Appalachia's Marcellus and Utica formations remain almost entirely dry gas; EQT produced 6.2 Bcf/d in mid-2025 and locked 4.5 MTPA into long-term LNG contracts that hedge one-third of its output against spot volatility.
The liquids premium also influences capital flows outside the Permian. Chevron's USD 6.5 billion divestiture of Canadian oil sands and Duvernay shale assets in October 2024 freed cash for U.S. Permian drilling where infrastructure is ready and regulatory timelines are short. In contrast, Haynesville operators drilled deeper, higher-cost intervals only after Henry Hub recovered to USD 3.52/MMBtu in 2025, proving commodity prices still steer activity despite corporate statements about "disciplined growth". Even so, liquids-rich drilling narrows but does not eliminate the volume gap; dry-gas provinces continue to anchor the United States shale gas market size because of their low finding costs and existing pipeline networks. The result is a bifurcated supply stack in which dry-gas basins provide price stability while liquids-heavy plays offer margin upside during oil rallies.
List of Companies Covered in this Report:
- Exxon Mobil Corporation
- EQT Corporation
- Chesapeake Energy Corp.
- Chevron Corporation
- Shell plc
- ConocoPhillips Company
- Coterra Energy Inc.
- Southwestern Energy Co.
- Pioneer Natural Resources Co.
- Devon Energy Corporation
- EOG Resources Inc.
- Range Resources Corp.
- Antero Resources Corp.
- Continental Resources Inc.
- Marathon Oil Corporation
- Cabot Oil & Gas (now Coterra)
- Murphy Oil Corporation
- TotalEnergies SE
- Baker Hughes Company
- Schlumberger NV
Additional Benefits:
- The market estimate (ME) sheet in Excel format
- 3 months of analyst support
TABLE OF CONTENTS
1 Introduction
- 1.1 Study Assumptions & Market Definition
- 1.2 Scope of the Study
2 Research Methodology
3 Executive Summary
4 Market Landscape
- 4.1 Market Overview
- 4.2 Market Drivers
- 4.2.1 Robust LNG export capacity additions post-2026
- 4.2.2 Rising demand from blue-hydrogen projects
- 4.2.3 Depletion-driven shift from conventional to shale resources
- 4.2.4 Methane-intensity certification premiums
- 4.2.5 Digital twin-enabled well optimization
- 4.2.6 CO2-based fracturing gaining regulatory support
- 4.3 Market Restraints
- 4.3.1 Federal leasing pauses on public lands
- 4.3.2 Growing ESG-led capital flight
- 4.3.3 Persistent sand & water logistics bottlenecks
- 4.3.4 Community opposition in Appalachia
- 4.4 Supply-Chain Analysis
- 4.5 Regulatory Landscape
- 4.6 Technological Outlook
- 4.7 Porter's Five Forces
- 4.7.1 Threat of New Entrants
- 4.7.2 Bargaining Power of Suppliers
- 4.7.3 Bargaining Power of Buyers
- 4.7.4 Threat of Substitutes
- 4.7.5 Industry Rivalry
- 4.8 PESTLE Analysis
5 Market Size & Growth Forecasts
- 5.1 By Hydrocarbon Type
- 5.1.1 Shale Gas
- 5.1.2 Shale Oil
- 5.2 By Extraction Technology
- 5.2.1 Horizontal Drilling Only
- 5.2.2 Hydraulic Fracturing Only
- 5.2.3 Combined Horizontal and Hydraulic Fracturing
- 5.3 By Application
- 5.3.1 Power Generation
- 5.3.2 Industrial and Petrochemical Feedstock
- 5.3.3 Residential and Commercial Heating
- 5.3.4 Transportation (LNG and CNG)
6 Competitive Landscape
- 6.1 Market Concentration
- 6.2 Strategic Moves (M&A, Partnerships, PPAs)
- 6.3 Market Share Analysis (Market Rank/Share for key companies)
- 6.4 Company Profiles (includes Global level Overview, Market level overview, Core Segments, Financials as available, Strategic Information, Products & Services, and Recent Developments)
- 6.4.1 Exxon Mobil Corporation
- 6.4.2 EQT Corporation
- 6.4.3 Chesapeake Energy Corp.
- 6.4.4 Chevron Corporation
- 6.4.5 Shell plc
- 6.4.6 ConocoPhillips Company
- 6.4.7 Coterra Energy Inc.
- 6.4.8 Southwestern Energy Co.
- 6.4.9 Pioneer Natural Resources Co.
- 6.4.10 Devon Energy Corporation
- 6.4.11 EOG Resources Inc.
- 6.4.12 Range Resources Corp.
- 6.4.13 Antero Resources Corp.
- 6.4.14 Continental Resources Inc.
- 6.4.15 Marathon Oil Corporation
- 6.4.16 Cabot Oil & Gas (now Coterra)
- 6.4.17 Murphy Oil Corporation
- 6.4.18 TotalEnergies SE
- 6.4.19 Baker Hughes Company
- 6.4.20 Schlumberger NV
7 Market Opportunities & Future Outlook
- 7.1 White-space & Unmet-Need Assessment