
|
시장보고서
상품코드
2064442
머신러닝 운영(MLOps) : 시장 점유율 분석, 업계 동향 및 통계, 성장 예측(2026-2031년)Machine Learning Operations (MLOps) - Market Share Analysis, Industry Trends & Statistics, Growth Forecasts (2026 - 2031) |
||||||
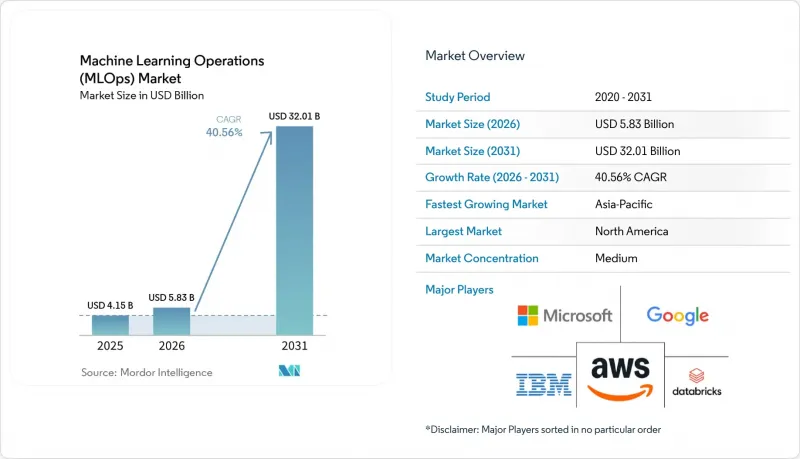
Mordor Intelligence에 의하면, 머신러닝 운영(MLOps) 시장 규모는 2025년 41억 5,000만 달러로 평가되었습니다. 2026년 58억 3,000만 달러에서 2031년까지 320억 1,000만 달러로 확대되어 2026년부터 2031년까지 연평균 복합 성장률(CAGR)은 40.56%를 나타낼 것으로 예측됩니다.

본 보고서는 구성 요소(플랫폼 및 서비스), 도입 형태(클라우드, On-Premise, 하이브리드), 조직 규모(대기업 및 중소기업), 최종 사용자 산업(은행, 금융서비스 및 보험(BFSI), 헬스케어 및 생명과학, IT 및 통신, 소매 및 전자상거래, 정부·공공 부문 등) 및 지역별로 분류되어 있습니다. 시장 전망은 금액(달러) 기준으로 제시되어 있습니다.
세계의 머신러닝 운영(MLOps) 시장 동향 및 인사이트
파일럿 단계에서 운영 환경으로의 AI 확장
머신러닝 운영(MLOps) 시장은 기업들이 직면한 근본적인 과제에 의해 주도되고 있습니다. 많은 조직이 모델을 구축할 수는 있지만, 재현 가능한 관리 체제 하에서 이를 안정적인 운영 환경으로 전환할 수 있는 조직은 훨씬 적습니다. 부서 간 모델 수가 증가하면, 수동으로 진행하는 환경으로의 이전, 버전 관리, 롤백, 재훈련이 곧바로 운영상의 병목 현상이 되어 가치 창출을 지연시키고 릴리스 위험을 높입니다. 이러한 압박으로 인해 구매자들은 개별 포인트 도구나 사용자 정의 스크립트에 의존하기보다는 개발, 검증, 배포, 모니터링에 걸친 업무 인계를 표준화하는 플랫폼으로 눈을 돌리고 있습니다. Amazon SageMaker AI는 2025년 12월에 서버리스 MLflow를 추가했는데, 이는 공급업체가 설정 작업을 줄이고 실험부터 관리형 배포에 이르는 과정을 단축하고자 함을 보여줍니다. 또한, Microsoft Fabric은 2026년 4월에 MLflow용 크로스 워크스페이스 로깅 기능을 도입했습니다. 이를 통해 워크플로우의 연속성을 해치지 않으면서 개발, 테스트, 운영 환경 간의 명확한 분리를 지원합니다. 그 결과, MLOps 시장은 새로운 AI 기능에 대한 수요뿐만 아니라, 운영 규율에 대한 기업 수요로부터도 혜택을 보고 있습니다.
모델 모니터링 및 드리프트 관리에 대한 수요 증가
MLOps 시장이 확대되고 있는 또 다른 이유는 프로덕션 환경의 모델은 배포 후 지속적인 모니터링 없이는 신뢰성을 유지할 수 없기 때문입니다. 성능 저하, 데이터 패턴의 변화, 지연 시간의 변동, 정책 실패 등은 서서히 나타날 가능성이 있으며, 이러한 문제들은 기존의 예측 워크로드보다 고객을 대상으로 하는 생성형 AI 시스템에서 감지하기가 더 어렵습니다. Databricks는 2025년 6월, MLflow 3.0을 통해 이러한 변화에 대응하고, 생성형 AI 워크플로우 전반에 걸친 평가 및 가시성을 지원하기 위해 프로덕션급 추적, 프롬프트 추적, LLM 평가 기능을 추가했습니다. Amazon SageMaker AI는 2026년 5월, MLflow 3.10을 통합하여 멀티턴 워크플로우용 추적 기능 외에도 지연 시간, 토큰 사용량, 품질에 대한 내장 평가 및 대시보드 기능을 탑재했습니다. 이는 출시 후 운영 가시성에 대한 수요가 높아지고 있음을 반영한 것입니다. 또한, Arize AI는 2026년 3월에 NVIDIA NIM에 대한 네이티브 지원을 추가하여, 팀이 동일한 관측 가능성 레이어 내에서 해당 런타임을 통해 배포된 모델을 모니터링하고 평가할 수 있도록 했습니다. 이러한 변화로 인해, 특히 자율형 시스템으로 인해 의사결정 체인이 길어지고 장애 발생 지점이 늘어나는 가운데, 모니터링은 머신러닝 운영(MLOps) 시장에서 주요 구매 기준으로 자리 잡고 있습니다.
부서 간 MLOps 인력 부족
머신러닝 운영(MLOps) 시장은 여전히 도입 과정에서 실질적인 제약에 직면해 있습니다. 왜냐하면, 실제 환경에서 AI를 운영하기 위해서는 데이터 엔지니어링, 소프트웨어 배포, 거버넌스, 모델 운영 역량을 모두 갖춘 인력이 필요하지만, 이러한 복합적인 역량을 갖춘 인력은 많은 조직에서 부족한 실정이기 때문입니다. 많은 기업이 AI 도구에 대한 투자는 가능하지만, 릴리스 파이프라인 유지 관리, 가동 중인 시스템 모니터링, 롤백 프로세스 관리, 규제 대상 이용 사례에 대한 통제 절차 문서화 등을 수행할 팀 인력을 확보하는 데 여전히 어려움을 겪고 있습니다. 이러한 인력 부족 현상은 조직이 소수의 고립된 모델에서 사업 부문을 아우르는 표준화된 릴리스 관행과 공유된 거버넌스 프로세스가 필요한 광범위한 포트폴리오로 전환할 때 특히 두드러집니다. 플랫폼 공급업체들은 실험 추적, 배포 템플릿, 관리형 워크플로 도구를 통해 더 많은 자동화 기능을 도입함으로써 이에 대응하고 있으며, 이를 통해 기본적인 운영에 필요한 전문가의 업무 부담을 줄이고 있습니다. Microsoft Fabric의 MLflow를 통한 서로 다른 워크스페이스 간 로깅 기능 역시, 대규모 전담 플랫폼 엔지니어링 그룹을 보유하지 않은 팀에서 발생하는 조정상의 마찰을 줄이려는 이러한 움직임을 반영하고 있습니다. 그렇긴 하지만, 구매자가 툴에 대한 접근성과 운영 노하우 간의 격차를 해소하지 못한다면, 머신러닝 운영(MLOps) 시장은 강력한 소프트웨어 수요를 실제 운영 환경에서의 도입으로 완전히 이어가지 못할 것입니다.
부문별 분석
이는 2025년에 플랫폼이 매출의 64.23%를 차지했으며, 플랫폼 부문이 머신러닝 운영(MLOps) 시장 전체에서 주요 지출 분야로 자리매김했음을 의미합니다. 2025년, 플랫폼이 머신러닝 운영(MLOps) 시장의 64% 점유율을 차지한 것은 기업들이 실험 추적, 모델 레지스트리, 배포, 모니터링, 거버넌스를 통합적으로 관리할 수 있는 제어 평면을 점점 더 선호하게 되었기 때문입니다. 이러한 경향은 특히 팀이 모델 릴리스나 정책 결정에 있어 명확한 계보를 필요로 하는 경우, 개별 라이프사이클 도구를 조합하는 방식에서 벗어나려는 구매자들의 더 광범위한 변화를 반영하고 있습니다. Databricks는 2025년 6월, MLflow 3.0을 기존의 머신러닝 및 생성형 AI 워크플로우로 확장하고, 단일 플랫폼에서 추적, 평가, 배포 제어 기능을 제공함으로써 이 모델을 강화했습니다. 또한, Amazon SageMaker AI도 2025년 12월에 서버리스 MLflow를 추가했는데, 이는 주요 벤더들이 제어 계층의 간소화를 보다 광범위한 프로덕션 환경에서의 도입을 위한 지름길로 보고 있음을 시사합니다.
서비스 시장은 2031년까지 연평균 성장률(CAGR) 41.34%로 확대될 것으로 예상되며, 플랫폼 주도형 수익 구조에서도 서비스 부문의 중요성은 여전히 높습니다. 머신러닝 운영(MLOps) 시장은 인적 지원에서 벗어나는 방향으로 나아가고 있지 않습니다. 많은 조직에서는 아키텍처 설계, 워크플로우 전환, 거버넌스 구축, 그리고 운영 모델 변경에 있어 여전히 외부 지원이 필요하기 때문입니다. 이는 특히 AI 프로그램이 LLMOps나 AgentOps로 전환될 때 두드러집니다. 이러한 분야에서는 배포 패턴이 표준화되어 있지 않아, 릴리스 설계상의 미비점으로 인해 발생하는 비용이 높아지기 때문입니다. 2026년 4월 Microsoft Fabric의 크로스 워크스페이스 로깅 업데이트는 플랫폼 기능이 복잡성을 줄일 수 있음을 보여주지만, 동시에 팀 간에 프로세스, 권한 및 프로덕션 환경에 대한 제어를 일관되게 유지하기 위해 기업들이 여전히 구현 지원이 필요하다는 점도 부각시키고 있습니다. 실제로 MLOps 시장은 도입 기간을 단축하고 사내 운영 부담을 줄이기 위해 소프트웨어 및 서비스를 세트로 구매하는 하이브리드형 제공 모델로 전환되고 있습니다.
2025년 머신러닝 운영(MLOps) 시장 규모에서 클라우드는 53.44%의 점유율을 차지했으며, 2031년까지 연평균 성장률(CAGR) 40.87%를 기록하며 가장 빠르게 성장하고 있는 도입 형태이기도 합니다. 클라우드가 주도적인 위치를 차지하고 있다는 사실은 관리형 인프라의 규모의 경제, 환경 구축의 신속화, 그리고 컴퓨팅, 오케스트레이션, 모니터링, 거버넌스 서비스 간의 긴밀한 통합을 반영하고 있습니다. 아마존 웹 서비스(AWS)는 2025년 6월, GPU 훈련 및 추론 비용을 절감하는 방법을 제시함으로써 이러한 방향성을 지속적으로 강화해 나갔습니다. 이는 클라우드 기반 AI 운영 환경의 경제성을 직접적으로 뒷받침하는 요소입니다. Google Cloud는 2026년 5월, Managed Airflow의 오케스트레이션 기능을 개선했습니다. 이를 통해 팀은 맞춤형 엔지니어링에 드는 부담을 줄이면서도 데이터 및 AI 워크로드를 실행할 수 있게 됩니다. 이러한 동향은 머신러닝 운영(MLOps) 시장에서 신규 도입 활동의 상당 부분이 여전히 클라우드 환경에 집중되고 있는 이유를 보여줍니다.
On-Premise 배포가 여전히 중요하게 여겨지는 이유는 규제나 보안에 민감한 환경에서 데이터 상주 요건, 주권 AI 요건, 그리고 내부 통제의 필요성이 여전히 크기 때문입니다. 따라서 하이브리드 아키텍처의 중요성이 커지고 있습니다. 이는 클라우드 성장세가 둔화되고 있기 때문이 아니라, 현재 많은 기업이 클라우드, 사설 인프라, 에지 노드를 아우르는 단일 운영 모델을 필요로 하고 있기 때문입니다. 아마존 웹 서비스(AWS)는 2026년 5월, IAM 가드레일과 CloudTrail 로깅 기능을 갖춘 ‘AWS MCP Server and Agent Toolkit’을 정식 출시하며 이러한 광범위한 변화를 반영했습니다. 이는 서비스 간 안전한 통합이 도입 논의에서 필수적인 요소임을 강조하는 것입니다. 또한, Teradata도 2026년 5월, 클라우드, On-Premise, 하이브리드 환경을 위한 ‘Autonomous Knowledge Platform’을 출시했습니다. 이는 서로 다른 실행 환경 간에 도입의 일관성에 대한 수요가 지속되고 있음을 보여줍니다. 따라서 MLOps 시장은 예측 기간 동안 매출 측면에서는 계속해서 클라우드가 주도할 것으로 예상되는 반면, 운영 설계 측면에서는 하이브리드화가 더욱 진전될 것으로 전망됩니다.
지역별 분석
2025년, 북미는 머신러닝 운영(MLOps) 시장 점유율의 34.22%를 차지하며, 해당 시장에서 가장 큰 기여를 하는 지역으로서의 위상을 유지했습니다. 이 지역은 고밀도 클라우드 인프라, 대기업의 AI 예산 규모, 탄탄한 벤더 기반, 그리고 경험이 풍부한 플랫폼 및 데이터 엔지니어링 인력의 집중이라는 이점을 누리고 있습니다. 아마존은 2025년 11월, 미국 정부 기관을 위한 AI 및 슈퍼컴퓨팅 인프라를 확충하기 위해 최대 500억 달러를 투자하겠다고 발표했습니다. 이는 연방 정부 및 국방 관련 분야에서 운영 환경을 위한 MLOps에 대한 장기적인 수요를 뒷받침하는 것입니다. 캐나다 역시 2025년부터 2026년에 걸쳐 기업 도입 및 공공 부문에서의 적용을 지원하는 새로운 AI 및 클라우드 인프라 이니셔티브를 통해 그 역할을 강화하고 있습니다. 미국은 하이퍼스케일러의 강점, 소프트웨어 벤더의 집중도, 그리고 다른 많은 시장보다 빠른 기업 도입 패턴을 모두 갖추고 있어, 이 지역의 주요 성장 동력으로 계속 자리매김하고 있습니다.
아시아태평양은 2031년까지 연평균 성장률(CAGR)이 41.63%로 가장 빠르게 성장하고 있는 지역 부문이며, 이에 따라 머신러닝 운영(MLOps) 시장의 장기적인 성장 경로에서 계속해서 중심적인 위치를 차지하고 있습니다. 해당 지역 전체의 성장은 기업 내 AI 도입 기반의 확대, 정책적 관심 증가, 그리고 신속하게 구축할 수 있는 클라우드 네이티브 플랫폼에 대한 수요 증가에 힘입어 이루어지고 있습니다. 일본은 기업의 API 도입 측면에서 두드러진 성과를 보이고 있으며, OpenAI의 보고서에 따르면 미국을 제외한 국가 중 가장 많은 기업 API 고객 수를 자랑하고 있습니다. 이는 하류 운영 도구에 대한 수요가 견조함을 시사합니다. 중국은 기업 차원의 대규모 AI 도입과 주권형 및 On-Premise형 운영 모델에 대한 관심이 높아짐에 따라 거대한 시장 규모를 형성하고 있습니다. 또한, 싱가포르 역시 이 지역의 도입 양상에 영향을 미치고 있습니다. 금융, 의료, 첨단 제조업 분야에서 거버넌스 중심의 AI 프로그램이 동남아시아 전역에서 감사 가능성과 라이프사이클 관리에 대한 기대를 높이고 있기 때문입니다.
유럽은 여전히 3위 지역 블록이며, 머신러닝 운영(MLOps) 시장의 지역별 지출 중 상당 부분을 독일, 영국, 프랑스가 차지하고 있습니다. 규제가 엄격한 분야의 구매자들이 실제 AI 시스템에서 기술 문서, 이벤트 로그, 인적 모니터링을 더욱 중요하게 여기고 있기 때문에 규제 압력은 이 지역에서 주요 요인으로 작용하고 있습니다. 독일의 appliedAI 이니셔티브는 DAX 지수 구성 기업 40곳 중 23곳과 협력하고 있으며, AI 거버넌스를 운영 모델의 일부로 자리매김하고 있습니다. 이는 컴플라이언스가 MLOps의 실무에 직접 통합되어 있는 현 상황을 반영하고 있습니다. 남미, 중동 및 아프리카의 총 시장 규모는 여전히 작지만, 각국의 AI 관련 우선순위, 공공 부문 프로그램, 금융 서비스의 디지털화는 국내 전개, 하이브리드 전개 또는 엄격하게 관리되는 전개 아키텍처를 지원할 수 있는 벤더들에게 여전히 목표가 명확한 비즈니스 기회를 창출하고 있습니다.
기타 혜택 :
- 엑셀 형식 시장 예측(ME) 시트
- 3개월간의 애널리스트 지원
자주 묻는 질문
목차
제1장 서론
제2장 조사 방법
제3장 주요 요약
제4장 시장 구도
제5장 시장 규모 및 성장 예측
제6장 경쟁 구도
제7장 시장 기회 및 향후 전망
KTHAccording to Mordor Intelligence, the machine learning operations (MLOps) market size is projected to expand from USD 4.15 billion in 2025 and USD 5.83 billion in 2026 to USD 32.01 billion by 2031, registering a CAGR of 40.56% between 2026 to 2031.
This report is Segmented by Component (Platform, and Services), Deployment Mode (Cloud, On-Premise, and Hybrid), Organization Size (Large Enterprises, and Small and Medium-Sized Enterprises), End-User Industry (BFSI, Healthcare and Life Sciences, IT and Telecom, Retail and E-Commerce, Government and Public Sector, and More), and Geography. The Market Forecasts are Provided in Terms of Value (USD).
Global Machine Learning Operations (MLOps) Market Trends and Insights
Scaling AI from Pilot to Production
The machine learning operations (MLOps) market is being lifted by a basic enterprise problem, many organizations can build models, but far fewer can move them into stable production with repeatable controls. Once model counts rise across departments, manual promotion, version tracking, rollback, and retraining quickly become operational bottlenecks that slow value capture and increase release risk. This pressure is pushing buyers toward platforms that standardize handoffs across development, validation, deployment, and monitoring, rather than relying on separate point tools and custom scripts. Amazon SageMaker AI added serverless MLflow in December 2025, which shows how vendors are trying to reduce setup work and shorten the path from experimentation to managed deployment. Microsoft Fabric also introduced cross-workspace logging for MLflow in April 2026, which supports cleaner separation across development, test, and production environments without breaking workflow continuity. As a result, the MLOps market is gaining from enterprise demand for operating discipline as much as it is gaining from demand for new AI features.
Rising Need for Model Monitoring and Drift Management
The MLOps market is also expanding because production models do not stay reliable without continuous oversight after deployment. Performance decay, changing data patterns, latency shifts, and policy failures can emerge gradually, and these issues are harder to detect in customer-facing generative systems than in traditional prediction workloads. Databricks addressed this shift in June 2025 with MLflow 3.0, which added production-scale tracing, prompt tracking, and LLM judges to support evaluation and observability across generative AI workflows. Amazon SageMaker AI integrated MLflow 3.10 in May 2026 with tracing for multi-turn workflows and built-in evaluation and dashboarding for latency, token use, and quality, which reflects growing demand for operational visibility after release. Arize AI also added native support for NVIDIA NIM in March 2026 so teams could monitor and evaluate models deployed through that runtime inside the same observability layer. These shifts are making monitoring a central buying criterion in the machine learning operations (MLOps) market, especially as agentic systems introduce longer decision chains and more failure points.
Shortage of Cross-Functional MLOps Talent
The machine learning operations (MLOps) market still faces a real adoption constraint because production AI requires combined skills in data engineering, software delivery, governance, and model operations, and that blend is scarce in most organizations. Many enterprises can fund AI tools, but they still struggle to staff teams that can maintain release pipelines, monitor live systems, manage rollback processes, and document controls for regulated use cases. This shortage is especially visible when organizations move from a few isolated models to broader portfolios that demand standardized release practices and shared governance processes across business units. Platform vendors are responding by building more automation into experiment tracking, deployment templates, and managed workflow tooling, which reduces the amount of specialist labor required for basic operations. Microsoft Fabric's MLflow logging across separate workspaces also reflects this push toward reducing coordination friction for teams that do not have large dedicated platform engineering groups. Even so, the machine learning operations (MLOps) market cannot fully convert strong software demand into production adoption unless buyers can close the gap between tooling access and operational expertise.
Other drivers and restraints analyzed in the detailed report include:
- Expansion of Cloud-Native AI Infrastructure
- LLMOps and AgentOps Convergence Raising Lifecycle Complexity
- Fragmented Toolchains And Integration Debt
For complete list of drivers and restraints, kindly check the Table Of Contents.
Segment Analysis
Platforms held 64.23% of revenue in 2025, which means the platform layer remained the core spending center across the machine learning operations (MLOps) market. Platforms held 64% of the machine learning operations (MLOps) market share in 2025 because enterprises increasingly preferred one control plane for experiment tracking, model registry, deployment, monitoring, and governance. That preference reflects a broader buyer shift away from stitching together separate lifecycle tools, especially when teams need clear lineage across model releases and policy decisions. Databricks strengthened this model in June 2025 by extending MLflow 3.0 across traditional machine learning and generative AI workflows with tracing, evaluation, and deployment controls on one platform. Amazon SageMaker AI also added serverless MLflow in December 2025, which shows that large vendors see control plane simplification as a direct route to wider production adoption.
Services are forecast to expand at a 41.34% CAGR through 2031, which keeps the service layer highly relevant even in a platform-led revenue structure. The machine learning operations (MLOps) market is not shifting away from human support, because many organizations still need outside help for architecture design, workflow migration, governance setup, and operating model changes. This is especially true when AI programs move into LLMOps and AgentOps, where deployment patterns are less standardized and the cost of poor release design is higher. Microsoft Fabric's cross-workspace logging update in April 2026 illustrates how platform features can reduce complexity, but it also highlights how enterprises still need implementation support to align process, permissions, and production controls across teams. In practice, the MLOps market is moving toward blended delivery models where software and services are purchased together to shorten deployment time and reduce internal operating strain.
Cloud accounted for 53.44% share of the machine learning operations (MLOps) market size in 2025, and it is also the fastest-growing deployment mode with a 40.87% CAGR through 2031. The cloud lead reflects the scale advantages of managed infrastructure, faster environment setup, and tighter integration between compute, orchestration, monitoring, and governance services. Amazon Web Services continued to reinforce this direction in June 2025 by outlining ways to lower GPU training and inference costs, which directly supports cloud-based production AI economics. Google Cloud added orchestration improvements to Managed Asia-Pacifiche Airflow in May 2026, which helps teams run data and AI workloads with less custom engineering overhead. These developments show why the machine learning operations (MLOps) market continues to concentrate a large share of new deployment activity in cloud environments.
On-premises deployment still matters because data residency, sovereign AI requirements, and internal control needs remain strong in regulated and security-sensitive settings. Hybrid architectures are therefore gaining weight, not because cloud growth is slowing, but because many enterprises now need one operating model across cloud, private infrastructure, and edge nodes. Amazon Web Services reflected this broader shift in May 2026 when it made the AWS MCP Server and Agent Toolkit generally available with IAM guardrails and CloudTrail logging, underscoring how secure integration across services has become part of the deployment conversation. Teradata also launched its Autonomous Knowledge Platform in May 2026 for cloud, on-premises, and hybrid environments, which points to sustained demand for deployment consistency across different runtime locations. The MLOps market is therefore likely to remain cloud-led on revenue while becoming more hybrid in operating design over the forecast period.
Geography Analysis
North America held 34.22% of the machine learning operations (MLOps) market share in 2025, which kept it as the largest regional contributor to the machine learning operations (MLOps) market. The region benefits from dense cloud infrastructure, large enterprise AI budgets, a deep vendor base, and a strong concentration of experienced platform and data engineering talent. Amazon said in November 2025 that it would invest up to USD 50 billion to expand AI and supercomputing infrastructure for U.S. government agencies, which supports long-run demand for production-grade MLOps in federal and defense-related environments. Canada is also strengthening its role through new AI and cloud infrastructure commitments that support enterprise adoption and public sector implementation over 2025 and 2026. The United States remains the main regional growth engine because it combines hyperscaler strength, software vendor density, and earlier enterprise adoption patterns than most other markets.
Asia-Pacific is the fastest-growing regional segment at a 41.63% CAGR through 2031, and this keeps it central to the longer-term expansion path of the machine learning operations (MLOps) market. Growth across the region is supported by a rising base of enterprise AI adoption, stronger policy attention, and more demand for cloud-native platforms that can be deployed quickly. Japan stands out for corporate API adoption, with OpenAI reporting the largest number of corporate API customers outside the United States, which suggests strong demand conditions for downstream operational tooling. China contributes significant volume through large-scale enterprise AI deployment and stronger interest in sovereign and on-premises operating models. Singapore is also influencing regional adoption patterns because governance-led AI programs in finance, healthcare, and advanced manufacturing are raising expectations around auditability and lifecycle control across Southeast Asia.
Europe remained the third-largest regional block, with Germany, the United Kingdom, and France accounting for much of regional spending in the machine learning operations (MLOps) market. Regulatory pressure is a major regional factor, because buyers in regulated sectors are placing greater emphasis on technical documentation, event logging, and human oversight in production AI systems. The appliedAI Initiative in Germany works with 23 of the 40 DAX corporations and treats AI governance as part of the operating model itself, which reflects how compliance is being built directly into MLOps practice. South America, the Middle East, and Africa remain smaller in aggregate, but sovereign AI priorities, public sector programs, and financial services digitization still create targeted opportunities for vendors that can support in-country, hybrid, or tightly governed deployment architectures.
- Amazon Web Services, Inc.
- Microsoft Corporation
- Google LLC
- IBM Corporation
- Databricks, Inc.
- DataRobot, Inc.
- Domino Data Lab, Inc.
- Dataiku SAS
- H2O.ai, Inc.
- Cloudera, Inc.
- Hewlett Packard Enterprise Company
- SAS Institute Inc.
- Snowflake Inc.
- Teradata Corporation
- Seldon Technologies Ltd.
- ClearML Inc.
- Weights & Biases, Inc.
- Neptune Labs Sp. z o.o.
- Fiddler AI, Inc.
- ModelOp, Inc.
- Arize AI, Inc.
Additional Benefits:
- The market estimate (ME) sheet in Excel format
- 3 months of analyst support
TABLE OF CONTENTS
1 INTRODUCTION
- 1.1 Study Assumptions and Market Definition
- 1.2 Scope of the Study
2 RESEARCH METHODOLOGY
3 EXECUTIVE SUMMARY
4 MARKET LANDSCAPE
- 4.1 Market Overview
- 4.2 Market Drivers
- 4.2.1 Scaling AI From Pilot to Production
- 4.2.2 Rising Need for Model Monitoring and Drift Management
- 4.2.3 Expansion of Cloud-Native AI Infrastructure
- 4.2.4 Tightening AI Governance and Auditability Requirements
- 4.2.5 LLMOps and AgentOps Convergence Raising Lifecycle Complexity
- 4.2.6 GPU FinOps and Inference Cost Control Becoming a Platform Priority
- 4.3 Market Restraints
- 4.3.1 Shortage of Cross-Functional MLOps Talent
- 4.3.2 Fragmented Toolchains and Integration Debt
- 4.3.3 Sovereign AI and Data Localization Rules Fragmenting Deployment Architectures
- 4.3.4 Security Exposure Across Model Registries, Feature Stores, and CI/CD Supply Chains
- 4.4 Impact of Macroeconomic Factors on the Market
- 4.4.1 Enterprise IT Budget Prioritization
- 4.4.2 GPU and Accelerated Compute Cost Inflation
- 4.4.3 Cloud Cost Optimization and FinOps Pressure
- 4.4.4 Trade Policy and Semiconductor Supply Exposure
- 4.5 Industry Value Chain Analysis
- 4.5.1 Data Ingestion and Labeling
- 4.5.2 Feature Engineering and Feature Store Management
- 4.5.3 Model Development and Experimentation
- 4.5.4 Validation and Responsible AI Controls
- 4.5.5 Deployment and Serving
- 4.5.6 Monitoring, Observability, and Retraining
- 4.5.7 Integration, Support, and Managed Services
- 4.6 Regulatory Landscape
- 4.6.1 AI Governance and Model Risk Management Rules
- 4.6.2 Data Privacy and Cross-Border Data Transfer Requirements
- 4.6.3 Sector-Specific Compliance for BFSI, Healthcare, and Public Sector Deployments
- 4.6.4 Copyright, Provenance, and Foundation Model Usage Controls
- 4.7 Technological Outlook
- 4.7.1 Unified MLOps and LLMOps Control Planes
- 4.7.2 Multi-Cloud and Hybrid Orchestration
- 4.7.3 Feature Stores, Vector Stores, and Metadata Layers
- 4.7.4 Automated Evaluation, Guardrails, and Policy-as-Code
- 4.7.5 Edge and Real-Time Model Serving
- 4.8 Porter's Five Forces Analysis
- 4.8.1 Bargaining Power of Buyers
- 4.8.2 Bargaining Power of Suppliers
- 4.8.3 Threat of New Entrants
- 4.8.4 Threat of Substitutes
- 4.8.5 Intensity of Competitive Rivalry
5 MARKET SIZE AND GROWTH FORECASTS (VALUE)
- 5.1 By Component
- 5.1.1 Platform
- 5.1.1.1 Experiment Tracking and Collaboration
- 5.1.1.2 Pipeline Orchestration and CI/CD
- 5.1.1.3 Feature Store and Data Lineage
- 5.1.1.4 Model Registry and Versioning
- 5.1.1.5 Deployment and Serving
- 5.1.1.6 Monitoring and Observability
- 5.1.1.7 Governance and Responsible AI
- 5.1.2 Services
- 5.1.2.1 Consulting and Strategy
- 5.1.2.2 Implementation and Integration
- 5.1.2.3 Training and Enablement
- 5.1.2.4 Managed Services
- 5.1.2.5 Support and Maintenance
- 5.1.1 Platform
- 5.2 By Deployment Mode
- 5.2.1 Cloud
- 5.2.2 On-Premises
- 5.2.3 Hybrid
- 5.3 By Organization Size
- 5.3.1 Large Enterprises
- 5.3.2 Small and Medium-Sized Enterprises
- 5.4 By End-User Industry
- 5.4.1 BFSI
- 5.4.2 Healthcare and Life Sciences
- 5.4.3 IT and Telecom
- 5.4.4 Retail and E-commerce
- 5.4.5 Manufacturing
- 5.4.6 Government and Public Sector
- 5.4.7 Energy and Utilities
- 5.4.8 Media and Entertainment
- 5.4.9 Transportation and Logistics
- 5.4.10 Education and Research
- 5.5 By Geography
- 5.5.1 North America
- 5.5.1.1 United States
- 5.5.1.2 Canada
- 5.5.1.3 Mexico
- 5.5.2 South America
- 5.5.2.1 Brazil
- 5.5.2.2 Argentina
- 5.5.2.3 Chile
- 5.5.2.4 Rest of South America
- 5.5.3 Europe
- 5.5.3.1 Germany
- 5.5.3.2 United Kingdom
- 5.5.3.3 France
- 5.5.3.4 Italy
- 5.5.3.5 Spain
- 5.5.3.6 Russia
- 5.5.3.7 Netherlands
- 5.5.3.8 Rest of Europe
- 5.5.4 Asia-Pacific
- 5.5.4.1 China
- 5.5.4.2 Japan
- 5.5.4.3 India
- 5.5.4.4 South Korea
- 5.5.4.5 Singapore
- 5.5.4.6 Rest of Asia-Pacific
- 5.5.5 Middle East
- 5.5.5.1 Saudi Arabia
- 5.5.5.2 United Arab Emirates
- 5.5.5.3 Turkey
- 5.5.5.4 Israel
- 5.5.5.5 Rest of Middle East
- 5.5.6 Africa
- 5.5.6.1 South Africa
- 5.5.6.2 Egypt
- 5.5.6.3 Nigeria
- 5.5.6.4 Kenya
- 5.5.6.5 Rest of Africa
- 5.5.1 North America
6 COMPETITIVE LANDSCAPE
- 6.1 Market Concentration
- 6.2 Strategic Moves
- 6.3 Market Share Analysis
- 6.4 Company Profiles (includes Global Level Overview, Market Level Overview, Core Segments, Financials as available, Strategic Information, Market Rank/Share, Products and Services, Recent Developments)
- 6.4.1 Amazon Web Services, Inc.
- 6.4.2 Microsoft Corporation
- 6.4.3 Google LLC
- 6.4.4 IBM Corporation
- 6.4.5 Databricks, Inc.
- 6.4.6 DataRobot, Inc.
- 6.4.7 Domino Data Lab, Inc.
- 6.4.8 Dataiku SAS
- 6.4.9 H2O.ai, Inc.
- 6.4.10 Cloudera, Inc.
- 6.4.11 Hewlett Packard Enterprise Company
- 6.4.12 SAS Institute Inc.
- 6.4.13 Snowflake Inc.
- 6.4.14 Teradata Corporation
- 6.4.15 Seldon Technologies Ltd.
- 6.4.16 ClearML Inc.
- 6.4.17 Weights & Biases, Inc.
- 6.4.18 Neptune Labs Sp. z o.o.
- 6.4.19 Fiddler AI, Inc.
- 6.4.20 ModelOp, Inc.
- 6.4.21 Arize AI, Inc.
7 MARKET OPPORTUNITIES AND FUTURE OUTLOOK
- 7.1 White-Space and Unmet-Need Assessment
- 7.2 Future Outlook
