
|
시장보고서
상품코드
2064461
GPU 전원 공급 장치(PSU) 시장 : 시장 점유율 분석, 업계 동향 및 통계, 성장 예측(2026-2031년)GPU Power Supply Unit (PSU) - Market Share Analysis, Industry Trends & Statistics, Growth Forecasts (2026 - 2031) |
||||||
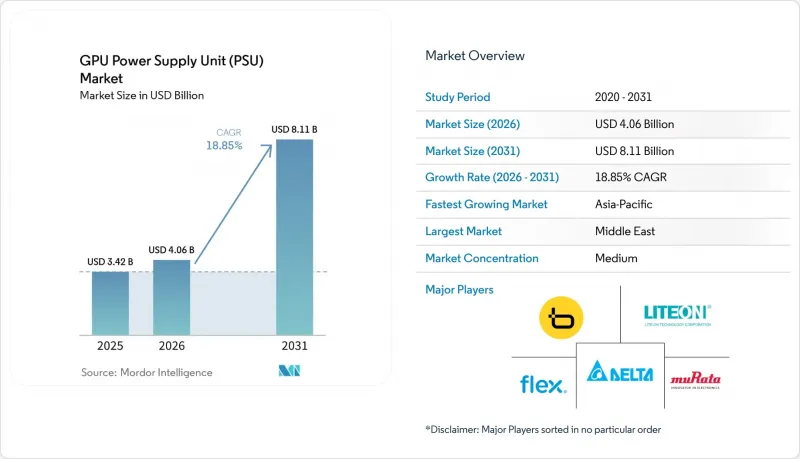
Mordor Intelligence에 의하면, GPU 전원 공급 장치(PSU) 시장 규모는 2025년 34억 2,000만 달러로 평가되었고, 2026년에는 40억 6,000만 달러로 추정도고, 2031년까지 81억 1,000만 달러에 이를 것으로 예측되며, 2026-2031년 CAGR 18.85%로 성장할 전망입니다.
본 보고서는 정격 출력별(1kW 이하, 1-2kW, 2-3kW, 3-5kW, 5kW 초과), 폼 팩터별(CRPS, OCP PSU, 독자 설계 및 하이퍼스케일러용 맞춤형 설계), 최종 용도별(GPU 가속기 서버, AI 추론 서버, HPC 시스템), 지역별(북미, 남미, 유럽, 아시아태평양, 기타)로 분류되어 있습니다. 시장 전망치는 금액(달러) 단위로 제시되어 있습니다.
세계의 GPU 전원 공급 장치(PSU) 시장 동향 및 분석
AI 주도형 데이터센터의 급증
각 하이퍼스케일러 기업들은 이미 계약된 4.5기가와트의 용량과 계획 중인 프로젝트의 추가 9기가와트를 지원하기 위해 2026년 설비 투자로 1,030억 달러를 투입하고, 송전망 연결 일정을 36개월에서 18개월로 단축하고 있습니다. NVIDIA GB200 NVL72 랙은 현재 캐비닛당 120-140kW를 소비하고 있어, 전원 공급 장치(PSU) 공급업체들은 1-2kW 설계에서 액체 매니폴드에 직접 연결되는 모듈식 5-10kW 유닛으로 전환할 수밖에 없는 상황입니다. 기존 시설의 개보수는 신축에 비해 경제적으로 불리합니다. 왜냐하면, 기존 10메가와트 규모의 사이트를 AI 대응 수준으로 업그레이드하려면 시설 한 곳당 300만-400만 달러의 비용이 드는 반면, 열 설계상의 절충점을 피할 수 있는 신규 건설의 경우 1,600만 달러면 충분하기 때문입니다. 각 벤더 기업들은 버지니아주, 텍사스주, 싱가포르에 위치한 하이퍼스케일러의 건설 클러스터 인근에 재고를 배치하여 선구자로서의 우위를 확보하려 하고 있으며, 델타 일렉트로닉스는 2025년 4분기 서버용 PSU 매출의 50%를 AI 관련 PSU가 차지했다고 밝혔습니다.
GPU 기반 고성능 컴퓨팅의 급속한 보급
기업들이 클라우드 데이터 전송 비용을 절감하기 위해 온프레미스 추론 서버를 도입함에 따라, 엔터프라이즈 HPC 클러스터는 하이퍼스케일러의 아키텍처를 모방하는 추세를 보이고 있습니다. 2025년 7월에 출시된 Dell의 PowerEdge XE7745는 듀얼 GPU 보드용으로 최적화된 3,200와트 80 PLUS Titanium 인증 전원 공급 장치를 내장하고 있습니다. 테스트 시 연산 스케일링으로 인해 쿼리당 전력 소비량이 0.34 Wh에서 4.32 Wh로 증가함에 따라, 기업은 GPU 수를 늘리지 않고도 전원 공급 장치(PSU)의 용량을 두 배로 늘릴 수밖에 없게 되었습니다. Flex는 이러한 추세에 대응하여 2025년에 댈러스, 콜롬비아, 폴란드에서 총 113만 4,000제곱피트의 생산 능력을 확충함으로써 맞춤형 주문의 리드타임을 단축했습니다. 클라우드와 엔터프라이즈 사양의 융합으로 설계 주기가 12개월로 단축되었으며, 벤더들은 Open Compute Project와 독자 사양의 랙을 모두 충족하는 상호 운용 가능한 플랫폼 개발을 촉진하고 있습니다.
갈륨 질화물 부품 공급망의 변동
중국은 전 세계 갈륨 생산량의 98%를 장악했으며, 2024년 수출 규제로 인해 현물 가격이 kg당 2,100달러로 두 배로 치솟아 고출력 PSU의 BOM 비용을 끌어올렸습니다. 인노사이언스는 97%의 수율로 8인치 웨이퍼의월생산량을 1만 5,000장으로 확대하며 구글과의 계약을 확정지었으나, 중국 이외공급업체들은 갑작스러운 수출 금지 위험에 노출되어 있습니다. 유럽과 미국공급업체들은 유럽과 북미에서 갈륨 질화물 에피택셜 라인에 공동 투자하고 있지만, 상업적 규모의 생산을 시작하기까지는 아직 2-3년이 소요될 것으로 예상되므로, 2027년까지 가격 변동이 지속될 것으로 보입니다.
부문별 분석
2025년에는 2-3kW급 제품이 GPU 전원 공급 장치 시장 매출의 42%를 차지헸으며, 기존의 208/240V 배전 시스템 및 공랭식 방식과의 호환성을 입증하고 있습니다. 그러나 5kW를 초과하는 유닛의 경우, 하이퍼스케일러들이 더 높은 열 부하에 대응하기 위해 48V 백플레인과 액체 매니폴드를 표준화해 나감에 따라, 2031년까지 연평균 성장률(CAGR) 20.04%를 나타낼 것으로 예측됩니다. Navitas Semiconductor의 12kW 설계는 97.8%의 효율을 입증했으며, 여전히 3.3kW 실리콘 설계에 국한되어 있는 공급업체들에게 목표로 삼아야 할 상한선을 제시했습니다.
추론 클러스터를 업그레이드하는 기업들은 Dell의 PowerEdge XE7745와 같은 듀얼 GPU 서버와 호환되기 때문에 3-5kW급 전원 공급 장치(PSU)를 선호하여 채택하고 있습니다. 5kW 이상의 GPU 전원 공급 장치 시장은 북미에 집중되어 있는 반면, 아시아태평양의 데이터센터에서는 설비 투자를 미루기 위해 2-3kW급 장치로 교체하는 작업이 진행되고 있습니다. SKU당 3,500-8,000달러가 드는 80 PLUS Titanium 인증 비용은 최고 출력 대역에서 제품 출시를 지연시키고, 소규모 공급업체에 과도한 부담을 안겨주고 있습니다.
지역별 분석
아시아태평양은 2025년에도 매출 점유율 63%를 유지했으며, 그 기반이 되는 것은 대만의 수직 통합형 공급망입니다. 이 지역에서는 델타 일렉트로닉스, 라이트온 테크놀로지, FSP 그룹이 합쳐서 전 세계 생산량의 40% 이상을 차지하고 있습니다. 델타의 2025년 4분기 매출은 1,616억 1,000만 대만 달러(51억 1,000만 달러)에 달했으며, 서버용 전원 공급 장치 매출 중 50%를 AI용 전원 공급 장치가 차지했습니다. 인노사이언스의 갈륨 질화물 웨이퍼 규모 생산은 원자재에 대한 우선적인 접근권을 확보하고 있어, 이를 통해 대만의 조립 제조업체들은 유럽 및 미국의 동종 업계 경쟁사들보다 더 짧은 리드타임을 제시할 수 있게 되었습니다. 그러나 하이퍼스케일러가 설계 업무를 사내에서 직접 수행함에 따라, OEM은 설계 도면대로 제조(Build-to-Print)하는 역할로 밀려나게 되었고, 이로 인해 이익률에 대한 압박이 커지고 있습니다.
북미 시장은 하이퍼스케일러들의 대규모 투자와 개발에 힘입어 연평균 성장률(CAGR) 19.96%로 성장할 것으로 전망됩니다. 이 기업들은 현재 35기가와트 규모의 설비를 건설 중이며, 브룩필드사와 2026-2030년 10.5기가와트의 청정 에너지 공급 계약을 체결했습니다. 또한, 듀크 에너지는 인공지능(AI) 용도로 인한 에너지 수요 증가에 대응하기 위해 송전망 업그레이드에 1,030억 달러를 배정했습니다. 플렉스사는 2025년, 제조 공간을 53만 4,000제곱피트 확장하며 미국 내 사업을 확대했습니다. 이는 지정학적 리스크를 완화하고 공급망의 회복탄력성을 확보하기 위한 현지 생산에 대한 관심 증가에 부응하는 것입니다.
유럽과 남미에서는 주로 하이퍼스케일 캠퍼스의 수가 적고 환경 허가 규제가 엄격하기 때문에 북미에 비해 성장 속도가 둔화되고 있습니다. 그러나 유럽의 ‘에코디자인 지침’에 따라 에너지 효율이 더 높고 친환경적인 ‘80 PLUS Titanium’ 인증을 받은 전원 공급 장치(PSU)의 도입이 확대되고 있습니다. 반면, 중동 및 아프리카는 송전망 용량이 제한적이고 수입 부품에 대한 의존도가 높다는 등의 제약으로 인해 여전히 발전의 초기 단계에 머물러 있습니다. 이러한 과제들이 있음에도 불구하고, 사우디아라비아와 아랍에미리트연합(UAE) 등 여러 국가에서 추진 중인 국가 주도의 AI 이니셔티브가 1차 단계인 데이터센터 설립을 촉진하고 있으며, 이는 해당 지역의 성장 시작을 알리고 있습니다.
기타 혜택
- 엑셀 형식 시장 예측(ME) 시트
- 3개월간의 애널리스트 지원
자주 묻는 질문
목차
제1장 서론
제2장 조사 방법
제3장 주요 요약
제4장 시장 구도
제5장 시장 규모 및 성장 예측
제6장 경쟁 구도
제7장 시장 기회 및 향후 전망
AJYAccording to Mordor Intelligence, the gPU power supply unit market size is expected to increase from USD 3.42 billion in 2025 to USD 4.06 billion in 2026 and reach USD 8.11 billion by 2031, growing at a CAGR of 18.85% over 2026-2031.

This report is Segmented by Output Power Rating (Up To 1 KW, 1-2 KW, 2-3 KW, 3-5 KW, and Above 5 KW), Form Factor (CRPS, OCP PSUs, and Proprietary and Hyperscaler Custom Designs), End Application (GPU Accelerator Servers, AI Inference Servers, and HPC Systems), and Geography (North America, South America, Europe, Asia-Pacific, and Rest of the World). Market Forecasts are Provided in Value (USD).
Global GPU Power Supply Unit (PSU) Market Trends and Insights
Surge in AI-Driven Data Centers
Hyperscalers committed USD 103 billion in 2026 capital expenditures to support 4.5 gigawatts of contracted capacity and a further 9 gigawatts in pipeline projects, accelerating grid interconnection timelines from 36 months to 18 months. NVIDIA GB200 NVL72 racks now draw 120-140 kilowatts per cabinet, compelling PSU vendors to move from 1-2 kilowatt designs to modular 5-10 kilowatt units that couple directly with liquid manifolds. Retrofit economics favor greenfield builds because upgrading a legacy 10-megawatt site to AI densities costs operators USD 3-4 million per facility, compared with USD 16 million for a new build that avoids thermal trade-offs. Vendors are staging inventory near hyperscaler construction clusters in Virginia, Texas, and Singapore to secure a first-mover advantage, and Delta Electronics disclosed that AI-related PSUs accounted for 50% of its server-PSU revenue in Q4 2025.
Rapid Adoption of GPU-Based High-Performance Computing
Enterprise HPC clusters are mirroring hyperscaler architectures as firms deploy on-premises inference servers to avoid cloud egress costs. Dell's PowerEdge XE7745, launched in July 2025, integrates a 3,200-watt 80 PLUS Titanium PSU tailored for dual-GPU boards. Test-time compute scaling lifted per-query energy from 0.34 Wh to 4.32 Wh, forcing enterprises to double PSU capacity without increasing GPU count. Flex Ltd backed the trend by adding 1.134 million ft2 of capacity across Dallas, Colombia, and Poland in 2025, shortening lead times for custom orders. The convergence of cloud and enterprise specifications is compressing design cycles to 12 months, encouraging vendors to develop interoperable platforms that satisfy both Open Compute Project and proprietary racks.
Supply Chain Volatility in Gallium Nitride Components
China controls 98% of global gallium output, and 2024 export curbs doubled spot prices to USD 2,100 kg-1, inflating BOM costs for high-power PSUs. Innoscience scaled wafer fabrication to 15,000 eight-inch units per month at 97% yields, locking in deals with Google but exposing non-Chinese vendors to sudden embargo risk. Western suppliers are co-funding gallium-nitride epi-lines in Europe and North America, but commercial scale remains two to three years away, maintaining price volatility through 2027.
Other drivers and restraints analyzed in the detailed report include:
- Growing Demand for Liquid-Cooled Rack Architectures
- Integration of Digital Twin-Enabled PSU Monitoring
- Thermal Management Challenges Above 5 kW Output
For complete list of drivers and restraints, kindly check the Table Of Contents.
Segment Analysis
The 2-3 kilowatt category accounted for 42% of GPU power supply unit market revenue in 2025, underscoring its fit with existing 208/240 V power distribution and air cooling. Units above 5 kilowatts, however, are forecast to grow at a 20.04% CAGR through 2031 as hyperscalers standardize on 48 V backplanes and liquid manifolds to handle higher thermal loads. Navitas Semiconductor's 12-kilowatt blueprint validated 97.8% efficiency, establishing an aspirational ceiling for vendors still limited to 3.3-kilowatt silicon designs.
Enterprises upgrading inference clusters gravitate toward 3-5 kilowatt PSUs because they align with dual-GPU servers like Dell's PowerEdge XE7745. The GPU power supply unit market for the above-5-kilowatt tier is concentrated in North America, whereas Asia-Pacific data centers are retrofitting 2-3 kilowatt units to postpone capex. Certification costs under 80 PLUS Titanium, running USD 3,500-8,000 per SKU, delay launches in the highest-power bands, and disproportionately burden smaller vendors.
Geography Analysis
Asia-Pacific retained 63% revenue share in 2025, anchored by Taiwan's vertically integrated supply chain, where Delta Electronics, Lite-On Technology, and FSP Group collectively exceed 40% global output. Delta's Q4 2025 sales reached NTD 161.61 billion (USD 5.11 billion) with AI PSUs contributing 50% of server-power turnover. Innoscience's gallium nitride wafer-scale production secures priority access to raw materials, enabling Taiwanese assemblers to quote shorter lead times than their Western peers. Yet margin pressure is mounting as hyperscalers move design work in-house, relegating OEMs to build-to-print roles.
North America is projected to grow at a compound annual growth rate (CAGR) of 19.96% due to significant investments and developments by hyperscalers. These companies currently have 35 gigawatts of capacity under construction and have entered into a 10.5-gigawatt clean-energy agreement with Brookfield, which will span from 2026 to 2030. Additionally, Duke Energy has allocated USD 103 billion to grid upgrades to accommodate increasing energy demand driven by artificial intelligence (AI) applications. Flex Ltd expanded its U.S. operations in 2025 by adding 534,000 square feet of manufacturing space, addressing the growing preference for localized production to mitigate geopolitical risks and ensure supply chain resilience.
Europe and South America are experiencing slower growth than North America, primarily due to fewer hyperscale campuses and stricter environmental permitting regulations. However, Europe's Ecodesign Directive is driving the adoption of 80 PLUS Titanium power supply units (PSUs), which are more energy-efficient and environmentally friendly. In contrast, the Middle East and Africa regions remain in the early stages of development, constrained by limited grid capacity and a heavy reliance on imported components. Despite these challenges, sovereign AI initiatives in countries like Saudi Arabia and the United Arab Emirates are fostering the establishment of first-wave data centers, signaling the beginning of growth in these regions.
- Delta Electronics Inc.
- Lite-On Technology Corporation
- Flex Ltd.
- Zippy Technology Corp.
- Murata Manufacturing Co. Ltd.
- AcBel Polytech Inc.
- FSP Group
- Advanced Energy Industries Inc.
- CUI Inc.
- Sea Sonic Electronics Co. Ltd.
- Shenzhen Great Wall Technology Co. Ltd.
- Super Flower Computer Inc.
- Chicony Power Technology Co. Ltd.
- Bel Power Solutions and Protection
- TDK-Lambda Corporation
- Mean Well Enterprises Co. Ltd.
- Coolisys Technologies Corp.
- AsusTek Computer Inc.
- Enermax Technology Corporation
- Corsair Gaming Inc.
Additional Benefits:
- The market estimate (ME) sheet in Excel format
- 3 months of analyst support
TABLE OF CONTENTS
1 INTRODUCTION
- 1.1 Study Assumptions and Market Definition
- 1.2 Scope of the Study
2 RESEARCH METHODOLOGY
3 EXECUTIVE SUMMARY
4 MARKET LANDSCAPE
- 4.1 Market Overview
- 4.2 Market Drivers
- 4.2.1 Surge in AI-Driven Data Centers
- 4.2.2 Rapid Adoption of GPU-Based High-Performance Computing
- 4.2.3 Growing Demand for Liquid-Cooled Rack Architectures
- 4.2.4 Integration of Digital Twin-Enabled PSU Monitoring
- 4.2.5 Increased Efficiency Mandates Under 80 PLUS Titanium and Beyond
- 4.2.6 Expansion of Hyperscaler In-House PSU Design Capabilities
- 4.3 Market Restraints
- 4.3.1 Supply Chain Volatility in Gallium Nitride (GaN) Components
- 4.3.2 Thermal Management Challenges Above 5 kW Output
- 4.3.3 Limited Retrofit Viability in Legacy Server Racks
- 4.3.4 High Certification Costs for Redundant Topologies
- 4.4 Impact of Macroeconomic Factors on the Market
- 4.5 Industry Value Chain Analysis
- 4.6 Regulatory Landscape
- 4.7 Technological Outlook
- 4.8 Porter's Five Forces Analysis
- 4.8.1 Bargaining Power of Suppliers
- 4.8.2 Bargaining Power of Buyers
- 4.8.3 Threat of New Entrants
- 4.8.4 Threat of Substitutes
- 4.8.5 Intensity of Competitive Rivalry
5 MARKET SIZE AND GROWTH FORECASTS (VALUE)
- 5.1 By Output Power Rating
- 5.1.1 Up to 1 kW
- 5.1.2 1-2 kW
- 5.1.3 2-3 kW
- 5.1.4 3-5 kW
- 5.1.5 Above 5 kW
- 5.2 By Form Factor
- 5.2.1 Common Redundant Power Supply (CRPS)
- 5.2.2 Open Compute Project (OCP) PSUs
- 5.2.3 Proprietary and Hyperscaler Custom Designs
- 5.3 By End Application
- 5.3.1 GPU Accelerator Servers
- 5.3.2 AI Inference Servers
- 5.3.3 HPC Systems
- 5.4 By Geography
- 5.4.1 North America
- 5.4.1.1 United States
- 5.4.1.2 Canada
- 5.4.1.3 Mexico
- 5.4.2 South America
- 5.4.2.1 Brazil
- 5.4.2.2 Argentina
- 5.4.2.3 Rest of South America
- 5.4.3 Europe
- 5.4.3.1 United Kingdom
- 5.4.3.2 Germany
- 5.4.3.3 Rest of Europe
- 5.4.4 Asia-Pacific
- 5.4.4.1 China
- 5.4.4.2 Japan
- 5.4.4.3 India
- 5.4.4.4 South Korea
- 5.4.4.5 Rest of Asia-Pacific
- 5.4.5 Rest of the World
- 5.4.1 North America
6 COMPETITIVE LANDSCAPE
- 6.1 Market Concentration
- 6.2 Strategic Moves
- 6.3 Market Share Analysis
- 6.4 Company Profiles (includes Global Level Overview, Market Level Overview, Core Segments, Financials as available, Strategic Information, Market Rank/Share, Products and Services, Recent Developments)
- 6.4.1 Delta Electronics Inc.
- 6.4.2 Lite-On Technology Corporation
- 6.4.3 Flex Ltd.
- 6.4.4 Zippy Technology Corp.
- 6.4.5 Murata Manufacturing Co. Ltd.
- 6.4.6 AcBel Polytech Inc.
- 6.4.7 FSP Group
- 6.4.8 Advanced Energy Industries Inc.
- 6.4.9 CUI Inc.
- 6.4.10 Sea Sonic Electronics Co. Ltd.
- 6.4.11 Shenzhen Great Wall Technology Co. Ltd.
- 6.4.12 Super Flower Computer Inc.
- 6.4.13 Chicony Power Technology Co. Ltd.
- 6.4.14 Bel Power Solutions and Protection
- 6.4.15 TDK-Lambda Corporation
- 6.4.16 Mean Well Enterprises Co. Ltd.
- 6.4.17 Coolisys Technologies Corp.
- 6.4.18 AsusTek Computer Inc.
- 6.4.19 Enermax Technology Corporation
- 6.4.20 Corsair Gaming Inc.
7 MARKET OPPORTUNITIES AND FUTURE OUTLOOK
- 7.1 White-Space and Unmet-Need Assessment
