
|
시장보고서
상품코드
2066516
위협 인텔리전스 시장 : 시장 점유율 분석, 업계 동향 및 통계, 성장 예측(2026-2031년)Threat Intelligence - Market Share Analysis, Industry Trends & Statistics, Growth Forecasts (2026 - 2031) |
||||||
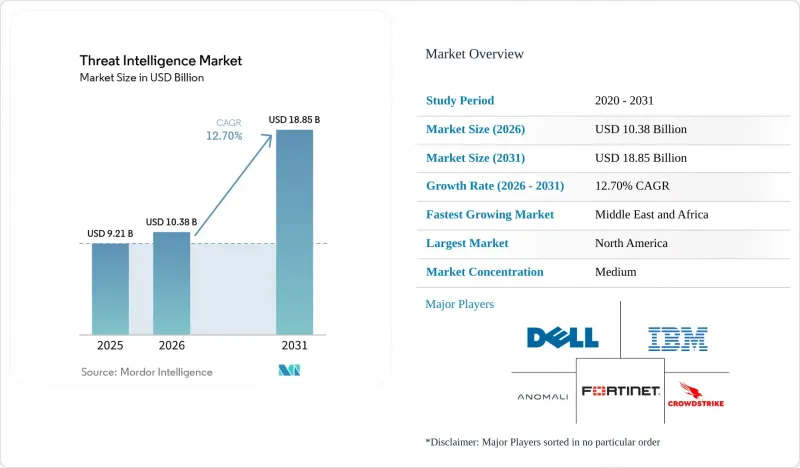
Mordor Intelligence에 의하면, 위협 인텔리전스 시장 규모는 2026년 103억 8,000만 달러로 추정되고, 2025년 92억 1,000만 달러에서 확대해, 2031년에는 188억 5,000만 달러에 이를 것으로 예측되며, 2026-2031년 CAGR 12.7%로 성장할 전망입니다.
본 보고서는 구성 요소별(솔루션 및 서비스), 도입 형태별(온프레미스, 클라우드, 하이브리드), 위협 인텔리전스 유형별(전략적, 전술적, 운영적, 기술적), 조직 규모별(대기업, 중소기업), 최종 사용자 산업별(은행, 금융서비스 및 보험(BFSI), IT 및 통신, 기타), 지역별로 분류되어 있습니다. 시장 전망은 금액(달러) 기준으로 제시되어 있습니다.
세계의 위협 인텔리전스 시장 동향 및 인사이트
클라우드 네이티브 워크로드를 표적으로 삼는 AI 기반 다형성 악성코드
AI에 의해 생성된 다형성 악성코드는 현장에서 코드를 재작성할 수 있어, 기존의 시그니처 기반 도구를 무력화시키고 방어 측으로 하여금 행동 분석에 의존할 수밖에 없게 만들고 있습니다. IBM의 조사에 따르면, 이러한 악성코드는 현재 사람과의 접촉 없이 몸값 협상을 진행하며, 클라우드 환경에 따라 전술을 전환하기 때문에 사고 대응을 복잡하게 만들고 있습니다. 미국 법무부는 최근 AI를 활용한 익스플로잇을 통해 2억 6,300만 달러 상당의 암호화폐를 훔친 범죄 조직을 적발하며, 이에 따른 재정적 위험을 부각시켰습니다. 북미 기업들은 머신러닝 기반 감지에 대한 예산을 늘리고 있으며, 클라우드 워크로드 보호에 있어 위협 인텔리전스 시장이 필수적인 요소로 자리 잡고 있습니다.
중요 인프라 사업자의 EU-NIS2 규정 준수 관련 지출
2024년 10월부터 시행되는 NIS2 지침에 따라, 유럽의 약 30만 개 사업체는 위험 평가, 사고 보고 및 공급망 검토를 의무적으로 수행해야 합니다. 벌금은 최대 1,000만 유로 또는 전 세계 매출의 2%에 달할 수 있어, 이로 인해 이사회는 실시간 정보 수집을 우선시할 수밖에 없는 상황입니다. EU 역외의 다국적 기업도 EU 고객에게 서비스를 제공할 때는 관련 규정을 준수해야 하므로, 감사 절차를 완료한 인텔리전스 피드를 패키지화한 공급업체에게는 비즈니스 기회가 확대되고 있습니다.
레거시 SOC에서의 STIX/TAXII 상호운용성 문제
STIX 및 TAXII는 2021년에 OASIS 표준으로 채택되었으나, 많은 레거시 플랫폼에서는 여전히 독자적인 형식을 처리하고 있어 원활한 데이터 공유가 저해되고 있습니다. 예비 조사 결과, 통합의 복잡성과 표기의 불일치가 주요 장애 요인임이 밝혀졌습니다. 그 결과, 조직은 플랫폼 업그레이드를 미루고 있어 단기적인 지출이 억제되고 있습니다.
부문별 분석
2025년에는 솔루션이 전 세계 매출의 55.40%를 차지했으며, 플랫폼은 위협 인텔리전스 시장에서 압도적인 점유율을 확보했습니다. Microsoft Defender Threat Intelligence만 해도 하루에 78조 건의 신호를 처리하고 있어, 그 규모 면에서 압도적인 우위를 보이고 있습니다. 바로 이러한 지배적 지위가, 플랫폼 관련 시장 규모가 2031년까지 계속 확대될 것으로 예상되는 이유를 뒷받침하고 있습니다. 주요 벤더들은 행동 분석에 AI를 도입하여 분석가의 업무 부담을 줄이고 감지 정확도를 높이고 있습니다.
매니지드 서비스 및 프로페셔널 서비스는 인력 부족과 복잡성 심화를 반영하여 연평균 성장률(CAGR) 14.12%를 기록하며 제품 성장률을 상회하고 있습니다. SANS의 조사에 따르면, 많은 기업이 기술 격차를 해소하기 위해 인재 발굴 업무를 외부에 위탁하고 있습니다. 도입 과정에 교육을 결합한 파트너십을 통해 구매자는 더 신속하게 가치를 실현할 수 있으며, 특히 위협 인텔리전스 업계의 중견 시장 부문에서 서비스 이용 확대를 촉진하고 있습니다.
2025년에는 규제가 엄격한 업계가 데이터의 현지 보관을 선호함에 따라, 온프레미스 도입이 지출의 54.30%를 차지했습니다. 그럼에도 불구하고, 클라우드 호스팅형 플랫폼은 연평균 성장률(CAGR) 16.25%로 가장 빠르게 성장하고 있으며, 공급업체들의 보안 강화 및 Microsoft Defender Threat Intelligence가 ‘High’ 등급을 획득한 점 등은 FedRAMP 확대에 대한 신뢰가 높아지고 있음을 보여줍니다. 업계 분석가들은 예측 기간 후반에 클라우드 기반 위협 인텔리전스 시장 규모가 온프레미스 방식의 총 규모를 넘어설 것으로 전망하고 있습니다.
하이브리드 방식은 기존 센서와 SaaS형 분석을 융합한 것으로, 자체적인 속도에 맞추어 현대화를 추진하는 조직에게 매력적입니다. 금융 규제 당국은 현재 지속적인 정보 통합을 구체적으로 언급한, 안전한 클라우드 도입을 위한 청사진을 발표하고 있으며, 이러한 움직임이 탄력을 받고 있습니다.
지역별 분석
북미는 클라우드 도입 성숙도, 민관 간 정보 공유, 그리고 벤더의 강력한 입지 덕분에 2025년 매출의 37.50%를 차지했습니다. 입법부는 정보공개법 제정을 지속적으로 추진하고 있는 한편, 연방 기관들은 위협 정보 시장을 강화하기 위한 실시간 데이터 교환 플랫폼을 지원하고 있습니다. 클라우드 워크로드를 표적으로 삼는 AI 기반 악성코드는 여전히 해당 지역에서 가장 큰 우려 사항이며, 이에 대한 플랫폼 지출은 꾸준히 유지되고 있습니다.
NIS2에 따라 유럽의 전망은 밝아지고 있습니다. 이 법에 따라 적용 대상이 2만 개에서 30만 개 사업체로 확대됨에 따라, 해당 위협 인텔리전스 시장 규모가 대폭 확대되고 있습니다. ‘사이버 복원력법’ 등 보완적인 법률에 따라, 공급망 전반에 걸친 지속적인 취약성 현황에 대한 수요가 더욱 높아지고 있습니다. 감사 대응이 완료된 보고서와 다국어 위협 데이터를 한데 묶어 제공하는 벤더는 유리한 입장에 있습니다.
중동은 2031년까지의 연평균 성장률(CAGR)이 15.35%로 가장 높은 성장세를 보이고 있습니다. UAE와 사우디아라비아의 국가 기관들은 특정 분야에 특화된 융합 센터에 대한 투자를 확대하고 있는 반면, 대형 에너지 기업들은 실시간 위협 정보 피드와 연계된 사이버 보험 할인 혜택을 받고 있습니다. 해당 지역의 지정학적 긴장이 고조됨에 따라, 공공 부문과 민간 부문 모두에게 위협 정보 시장의 전략적 가치가 높아지고 있습니다.
아시아태평양에서는 공격 건수가 두 자릿수 증가세를 보이고 있으며, 특히 인도네시아에서는 주당 사고 건수가 3,300건을 넘어섰습니다. 급속한 디지털화와 다양한 주권 규제가 맞물리면서 수요가 세분화되고 있습니다. 일본, 한국, 호주는 실시간 인텔리전스를 접근 제어에 통합하는 ‘제로 트러스트’ 시범 프로젝트를 주도하고 있는 반면, 중국과 인도의 데이터 현지화 법으로 인해 국내 클라우드 노드가 선호되는 추세입니다.
남미에서는 기술 인력 부족을 극복하기 위해 중견 BFSI(은행 및 금융 및 보험) 기업들이 위협 감지 업무를 외부에 위탁하고 있는 점이 도입을 촉진하고 있으며, 규모는 작지만 전 세계 수익에 기여하고 있습니다.
기타 혜택 :
- 엑셀 형식 시장 예측(ME) 시트
- 3개월간의 애널리스트 지원
자주 묻는 질문
목차
제1장 서론
제2장 조사 방법
제3장 주요 요약
제4장 시장 구도
제5장 시장 규모 및 성장 예측
제6장 경쟁 구도
제7장 시장 기회 및 향후 전망
AJYAccording to Mordor Intelligence, threat intelligence market size in 2026 is estimated at USD 10.38 billion, growing from 2025 value of USD 9.21 billion with 2031 projections showing USD 18.85 billion, growing at 12.7% CAGR over 2026-2031.

This report is Segmented by Component (Solutions, and Services), Deployment (On-Premise, Cloud, and Hybrid), Threat-Intelligence Type (Strategic, Tactical, Operational, and Technical), Organization Size (Large Enterprises, and Small and Medium-Sized Enterprises), End-User Industry (BFSI, IT and Telecommunications, and More), and Geography. The Market Forecasts are Provided in Terms of Value (USD).
Global Threat Intelligence Market Trends and Insights
AI-driven Polymorphic Malware Targeting Cloud-Native Workloads
AI-generated polymorphic malware can rewrite its code on the fly, defeating traditional signature tools and forcing defenders to rely on behavioural analytics. IBM research shows such malware now negotiates ransoms without human contact and pivots tactics based on cloud configuration, complicating incident response. The U.S. Department of Justice recently dismantled a ring that stole USD 263 million in cryptocurrency through AI-enabled exploits, underscoring the financial risk. North American enterprises are boosting budget for machine-learning detection, making the threat intelligence market essential for cloud workload protection.
EU-NIS2 Compliance Spend by Critical Infrastructure Operators
Effective October 2024, the NIS2 directive subjects roughly 300,000 European entities to mandatory risk assessments, incident reporting, and supply-chain scrutiny. Penalties can reach EUR 10 million or 2% of global turnover, pushing boards to prioritise real-time intelligence. Multinationals outside the bloc must also comply when serving EU customers, widening opportunity for vendors that package ready-to-audit intelligence feeds.
STIX/TAXII Interoperability Gaps in Legacy SOCs
Although STIX and TAXII became OASIS standards in 2021, many legacy platforms still process proprietary formats, preventing seamless data sharing. An exploratory study identified integration complexity and inconsistent notation as primary hurdles. As a result, organisations delay platform upgrades, restraining short-term spending.
Other drivers and restraints analyzed in the detailed report include:
- Zero Trust Roll-outs in APAC Large Enterprises
- RaaS Cartels Fuelling Crypto-Wallet Monitoring Demand
- Escalating Subscription Costs for Actionable Intel Data
For complete list of drivers and restraints, kindly check the Table Of Contents.
Segment Analysis
Solutions generated 55.40% of global revenue in 2025, giving platforms an outsized hold on the threat intelligence market. Microsoft Defender Threat Intelligence alone processes 78 trillion signals per day, highlighting scale advantages. This dominance underlines why the market size attached to platforms is expected to keep rising through 2031. Leading vendors incorporate AI for behaviour analytics, easing analyst workload and improving detection fidelity.
Managed and professional services are outpacing product growth with a 14.12% CAGR, reflecting talent shortages and rising complexity. SANS surveys show many enterprises outsource hunting duties to close skill gaps. Partnerships that wrap training around deployments allow buyers to derive quicker value, propelling service uptake, especially across the threat intelligence industry's mid-market segment.
On-premise deployments held 54.30% of spending in 2025 as heavily regulated sectors prefer local data residency. Even so, cloud-hosted platforms are the fastest riser at 16.25% CAGR, signalling confidence in provider hardening and FedRAMP expansions such as Microsoft Defender Threat Intelligence gaining High attestation. Segment observers see the threat intelligence market size for cloud deliveries eclipsing on-premise totals late in the forecast window.
Hybrid approaches blend legacy sensors with SaaS analytics, appealing to organisations modernising at their own pace. Financial regulators now publish blueprints for secure cloud adoption that specifically mention continuous intelligence integration, accelerating momentum.
Geography Analysis
North America commanded 37.50% of 2025 revenue owing to mature cloud uptake, joint public-private information sharing, and deep vendor presence. Legislators continue to refine disclosure laws, while federal bodies sponsor real-time data-exchange platforms that reinforce the threat intelligence market. AI-enabled malware against cloud workloads remains the top regional concern, keeping platform spending buoyant.
Europe's outlook brightens under NIS2, which scales mandatory coverage from 20 000 to 300 000 entities, greatly enlarging the addressable threat intelligence market. Complementary legislation such as the Cyber Resilience Act furthers demand for continuous vulnerability context across supply chains. Vendors that package audit-ready reporting with multi-lingual threat data are well positioned.
The Middle East shows the fastest CAGR at 15.35% through 2031. National agencies in the UAE and Saudi Arabia invest in sector-focused fusion centres while energy majors receive cyber-insurance discounts tied to live feeds. Rising geopolitical tension in the region elevates the strategic value of the threat intelligence market for both public and private sectors.
Asia-Pacific sees a double-digit attack uptick, notably in Indonesia where weekly incidents top 3,300. Rapid digitalisation, paired with diverse sovereignty rules, produces fragmented demand. Japan, South Korea, and Australia lead Zero Trust pilots that embed live intelligence into access decisions, while China and India's data-localisation laws create preferences for in-country cloud nodes.
South America's adoption is spurred by mid-tier BFSI outsourcing threat-hunting to overcome skills shortages, adding to global revenue even if from a smaller base.
- IBM Corporation
- Cisco Systems Inc.
- Dell Technologies Inc.
- CrowdStrike Holdings Inc.
- Check Point Software Technologies Ltd.
- Trend Micro Incorporated
- Palo Alto Networks Inc.
- Fortinet Inc.
- Rapid7 Inc.
- Secureworks Inc.
- FireEye - Trellix
- Recorded Future Inc.
- Anomali Inc.
- LookingGlass Cyber Solutions Inc.
- LogRhythm Inc.
- McAfee LLC
- Broadcom Inc. (Symantec)
- Juniper Networks Inc.
- F-Secure Corporation
- SentinelOne Inc.
- Microsoft Corp. (Defender Threat Intelligence)
Additional Benefits:
- The market estimate (ME) sheet in Excel format
- 3 months of analyst support
TABLE OF CONTENTS
1 Introduction
- 1.1 Study Assumptions and Market Definition
- 1.2 Scope of the Study
2 Research Methodology
3 Executive Summary
4 Market Landscape
- 4.1 Market Overview
- 4.2 Market Drivers
- 4.2.1 AI-Driven Polymorphic Malware Targeting Cloud-Native Workloads in North America
- 4.2.2 EU-NIS2 Compliance Spend by Critical Infrastructure Operators
- 4.2.3 Zero-Trust Roll-outs in APAC Large Enterprises
- 4.2.4 RaaS Cartels Fueling Crypto-Wallet Monitoring Demand
- 4.2.5 Outsourced Threat-Hunting by South-American Mid-Tier BFSI
- 4.2.6 Cyber-Insurance Premium Discounts Tied to Live Threat Feeds (Middle East Energy)
- 4.3 Market Restraints
- 4.3.1 STIX/TAXII Interoperability Gaps in Legacy SOCs
- 4.3.2 Escalating Subscription Costs for Actionable Intel Data
- 4.3.3 Data-Sovereignty Barriers (China CSL, India DPDP, etc.)
- 4.3.4 Analyst Fatigue and Alert Overload in Resource-Constrained Teams
- 4.4 Regulatory Outlook
- 4.5 Technological Outlook
- 4.6 Porter's Five Forces Analysis
- 4.6.1 Threat of New Entrants
- 4.6.2 Bargaining Power of Buyers
- 4.6.3 Bargaining Power of Suppliers
- 4.6.4 Threat of Substitute Products
- 4.6.5 Intensity of Competitive Rivalry
- 4.7 Assessment of the Impact of Macroeconomic Factors on the Market
5 Market Size and Growth Forecasts (Value)
- 5.1 By Component
- 5.1.1 Solutions
- 5.1.1.1 Threat Intelligence Platforms
- 5.1.1.2 Security Information and Event Management (SIEM) Feeds
- 5.1.1.3 Threat Hunting/Analytics Tools
- 5.1.2 Services
- 5.1.2.1 Managed/Outsourced Services
- 5.1.2.2 Professional and Consulting
- 5.1.2.3 Training and Support
- 5.1.1 Solutions
- 5.2 By Deployment
- 5.2.1 On-premise
- 5.2.2 Cloud
- 5.2.3 Hybrid
- 5.3 By Threat-Intelligence Type
- 5.3.1 Strategic
- 5.3.2 Tactical
- 5.3.3 Operational
- 5.3.4 Technical
- 5.4 By Organization Size
- 5.4.1 Large Enterprises
- 5.4.2 Small and Medium-Sized Enterprises
- 5.5 By End-user Industry
- 5.5.1 BFSI
- 5.5.2 IT and Telecommunications
- 5.5.3 Retail and E-commerce
- 5.5.4 Manufacturing
- 5.5.5 Healthcare and Life Sciences
- 5.5.6 Government and Defense
- 5.5.7 Energy and Utilities
- 5.5.8 Others
- 5.6 By Geography
- 5.6.1 North America
- 5.6.1.1 United States
- 5.6.1.2 Canada
- 5.6.1.3 Mexico
- 5.6.2 South America
- 5.6.2.1 Brazil
- 5.6.2.2 Argentina
- 5.6.2.3 Chile
- 5.6.2.4 Peru
- 5.6.2.5 Rest of South America
- 5.6.3 Europe
- 5.6.3.1 Germany
- 5.6.3.2 United Kingdom
- 5.6.3.3 France
- 5.6.3.4 Italy
- 5.6.3.5 Spain
- 5.6.3.6 Rest of Europe
- 5.6.4 Asia-Pacific
- 5.6.4.1 China
- 5.6.4.2 Japan
- 5.6.4.3 South Korea
- 5.6.4.4 India
- 5.6.4.5 Australia
- 5.6.4.6 New Zealand
- 5.6.4.7 Rest of Asia-Pacific
- 5.6.5 Middle East
- 5.6.5.1 United Arab Emirates
- 5.6.5.2 Saudi Arabia
- 5.6.5.3 Turkey
- 5.6.5.4 Rest of Middle East
- 5.6.6 Africa
- 5.6.6.1 South Africa
- 5.6.6.2 Rest of Africa
- 5.6.1 North America
6 Competitive Landscape
- 6.1 Strategic Developments
- 6.2 Vendor Positioning Analysis
- 6.3 Company Profiles (includes Global level Overview, Market level overview, Core Segments, Financials as available, Strategic Information, Products and Services, and Recent Developments)
- 6.3.1 IBM Corporation
- 6.3.2 Cisco Systems Inc.
- 6.3.3 Dell Technologies Inc.
- 6.3.4 CrowdStrike Holdings Inc.
- 6.3.5 Check Point Software Technologies Ltd.
- 6.3.6 Trend Micro Incorporated
- 6.3.7 Palo Alto Networks Inc.
- 6.3.8 Fortinet Inc.
- 6.3.9 Rapid7 Inc.
- 6.3.10 Secureworks Inc.
- 6.3.11 FireEye - Trellix
- 6.3.12 Recorded Future Inc.
- 6.3.13 Anomali Inc.
- 6.3.14 LookingGlass Cyber Solutions Inc.
- 6.3.15 LogRhythm Inc.
- 6.3.16 McAfee LLC
- 6.3.17 Broadcom Inc. (Symantec)
- 6.3.18 Juniper Networks Inc.
- 6.3.19 F-Secure Corporation
- 6.3.20 SentinelOne Inc.
- 6.3.21 Microsoft Corp. (Defender Threat Intelligence)
7 Market Opportunities and Future Outlook
- 7.1 White-space and Unmet-Need Assessment
