

|
시장보고서
상품코드
2066520
풍력발전 : 시장 점유율 분석, 업계 동향 및 통계, 성장 예측(2026-2031년)Wind Power - Market Share Analysis, Industry Trends & Statistics, Growth Forecasts (2026 - 2031) |
||||||
 Mordor Intelligence
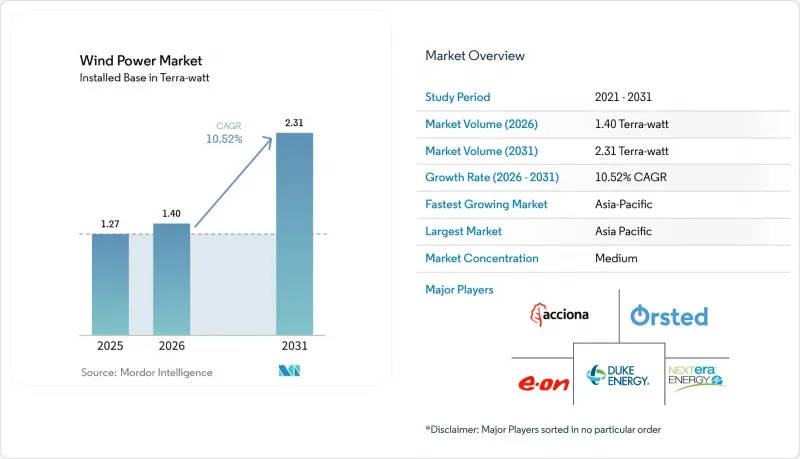
Mordor Intelligence에 의하면, 풍력발전 시장 규모는 2025년에 1.27 테라와트로 평가되었습니다. 2026년 1.4 테라와트에서 2031년까지 2.31 테라와트에 이를 것으로 예상되며, 예측 기간(2026-2031년) CAGR은 10.52%를 나타낼 전망입니다.
본 보고서는 설치 장소(육상 및 해상), 터빈 출력(3MW 이하, 3-6MW, 6MW 이상), 용도(유틸리티 규모, 상업 및 산업용, 지역 사회 프로젝트) 및 지역(북미, 유럽, 아시아태평양, 남미, 중동 및 아프리카)별로 분류되어 있습니다. 시장 규모 및 전망은 설치 용량(GW) 단위로 표시되어 있습니다.
세계의 풍력발전 시장 동향 및 인사이트
15 MW 이상의 터빈 비용의 급격한 하락
대형 터빈은 소형 유닛에 비해 기초, 배선 및 유지보수 비용을 15-20% 절감하며, 이에 따라 허브 높이가 높은 경우 설비 가동률을 8-12% 향상시킵니다.(1) 이러한 경제성 덕분에 개발업체들은 과거에는 상업적 수익성 측면에서 한계에 부딪혔던 입지를 추구할 수 있게 되었으며, 많은 해상 입지에서 그리드 패리티를 달성할 수 있게 되었습니다. 100미터를 넘는 블레이드로 인한 운송 병목 현상은 여전히 존재하지만, 항만 개보수 및 중량물 운반선 수주가 진행되고 있어 이러한 제약은 일시적인 것임이 시사되고 있습니다. 그 결과로 가져오는 자본 효율성 향상 덕분에, 풍력발전 시장은 지속적인 비용 경쟁력을 확보할 수 있는 입장에 있습니다.
데이터센터 사업자에 의한 기업 대상 PPA의 급증
대형 클라우드 제공업체들은 전력, 재생에너지 크레딧(REC), 그리고 연중무휴 24시간 청정 에너지 공급 보장을 한 세트로 묶은 10년에서 20년 규모의 전력 구매 계약(PPA)을 체결하고 있습니다. 이러한 계약들은 신규 프로젝트의 현금 흐름 위험을 완화하는 동시에, 풍력발전 업계의 개발 사업자들이 특히 북해의 송전 계통 연계 지점이나 미국 연안의 송전망 인근에서 데이터센터의 부하 프로파일에 맞추어 풍력발전소의 규모를 결정하도록 유도하고 있습니다. 인공지능(AI) 워크로드로 인한 전력 수요는 2040년까지 35-50% 증가할 것으로 예상되며, 재생에너지 조달은 단순한 CSR(기업의 사회적 책임) 활동이 아니라 사업 운영상의 필수 요건이 될 것입니다.
상품 가격 변동(철강, 희토류)
터빈 무게의 약 70%를 철강이 차지하고 있으며, 현물 가격이 10%만 변동해도 프로젝트의 설비 투자액이 최대 3퍼센트 포인트 변동할 가능성이 있습니다. 희토류 자석의 70%는 여전히 중국에서 조달되고 있기 때문에 네오디뮴이나 디스프로슘공급 충격은 추가적인 불확실성을 초래할 것입니다. 일부 OEM 제조업체들은 이러한 금속의 사용을 피하기 위해 전기 자석식 발전기 도입을 검토하고 있지만, 이러한 전환으로 인해 효율이 약 2% 저하될 가능성이 있습니다.(2)
부문별 분석
2025년 기준으로 육상 풍력 터빈은 설치 용량의 92.45%를 차지했으며, 이는 확립된 공급망과 신속한 건설 속도를 반영하고 있습니다. 그럼에도 불구하고, 해상 풍력 자산은 더 강한 바람, 토지 이용을 둘러싼 분쟁이 적다는 점, 그리고 부유식 기초 기술의 발전으로 인해 2031년까지 연평균 성장률(CAGR) 15.62%를 나타낼 것으로 전망됩니다. 일본 최초의 바지선형 부유식 발전 설비는 태풍이 빈번하게 발생하는 심해역에서 상업적 실현 가능성을 입증했습니다. 현재 해상에서는 16MW급 터빈이 표준으로 자리 잡고 있으며, 더 적은 대수로 동등한 발전량(메가와트)을 확보할 수 있기 때문에 설치 기간이 단축되고 수명 주기 비용도 절감되고 있습니다. 따라서 풍력발전 시장은 토지가 제한적인 경제권에서는 해상 발전으로 성장의 초점이 옮겨가고 있는 반면, 성숙한 지역에서는 육상 발전의 설비 현대화가 성장을 주도하고 있습니다.
신흥국의 개발업체들은 설비 투자 축소와 신속한 투자 회수를 이유로 육상 건설을 선호하고 있지만, 부유식 기초의 가격 하락으로 인해 경쟁 조건은 점차 균등해지고 있습니다. 연안 송전망이 정비됨에 따라, 해상 발전으로 생산된 전력은 태양광 발전으로 인한 주간 피크와 야간 전력 소비 감소 현상을 완화시켜, 계통 연계와 관련된 과제를 해소할 수 있습니다.
지역별 분석
아시아태평양은 2025년에 전 세계 풍력발전 용량의 53.55%를 차지하며 시장을 선도했으며, 2031년까지 연평균 성장률(CAGR) 11.42%를 유지할 전망입니다. 2024년에 중국에서만 76GW가 증설되었으며, 기록적인 육상 건설과 남중국해에서의 해상 확장이 맞물려 진전을 이루었습니다. 인도의 입찰 계획에서는 2030년까지 140 GW를 목표로 하고 있지만, 주 차원의 송전망 현대화 속도가 발전 용량 증가를 따라가지 못하고 있습니다. 일본과 한국은 토지 부족 문제를 해결하기 위해 부유식 프로젝트에 주력하고 있으며, 베트남은 풍력발전과 그린 암모니아 수출을 연계하는 초기 단계의 입찰에 주목하고 있습니다. 따라서 풍력발전 시장은 지역 전체에 걸친 통합된 공급망과 정부의 구매 보증의 혜택을 받고 있습니다.
유럽은 해상 풍력발전 분야의 혁신을 주도하고 있습니다. 북해에는 해상 풍력발전 설비 용량의 60%가 집중되어 있으며, 덴마크와 네덜란드에서는 원스톱 기관을 통해 인허가 취득 기간을 단축하고 있습니다. ‘REPowerEU’의 현지 조달 규정에 따라 스페인, 폴란드, 프랑스에서 터빈 공장이 활기를 띠고 있는 한편, 그린 수소 시범 플랜트가 새로운 판로를 확보하고 있습니다. 독일, 덴마크, 스페인에서 진행 중인 기존 설비의 현대화(리파워링)에서는 새로운 부지를 확보하지 않고, 기존 설치 장소에 6MW급 최신형 터빈을 도입함으로써 용량을 증강하고 있습니다.
북미에서는 성장세에 편차가 나타나고 있습니다. 2025년 1월에 발효된 연방 정부의 신규 해상 임대 모라토리엄으로 인해 새로운 부지 확보는 정체되어 있지만, 진행 중인 프로젝트에는 영향을 미치지 않습니다. 18개 주의 법무장관이 이 금지 조치에 이의를 제기하고 있으며, 해결까지의 일정은 법원의 판단에 맡겨져 있습니다. 중서부 전력망에서는 육상 풍력발전이 꾸준한 성장세를 보이고 있으나, PJM 및 MISO 지역의 신청 지연으로 인해 계통 연계까지의 기간이 길어지고 있습니다. ‘인플레이션 억제법’은 입법상의 명확화가 필요한 사항이지만, 여전히 프로젝트의 경제성을 뒷받침하고 있습니다.
중동 및 아프리카는 풍력발전 시장의 새로운 성장 최전선으로 부상하고 있습니다. 이집트의 10GW 규모 건설·소유·운영 계약과 모로코의 풍력·수소 하이브리드 허브는 이 지역의 야망을 상징합니다. 나미비아와 남아프리카공화국은 막대한 풍력 자원을 활용하기 위해 국경을 넘는 송전망 연결을 계획하고 있습니다. 라틴아메리카는 브라질의 리우그란데두술 주와 칠레의 파타고니아 지역의 자원에서 혜택을 누리고 있지만, 그 잠재력을 최대한 발휘하기 위해서는 장거리 송전망에 대한 투자가 따라잡아야 합니다.
기타 혜택 :
- 엑셀 형식 시장 예측(ME) 시트
- 3개월간의 애널리스트 지원
자주 묻는 질문
목차
제1장 서론
제2장 조사 방법
제3장 주요 요약
제4장 시장 구도
제5장 시장 규모 및 성장 예측
제6장 경쟁 구도
제7장 시장 기회 및 향후 전망
KTH 26.06.29According to Mordor Intelligence, the wind power market size was valued at 1.27 Terra-watt in 2025 and estimated to grow from 1.4 Terra-watt in 2026 to reach 2.31 Terra-watt by 2031, at a CAGR of 10.52% during the forecast period (2026-2031).
This report is Segmented by Location (Onshore and Offshore), Turbine Capacity (Up To 3 MW, 3 To 6 MW, and Above 6 MW), Application (Utility-Scale, Commercial and Industrial, and Community Projects), and Geography (North America, Europe, Asia-Pacific, South America, and Middle East and Africa). The Market Sizes and Forecasts are Provided in Terms of Installed Capacity (GW).
Global Wind Power Market Trends and Insights
Rapid cost declines in >=15 MW turbines
Larger turbines cut foundation, cabling, and maintenance costs by 15-20% compared with smaller units, thereby lifting capacity factors by 8-12% at taller hub heights.(1)These economics allow developers to pursue sites that once sat at the margin of commercial viability and, in many offshore locations, to reach grid parity. Transportation bottlenecks created by 100-meter-plus blades persist, but port upgrades and heavy-lift vessel orders are underway, suggesting a short-lived constraint. The resulting capital-efficiency gain positions the wind power market for sustained cost competitiveness.
Surge in corporate PPAs from data-center operators
Major cloud providers are signing 10- to 20-year PPAs that bundle electricity with renewable energy certificates and 24/7 clean-energy matching guarantees. These contracts de-risk cash flows for new projects and encourage developers in the wind power industry to size wind farms around data-center load profiles, particularly near North Sea interconnectors and U.S. coastal grids. Electricity demand from artificial-intelligence workloads is expected to climb 35-50% by 2040, turning renewable procurement into an operational necessity rather than a CSR initiative.
Commodity price volatility (steel, rare-earths)
Steel makes up roughly 70% of turbine mass, and a 10% spot-price swing can nudge project capital expenditure by up to 3 percentage points Rare-earth magnets remain 70% sourced from China, so supply shocks in neodymium and dysprosium add further unpredictability. Some OEMs explore electrically excited generators to sidestep these metals, though the switch can trim efficiency by around 2%.(2)
Other drivers and restraints analyzed in the detailed report include:
- Inflation Reduction Act & EU wind power package
- Repowering of early-2000s onshore fleets
- Lengthy permitting timelines (>=5 yrs EU avg.)
For complete list of drivers and restraints, kindly check the Table Of Contents.
Segment Analysis
Onshore turbines held 92.45% of installed capacity in 2025, reflecting entrenched supply chains and quicker builds. Nevertheless, offshore assets post a 15.62% CAGR through 2031, due to stronger winds, fewer land-use conflicts, and the readiness of floating foundations. Japan's first barge-type floater proves commercial viability for typhoon-prone deep-water zones. With 16 MW machines now standard offshore, fewer turbines deliver the same megawatts, compressing installation timelines and lowering lifecycle costs. The wind power market thus tilts toward sea-based growth in land-scarce economies while onshore repowering drives gains in mature regions.
Emerging-economy developers favor onshore builds for lower capex and faster returns, but falling floating-foundation prices begin to level the field. As coastal grids upgrade, offshore output can smooth solar-driven daytime peaks and night-time dips, easing integration challenges.
Geography Analysis
Asia-Pacific dominated with 53.55% wind power market share of global capacity in 2025 and maintains an 11.42% CAGR to 2031. China alone added 76 GW in 2024, blending record onshore builds with a South China Sea offshore push. India's auction pipeline targets 140 GW by 2030, though state-level grid upgrades lag capacity growth. Japan and South Korea lean toward floating projects to sidestep land scarcity, and Vietnam eyes early-stage tenders that link wind to green-ammonia exports. The wind power market, therefore, benefits from integrated supply chains and government purchase guarantees across the region.
Europe anchors offshore innovation. The North Sea hosts 60% of installed offshore capacity, with Denmark and the Netherlands trimming permitting times via one-stop agencies. REPowerEU's local-content rules spur turbine factories in Spain, Poland, and France, while green-hydrogen pilot plants secure new offtake channels. Repowering across Germany, Denmark, and Spain adds capacity without new land, relying on upgraded 6 MW machines on existing pads.
North America sees mixed momentum. The January 2025 moratorium on new federal offshore leases stalls fresh acreage but does not affect active projects. Eighteen state attorneys general contest the ban, leaving a court-driven timeline for resolution. Onshore growth stays healthy in Midwestern grids, yet queue congestion in PJM and MISO regions stretches interconnection timelines. The Inflation Reduction Act still underpins project economics pending legislative clarity.
Middle East and Africa emerge as growth frontiers in the wind power market. Egypt's 10 GW build-own-operate deal and Morocco's hybrid wind-hydrogen hubs exemplify regional ambition. Namibia and South Africa plan cross-border grid links to tap their formidable wind corridors. Latin America benefits from Brazil's Rio Grande do Sul and Chile's Patagonia resources, yet long-haul transmission investment must catch up to exploit full potential.
- Acciona Energia
- Duke Energy
- EDF
- Orsted
- NextEra Energy
- E.ON
- Iberdrola
- Enel Green Power
- Pattern Energy
- Invenergy
- General Electric Vernova
- Vestas
- Siemens Gamesa
- Goldwind
- Envision Energy
- MingYang Smart Energy
- Suzlon
- Nordex
- Enercon
- Dongfang Electric
- CSIC Haizhuang
Additional Benefits:
- The market estimate (ME) sheet in Excel format
- 3 months of analyst support
TABLE OF CONTENTS
1 Introduction
- 1.1 Study Assumptions & Market Definition
- 1.2 Scope of the Study
2 Research Methodology
3 Executive Summary
4 Market Landscape
- 4.1 Market Overview
- 4.2 Market Drivers
- 4.2.1 Rapid cost declines in over 15 MW turbines
- 4.2.2 Surge in corporate PPAs from data-center operators
- 4.2.3 Inflation Reduction Act & EU Wind Power Package
- 4.2.4 Repowering of early 2000s onshore fleets
- 4.2.5 Maritime green-hydrogen off-take agreements
- 4.2.6 Rise of AI-enabled O&M drones
- 4.3 Market Restraints
- 4.3.1 Commodity price volatility (steel, rare-earths)
- 4.3.2 Lengthy permitting timelines (above 5 yrs EU avg.)
- 4.3.3 Grid interconnection queue congestion
- 4.3.4 Rising anti-whale litigation vs. offshore farms
- 4.4 Supply-Chain Analysis
- 4.5 Regulatory Landscape
- 4.6 Technological Outlook (floating foundations, 20 MW class)
- 4.7 Porters Five Forces
- 4.7.1 Bargaining Power of Suppliers
- 4.7.2 Bargaining Power of Buyers
- 4.7.3 Threat of New Entrants
- 4.7.4 Threat of Substitutes
- 4.7.5 Intensity of Competitive Rivalry
5 Market Size & Growth Forecasts
- 5.1 By Location
- 5.1.1 Onshore
- 5.1.2 Offshore
- 5.2 By Turbine Capacity
- 5.2.1 Up to 3 MW
- 5.2.2 3 to 6 MW
- 5.2.3 Above 6 MW
- 5.3 By Application
- 5.3.1 Utility-scale
- 5.3.2 Commercial and Industrial
- 5.3.3 Community Projects
- 5.4 By Component (Qualitative Analysis)
- 5.4.1 Nacelle/Turbine
- 5.4.2 Blade
- 5.4.3 Tower
- 5.4.4 Generator and Gearbox
- 5.4.5 Balance-of-System
- 5.5 By Geography
- 5.5.1 North America
- 5.5.1.1 United States
- 5.5.1.2 Canada
- 5.5.1.3 Mexico
- 5.5.2 Europe
- 5.5.2.1 Germany
- 5.5.2.2 Spain
- 5.5.2.3 United Kingdom
- 5.5.2.4 France
- 5.5.2.5 Norway
- 5.5.2.6 Turkey
- 5.5.2.7 Nordic (ex-Norway)
- 5.5.2.8 Russia
- 5.5.2.9 Rest of Europe
- 5.5.3 Asia Pacific
- 5.5.3.1 China
- 5.5.3.2 India
- 5.5.3.3 Japan
- 5.5.3.4 Vietnam
- 5.5.3.5 Indonesia
- 5.5.3.6 Malaysia
- 5.5.3.7 Thailand
- 5.5.3.8 Rest of Asia Pacific
- 5.5.4 South America
- 5.5.4.1 Brazil
- 5.5.4.2 Argentina
- 5.5.4.3 Chile
- 5.5.4.4 Colombia
- 5.5.4.5 Rest of South America
- 5.5.5 Middle East and Africa
- 5.5.5.1 Saudi Arabia
- 5.5.5.2 United Arab Emirates
- 5.5.5.3 Egypt
- 5.5.5.4 Nigeria
- 5.5.5.5 Qatar
- 5.5.5.6 Rest of Middle East & Africa
- 5.5.1 North America
6 Competitive Landscape
- 6.1 Market Concentration
- 6.2 Strategic Moves (M&A, Partnerships, PPAs)
- 6.3 Market Share Analysis (Market Rank/Share for key companies)
- 6.4 Company Profiles (includes Global level Overview, Market level overview, Core Segments, Financials as available, Strategic Information, Products & Services, and Recent Developments)
- 6.4.1 Acciona Energia
- 6.4.2 Duke Energy
- 6.4.3 EDF
- 6.4.4 Orsted
- 6.4.5 NextEra Energy
- 6.4.6 E.ON
- 6.4.7 Iberdrola
- 6.4.8 Enel Green Power
- 6.4.9 Pattern Energy
- 6.4.10 Invenergy
- 6.4.11 General Electric Vernova
- 6.4.12 Vestas
- 6.4.13 Siemens Gamesa
- 6.4.14 Goldwind
- 6.4.15 Envision Energy
- 6.4.16 MingYang Smart Energy
- 6.4.17 Suzlon
- 6.4.18 Nordex
- 6.4.19 Enercon
- 6.4.20 Dongfang Electric
- 6.4.21 CSIC Haizhuang
7 Market Opportunities & Future Outlook
- 7.1 White-space & Unmet-need Assessment


