
|
시장보고서
상품코드
2066594
아시아태평양의 소형 위성 시장 : 시장 점유율 분석, 업계 동향 및 통계, 성장 예측(2026-2031년)Asia-Pacific Small Satellite - Market Share Analysis, Industry Trends & Statistics, Growth Forecasts (2026 - 2031) |
||||||
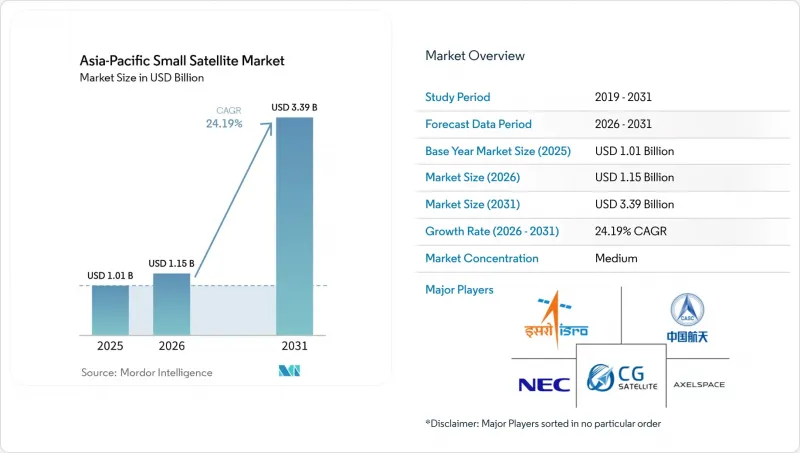
Mordor Intelligence에 의하면, 아시아태평양의 소형 위성 시장 규모는 2025년 10억 1,000만 달러로 평가되었고, 2026년에는 11억 5,000만 달러로 추정되고, 2026-2031년 CAGR 24.19%로 성장을 지속할 전망이며, 2031년에는 33억 9,000만 달러에 이를 것으로 예측됩니다.

본 보고서는 용도별(통신, 지구관측, 항법, 우주 관측, 기타), 궤도별(LEO, MEO, GEO), 최종 사용자별(민간, 정부·민간, 군사), 위성 질량별(펨토 위성, 피코 위성, 나노 위성 등), 지역별(중국, 인도, 일본, 한국 등)로 분류되어 있습니다. 시장 전망은 금액(달러) 기준으로 제시되어 있습니다.
아시아태평양의 소형 위성 시장 동향 및 인사이트
아시아태평양의 메가 콘스텔레이션 프로그램의 급속한 확대
중국의 발사 빈도는 새로운 단계에 접어들며, 아시아태평양의 소형 위성 시장을 재편하고 있습니다. 이 나라는 2025년에 92회의 궤도 발사를 기록했으며, 2026년에는 최대 140회의 발사를 목표로 하고 있으며, 그중 70회 이상은 국망(Guowang)과 천판(Qianfan)이 담당할 것으로 예측됩니다. 2026년 4월 현재, 국망(Guowang)은 ITU에 등록한 13,000기라는 목표에 비해 168기의 위성을 운용하고 있으며, 천판(Qianfan)은 승인된 15,000기 계획에 비해 126기의 위성을 궤도에 배치하고 있습니다. 이러한 규모 확대로 인해 지역 공급망은 부품, 통합 작업, 발사 서비스 분야에서 생산량 증대를 요구받고 있습니다. 또한, 단독 상업 수요만으로는 달성할 수 없었던 속도로 단가 하락이 진행되고 있어, 조달 방침이 여전히 현지 조달을 중시하는 경우에도 아시아태평양의 소형 위성 시장 구매자들에게는 하드웨어 접근성이 개선되고 있습니다.
정부 주도의 우주 이니셔티브에 대한 투자 확대
이 지역 전체적으로 정부 지출은 증가하고 있지만, 더 중요한 변화는 아시아태평양의 소형 위성 시장에서 조달 모델이 민간 기업에 의한 수행에 대해 점차 개방적으로 변하고 있다는 점입니다. 인도 우주국은 2026-27 회계연도 연방 예산에서 13,705.6 카롤 루피(16억 2,000만 달러)의 예산을 배정받았습니다. 이는 2025-26 회계연도 수정 예산인 12,448.6 카롤 루피(13억 달러)를 상회하는 금액이며, 자본 지출도 증가했습니다. 한국의 2026년도 우주 예산은 1조 2,000억 원(7억 9,000만 달러)에 달하며, 13개 부처에 걸친 42개 프로젝트에서 위성 정보를 활용하는 내용이 포함되어 있습니다. 이러한 예산 조치는 민간 기업이 공공 위탁을 받아 우주선을 제조하고, 탑재체를 공급하며, 데이터 서비스를 제공하는 혼합 실행 모델을 뒷받침하고 있습니다. 이를 통해 수익 전망이 개선되고, 조기 상용화의 위험이 완화되며, 아시아태평양 소형 위성 시장 전반에 걸친 국내 제조 역량이 강화될 것입니다.
LEO 대역 전체에 걸친 주파수 할당 부족 현상
주파수 대역에 대한 접근은 아시아태평양의 소형 위성 시장에서 가장 두드러진 구조적 제약 중 하나로 대두되고 있습니다. 2025년 12월, 중국은 ITU에 각각 96,714기로 구성된 2개의 추가 위성 네트워크에 관한 신청 서류를 제출했으며, 이에 따라 중국의 신규 신청 대상 위성 수는 총 약 20만 기에 달할 전망입니다. ScienceDirect에 게재된 2025년 분석에 따르면, LEO 위성군(Constellation)의 급속한 확장으로 인해 ITU 조정 모델의 중대한 한계가 드러나고 있으며, Ku 대역 및 Ka 대역에서는 이미 간섭 증가 문제에 직면해 있습니다. 그로 인해 소규모 사업자들은 신청 주기의 장기화, 조정 작업의 복잡화, 그리고 선점자들이 고가치 슬롯을 확보해 버릴 위험이 커지는 문제에 직면해 있습니다. 이러한 요인들이 복합적으로 작용하여, 아시아태평양의 소형 위성 시장 전반에 걸쳐 전개 계획의 지연이나 상업적 유연성의 저하를 초래할 가능성이 있습니다.
부문별 분석
2025년 기준으로 아시아태평양의 소형 위성 시장 점유율 중 42.25%를 통신 분야가 차지한 반면, 지구관측 분야는 2031년까지 연평균 성장률(CAGR) 25.78%로 확대될 것으로 전망됩니다. 메가 콘스텔레이션의 구축, IoT에 중점을 둔 네트워크, 그리고 데이터 중계 수요가 현재 가장 광범위한 수요를 지속적으로 견인하고 있기 때문에 통신은 여전히 가장 큰 용도로 자리 잡고 있습니다. 지구관측 분야의 성장이 가속화되고 있는 것은 지역 구매자들이 정기적인 이미지 획득 이상의 것을 요구하게 되면서, 보다 신속한 분석과 지속적인 감시를 가능하게 하는 시스템으로 지출을 전환하고 있기 때문입니다. 이로 인해 아시아태평양의 소형 위성 시장 전반에서 사업자들이 페이로드 구성, 재방문 전략 및 다운스트림 서비스를 설계하는 방식에 변화가 일어나고 있습니다.
지구관측 시장의 기회는 단순한 외부 위탁을 통한 접근에 그치지 않고, 자국의 관측 역량 구축을 목표로 하는 공공 프로그램에 의해 뒷받침되고 있습니다. Pixxel이 2026년에 IN-SPACe와 체결한 계약에 따르면, 광학, 다중 스펙트럼, SAR, 하이퍼스펙트럼 시스템을 단일 국가 위성군으로 통합하고 있으며, 이는 단순한 영상 촬영 범위 확보에 그치지 않는 보다 광범위한 조달 목표를 시사하고 있습니다. 또한, 각국이 소비자용 및 전략적 용도를 위해 위치 및 시간 제공 능력을 보완하거나 현지화하려는 움직임을 보이고 있어, 내비게이션 수요도 증가하고 있습니다. 우주 관측 및 기타 용도는 여전히 규모는 작지만, 아시아태평양의 소형 위성 산업에서 과학 임무, 학술 프로그램 및 초기 단계의 기술 실증에 있어 여전히 중요한 역할을 하고 있습니다.
2025년 아시아태평양의 소형 위성 시장에서 LEO는 매출의 51.75%를 차지했으며, 현재 통신, 지구관측, IoT 임무 분야에서 주요 운용 궤도로 자리 잡고 있습니다. 이러한 우위는 발사에 필요한 에너지가 적고, 신호 지연 시간이 짧으며, 빈번한 재방문과 지속적인 네트워크 확장이 필요한 위성군 아키텍처와의 높은 호환성에서 기인합니다. MEO는 사업자들이 LEO와 GEO의 중간 지점에 위치한 항법 보강 및 중지연 서비스를 모색하고 있는 만큼, 2031년까지 연평균 성장률(CAGR) 25.83%를 기록하며 성장할 것으로 전망됩니다. GEO는 여전히 특정 방송 및 VSAT 이용 사례에 대응하고 있지만, 높은 처리량을 자랑하는 LEO 위성 시스템으로부터의 경쟁 압력은 점점 더 커지고 있습니다. 일본의 NICT는 2025년 12월, 소형 위성 탑재형 단말기를 이용하여 세계 최초로 2 Tbit/s의 자유 공간 광통신 실증에 성공했습니다. 이는 아시아태평양의 소형 위성 시장이 성숙해짐에 따라, 지역 네트워크 간의 데이터 전송을 개선할 수 있는 다궤도 광중계 시스템의 유효성을 입증하는 것입니다. 이러한 진전이 있기는 하지만, 지속적인 커버리지가 요구되기 때문에 아시아태평양의 소형 위성 업계에서는 수요의 일부가 여전히 GEO 및 혼합 궤도 아키텍처에 의존하게 될 것입니다.
기타 혜택 :
- 엑셀 형식 시장 예측(ME) 시트
- 3개월간의 애널리스트 지원
자주 묻는 질문
목차
제1장 서론
제2장 조사 방법
제3장 주요 요약
제4장 시장 구도
제5장 시장 규모 및 성장 예측
제6장 경쟁 구도
제7장 시장 기회 및 향후 전망
AJY 26.06.30According to Mordor Intelligence, the asia-Pacific small satellite market size is projected to grow from USD 1.01 billion in 2025 to USD 1.15 billion in 2026 and is forecast to reach USD 3.39 billion by 2031 at 24.19% CAGR over 2026-2031.
This report is Segmented by Application (Communication, Earth Observation, Navigation, Space Observation, and Others), Orbit (LEO, MEO, and GEO), End-User (Commercial, Government and Civil, and Military), Satellite Mass (Femtosatellites, Picosatellites, Nanosatellites, and More), and Geography (China, India, Japan, South Korea, and More). The Market Forecasts are Provided in Terms of Value (USD).
Asia-Pacific Small Satellite Market Trends and Insights
Rapid Expansion of Mega-Constellation Programs Across Asia-Pacific
China's launch cadence has entered a new scale phase, reshaping the Asia-Pacific small satellite market. The country recorded 92 orbital launches in 2025 and is targeting as many as 140 launches in 2026, with Guowang and Qianfan expected to use 70 or more of those missions. By April 2026, Guowang had 168 operational satellites against a 13,000-satellite ITU-filed target, while Qianfan had 126 satellites in orbit against a 15,000-satellite approved plan. That scale is pushing the regional supply chain toward higher output in components, integration work, and launch services. It is also lowering unit costs faster than standalone commercial demand would have, improving hardware access for buyers across the Asia-Pacific small satellite market, even when procurement policy still leans toward local sourcing.
Increasing Investments in Government-Led Space Initiatives
Government spending is rising across the region, but the more important shift is that procurement models are becoming more open to private execution in the Asia-Pacific small satellite market. India's Department of Space received INR 13,705.6 crore (USD 1.62 billion) in the FY2026-27 Union Budget, above the revised FY2025-26 level of INR 12,448.6 crore (USD 1.30 billion), and capital expenditure also moved higher. South Korea's 2026 space budget reached KRW 1.2 trillion (USD 790 million) and included satellite information utilization across 42 projects in 13 ministries. These budget decisions are supporting mixed execution models in which private firms build spacecraft, supply payloads, and deliver data services under public mandates. That improves revenue visibility, reduces early commercialization risk, and strengthens domestic manufacturing capacity across the Asia-Pacific small satellite market.
Increasing Spectrum Allocation Congestion Across LEO Bands
Spectrum access is becoming one of the clearest structural constraints on the Asia-Pacific small satellite market. In December 2025, China filed ITU paperwork for 2 additional satellite networks, each comprising 96,714 satellites, bringing potential new Chinese filings to nearly 200,000 satellites. A 2025 analysis published in ScienceDirect found that rapid expansion of LEO constellations is exposing major limitations in the ITU coordination model, with the Ku and Ka bands already facing increasing interference. Smaller operators, therefore, face longer filing cycles, more complex coordination work, and a greater risk that early movers secure high-value slots. That combination can delay deployment plans and reduce commercial flexibility across the Asia-Pacific small satellite market.
Other drivers and restraints analyzed in the detailed report include:
- Declining Launch Costs Driven by Regional Small-Lift Providers
- Growing Demand for Real-Time Earth Observation Analytics
- Rising Costs of Orbital Debris Mitigation Compliance
For complete list of drivers and restraints, kindly check the Table Of Contents.
Segment Analysis
Communication accounted for 42.25% of the Asia-Pacific small satellite market share in 2025, while Earth observation is projected to expand at 25.78% CAGR through 2031. Communication remains the largest application because mega-constellation deployment, IoT-focused networks, and data relay needs continue to drive the broadest current demand. Earth observation is growing faster because regional buyers now want more than periodic imagery and are shifting spending toward systems that can support faster analysis and more continuous monitoring, changing how operators design payload mixes, revisit strategies, and downstream services across the Asia-Pacific small satellite market.
The Earth observation opportunity is being reinforced by public programs that seek sovereign sensing capability rather than outsourced access alone. Pixxel's 2026 agreement with IN-SPACe combines optical, multispectral, SAR, and hyperspectral systems into a single national constellation, pointing to broader procurement goals than just imaging coverage. Navigation demand is also rising as countries look to supplement or localize positioning and timing capacity for civilian and strategic uses. Space observation and other applications remain smaller, but they still matter for scientific missions, academic programs, and early-stage technology demonstration within the Asia-Pacific small satellite industry.
LEO accounted for 51.75% of revenue in the Asia-Pacific small satellite market in 2025, making it the primary deployment layer for current communication, Earth observation, and IoT missions. Its lead reflects lower launch energy needs, shorter signal latency, and a stronger fit with constellation architectures that require frequent revisit or continuous network growth. MEO is forecast to grow at a 25.83% CAGR through 2031 as operators seek navigation augmentation and medium-latency services that sit between LEO and GEO. GEO still serves selected broadcast and VSAT use cases, but competitive pressure from higher-throughput LEO satellite systems is increasing. Japan's NICT achieved the world's first demonstration of 2 Tbit/s free-space optical communication in December 2025, using small-satellite-mountable terminals, supporting the case for multi-orbit optical relay systems that can improve data transfer across regional networks as the Asia-Pacific small satellite market matures. Even with that progress, continuous-zone coverage requirements will keep part of the demand anchored in GEO and in mixed-orbit architectures across the Asia-Pacific small satellite industry.
List of Companies Covered in this Report:
- Chang Guang Satellite Technology Co. Ltd.
- Indian Space Research Organisation
- ICEYE Oy
- Pixxel Space Technologies, Inc.
- China Aerospace Science and Technology Corporation
- NewSpace India Limited
- Planet Labs PBC
- Blue Canyon Technologies LLC (RTX Corporation)
- Spire Global, Inc.
- Axelspace Corporation
- Satrec Initiative Co., Ltd.
- Dhruva Space Private Limited
- UAB Kongsberg NanoAvionics (Kongsberg Gruppen ASA)
- Airbus SE
- GalaxySpace
- NEC Space Technologies, Ltd.
Additional Benefits:
- The market estimate (ME) sheet in Excel format
- 3 months of analyst support
TABLE OF CONTENTS
1 INTRODUCTION
- 1.1 Study Assumptions and Market Definition
- 1.2 Scope of the Study
2 RESEARCH METHODOLOGY
3 EXECUTIVE SUMMARY
4 MARKET LANDSCAPE
- 4.1 Market Overview
- 4.2 Market Drivers
- 4.2.1 Rapid expansion of mega-constellation programs across Asia-Pacific
- 4.2.2 Increasing investments in government-led space initiatives
- 4.2.3 Declining launch costs driven by regional small-lift providers
- 4.2.4 Growing demand for real-time Earth-observation analytics
- 4.2.5 Rising adoption of CubeSat-based IoT connectivity networks
- 4.2.6 Increasing integration of optical relay systems with 5G NTN infrastructure
- 4.3 Market Restraints
- 4.3.1 Increasing spectrum allocation congestion across LEO bands
- 4.3.2 Rising costs of orbital debris mitigation compliance
- 4.3.3 Limited availability of on-orbit servicing infrastructure in Asia-Pacific
- 4.3.4 Export control restrictions on advanced satellite technologies and components
- 4.4 Value Chain Analysis
- 4.5 Regulatory Landscape
- 4.6 Technological Outlook
- 4.7 Porter's Five Forces Analysis
- 4.7.1 Bargaining Power of Suppliers
- 4.7.2 Bargaining Power of Buyers/Consumers
- 4.7.3 Threat of New Entrants
- 4.7.4 Threat of Substitutes
- 4.7.5 Intensity of Competitive Rivalry
5 MARKET SIZE AND GROWTH FORECASTS (VALUE)
- 5.1 By Application
- 5.1.1 Communication
- 5.1.2 Earth Observation
- 5.1.3 Navigation
- 5.1.4 Space Observation
- 5.1.5 Others
- 5.2 By Orbit
- 5.2.1 Low Earth Orbit (LEO)
- 5.2.2 Medium Earth Orbit (MEO)
- 5.2.3 Geostationary Orbit (GEO)
- 5.3 By End-User
- 5.3.1 Commercial
- 5.3.2 Government and Civil
- 5.3.3 Military
- 5.4 By Satellite Mass
- 5.4.1 Femtosatellites
- 5.4.2 Picosatellites
- 5.4.3 Nanosatellites
- 5.4.4 Microsatellites
- 5.4.5 Minisatellites
- 5.5 By Geography
- 5.5.1 China
- 5.5.2 Japan
- 5.5.3 India
- 5.5.4 South Korea
- 5.5.5 Australia
- 5.5.6 Rest of Asia-Pacific
6 COMPETITIVE LANDSCAPE
- 6.1 Market Concentration
- 6.2 Strategic Moves
- 6.3 Market Share Analysis
- 6.4 Company Profiles (includes Global level Overview, Market level overview, Core Segments, Financials, Strategic Information, Market Rank/Share, Products and Services, and Recent Developments)
- 6.4.1 Chang Guang Satellite Technology Co. Ltd.
- 6.4.2 Indian Space Research Organisation
- 6.4.3 ICEYE Oy
- 6.4.4 Pixxel Space Technologies, Inc.
- 6.4.5 China Aerospace Science and Technology Corporation
- 6.4.6 NewSpace India Limited
- 6.4.7 Planet Labs PBC
- 6.4.8 Blue Canyon Technologies LLC (RTX Corporation)
- 6.4.9 Spire Global, Inc.
- 6.4.10 Axelspace Corporation
- 6.4.11 Satrec Initiative Co., Ltd.
- 6.4.12 Dhruva Space Private Limited
- 6.4.13 UAB Kongsberg NanoAvionics (Kongsberg Gruppen ASA)
- 6.4.14 Airbus SE
- 6.4.15 GalaxySpace
- 6.4.16 NEC Space Technologies, Ltd.
7 MARKET OPPORTUNITIES AND FUTURE OUTLOOK
- 7.1 White-space and Unmet-need Assessment
