
|
시장보고서
상품코드
2066655
배터리 셀 : 시장 점유율 분석, 업계 동향 및 통계, 성장 예측(2026-2031년)Battery Cell - Market Share Analysis, Industry Trends & Statistics, Growth Forecasts (2026 - 2031) |
||||||
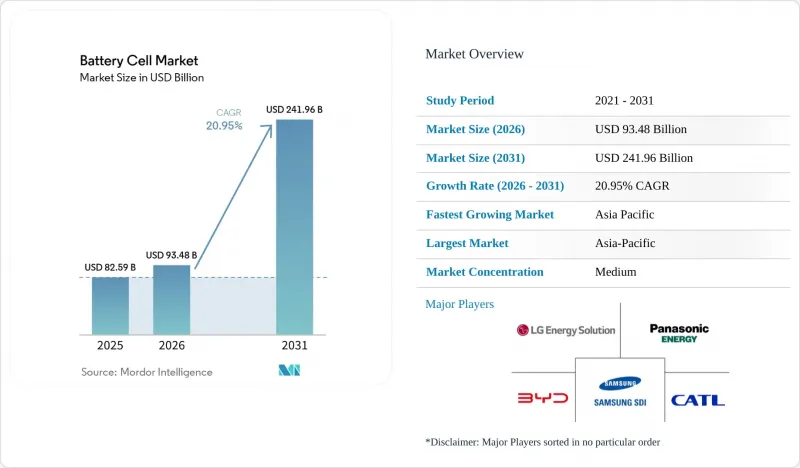
Mordor Intelligence에 의하면, 배터리 셀 시장 규모는 2025년 825억 9,000만 달러로 평가되었습니다. 2026년 934억 8,000만 달러에서 2031년까지 2,419억 6,000만 달러에 이를 것으로 예상되며 2026년부터 2031년까지 연평균 복합 성장률(CAGR)은 20.95%를 나타낼 전망입니다.

본 보고서는 형태(프리즘형, 원통형, 파우치형, 코인형 및 버튼형), 화학 조성(리튬 이온 NMC, 리튬 이온 LFP, 리튬 이온 NCA, 리튬 이온 LMO/LCO, 전고체, 나트륨 이온 및 기타 신기술), 용도(자동차, 에너지 저장, 소비자용 전자기기 및 웨어러블, 전동 공구 및 원예 기기, SLI 및 마이크로모빌리티), 지역(북미, 유럽, 아시아태평양, 기타)별로 분류되어 있습니다.
세계의 배터리 셀 시장 동향 및 인사이트
EV 생산의 급증과 정부의 전동화 의무화
2024년, 전 세계 전기자동차(EV) 생산 대수는 1,400만 대를 돌파했으며, 캘리포니아주, EU, 중국의 규제 조치에 따라 내연기관 차량의 단계적 폐지가 2035년 또는 그 이전으로 앞당겨지고 있습니다. 미국의 ‘인플레이션 억제법(Inflation Reduction Act)’은 7,500달러의 소비자 세액 공제를 무역 협정 체결국으로부터의 배터리 부품 조달과 연계하고 있으며, 이를 통해 배터리 셀 조달이 국내 또는 동맹국공급업체로 유도되고 있습니다. 유럽에서는 2025년 차량 평균 CO2 배출량 상한선이 93.6 g/km로 설정되었으며, 독일의 보조금 폐지로 인해 2024년 초 플러그인 하이브리드 차량 등록 대수가 27% 감소했음에도 불구하고, 유서 깊은 제조업체들은 배터리식 전기자동차 출시를 가속화할 수밖에 없는 상황입니다. 중국은 신에너지차에 대한 구매세 면제 조치를 2027년까지 연장하여 전 세계 전기자동차 수요의 약 절반을 뒷받침하고 있습니다. 인센티브의 차이로 인해 배터리의 화학적 조성도 양극화되고 있습니다. 서유럽 자동차 제조업체들은 장거리 주행용 모델에 고니켈 배터리를 선호하는 반면, 중국의 2선 도시에서는 1kWh당 80달러 미만의 리튬철인산염 배터리 팩이 채택되고 있습니다.
유틸리티 규모의 에너지 저장 수요 증가
재생에너지 도입 의무와 부대 서비스 수익이 프로젝트의 경제성을 높인 결과, 2024년에는 그리드급 배터리용량이 누적 50 GWh를 돌파했습니다. 캘리포니아주 모스 랜딩 발전소는 2024년 1월 발생한 열 현상에 대응하여 3 GWh로 확장되었으며, 이는 운영사가 안전 프로토콜 강화에 대한 신뢰를 보여주고 있습니다. 장주기 에너지 저장(LDES) 협의회(LDESC)는 2040년까지 1.5 TWh가 도입될 것으로 예측하고 있으며, 이는 30배에 달하는 급증에 해당하므로, 배터리 화학 설계의 초점은 1만 사이클의 내구성으로 옮겨가고 있습니다. ERCOT는 2024년에 4GW를 추가하며, 1 MWh당 5,000달러를 초과하는 피크 시간대 가격 급등을 수익으로 전환하는 동시에, 보조금 없이도 자금 조달이 가능한 현금 흐름을 창출했습니다. 호주의 대규모 배터리 군은 현재 재생에너지 도입률이 60% 이상의 수준에서 통합되어 있으며, 고정형 용도에서 인산철 리튬 배터리의 우월성이 입증되고 있습니다.
중요 광물공급 변동과 가격 급등
리튬 탄산염 가격은 2022년 말부터 2024년 말까지 87% 급락하면서, 수익성을 확보하지 못한 광산 회사들이 도산했고, 계획되었던 30만 톤 규모의 생산 능력 확대가 연기되었습니다. 코발트 가격은 2024년에 40% 하락했으나, 공급량의 70%가 콩고민주공화국에 집중되어 있어 지정학적 위험은 여전히 남아 있습니다. 인도네시아의 라테라이트 광산 확장으로 인해, 배터리 양극재로 사용하기 부적합한 저품위 금속이 시장에 유입되면서 클래스 1 니켈의 프리미엄 폭이 축소되었습니다. 포드가 2024년 미시간주에서 생산될 픽업트럭을 위해 CATL과 리튬철인산염 배터리 라이선스 계약을 체결한 것은 에너지 밀도가 15% 낮아지더라도 각 OEM 업체들이 니켈 의존에서 벗어나려 하고 있음을 여실히 보여주고 있습니다. 고니켈 프리미엄 차량과 철인산염을 채택한 양산 모델 간의 양극화로 인해 양극재 조달 시장은 세분화되고 있으며, 헤지 전략도 복잡해지고 있습니다.
부문별 분석
2025년에는 이미 자리 잡은 18650/2170 시리즈와 테슬라의 4680의 양산 확대에 힘입어, 원통형 셀이 53.5%의 점유율로 배터리 셀 시장을 독점했습니다. 한편, 자동차 제조업체들이 모듈리스 팩 설계를 채택함에 따라 파우치형은 2031년까지 연평균 성장률(CAGR) 25.8%를 나타낼 것으로 전망됩니다. 셀-투-섀시 구조로 인해 부피 효율이 향상되고 차량 중량이 경감됨에 따라, 파우치형 배터리 셀 시장 규모는 2031년까지 3배 이상으로 확대될 것으로 전망됩니다.
이러한 구조적 장점은 BYD의 ‘블레이드 배터리’를 통해 입증되고 있습니다. 이 배터리는 2024년형 세단 ‘Seal’의 섀시에 직접 통합되었으며, 동급의 원통형 배터리에 비해 팩 용량을 20% 줄이면서도 600km의 주행 거리를 실현했습니다. 유럽의 자동차 제조업체들도 이에 발맞추고 있습니다. 폭스바겐의 ‘유나이파이드 셀’ 계획은 당초 노스볼트사의 대형 파우치형 배터리 로드맵에 의존하고 있었으나, 해당 공급업체가 2024년에 파산함에 따라 유럽에서의 상용화는 최소 18개월 연기되었습니다. 내구성에 대한 우려는 여전히 남아 있습니다. 유연한 알루미늄 라미네이트 케이스는 사용 횟수가 많을 경우 팽창할 가능성이 있어, 3,000회 이상의 사용 횟수가 요구되는 상용차 차량군에의 채택이 제한되고 있습니다. 또한, EU 배터리 규정에 따른 ‘쉬운 분해’에 관한 규제 요건 역시 2027년 이후 유럽 내 파우치형 배터리의 보급을 저해할 가능성이 있어, 원통형 및 각형 배터리의 역할은 앞으로도 유지될 전망입니다.
지역별 분석
아시아태평양은 2025년 배터리 셀 시장에서 52.8%라는 압도적인 점유율을 유지했으며, 중국이 전 세계 생산 능력의 75%를 차지하고 동남아시아가 니켈 및 양극재 정제 규모를 확대하고 있는 만큼, 2031년까지 연평균 성장률(CAGR) 25.2%를 나타낼 것으로 예측됩니다. CATL의 120 GWh 규모 푸딩(Fuding) 공장은 해당 지역의 규모적 우위를 상징하는 반면, 이 회사의 100 GWh 규모 헝가리 프로젝트는 현지 조달 규정에 따라 관세 없이 유럽 시장에 진출할 수 있게 해줍니다.
북미에서는 2024년부터 2026년까지의 생산 능력 계획이 100GWh를 넘어섰으며, LG-혼다, 삼성-스텔란티스, 파나소닉이 주도하는 확장 사업이 진행 중입니다. 이를 통해 kWh당 35달러의 ‘첨단 제조 생산 크레딧(AMPC)’을 획득할 수 있게 됩니다. 유럽에서는 1 TWh를 초과하는 규모의 공장 건설 계획이 발표되고 있지만, 노스볼트(Northvolt)사의 연방 파산법 제11장 신청과 ACC사의 드브랑(Douvrain) 공장 건설 지연은 수직 통합된 공급망을 갖추지 못한 신규 진출기업들이 직면한 실행 위험을 여실히 드러내고 있습니다.
남미는 현재 시장 점유율이 3% 미만에 그치고 있으며, 배터리 생산보다는 리튬 채굴에 중점을 두고 있습니다. 한편, 중동 및 아프리카는 송전망의 제약과 자금 조달의 어려움으로 인해 여전히 초기 단계 수요 거점에 머물러 있습니다. 일본과 한국은 수출 중심 모델에서 지역 생산으로의 전환을 추진하고 있으며, 미국의 IRA(인플레이션 억제법)가 정한 국내 조달률 기준을 충족하고, 치솟는 운송 비용을 줄이는 것을 목표로 하고 있습니다.
기타 혜택 :
- 엑셀 형식 시장 예측(ME) 시트
- 3개월간의 애널리스트 지원
자주 묻는 질문
목차
제1장 서론
제2장 조사 방법
제3장 주요 요약
제4장 시장 구도
제5장 시장 규모 및 성장 예측
제6장 경쟁 구도
제7장 시장 기회 및 향후 전망
KTH 26.06.29According to Mordor Intelligence, the battery cell market size is projected to expand from USD 82.59 billion in 2025 and USD 93.48 billion in 2026 to USD 241.96 billion by 2031, registering a CAGR of 20.95% between 2026 to 2031.
This report is Segmented by Form Factor (Prismatic, Cylindrical, Pouch, and Coin and Button), Chemistry (Li-Ion NMC, Li-Ion LFP, Li-Ion NCA, Li-Ion LMO/LCO, Solid-State, and Sodium-Ion and Other Emerging), Application (Automotive, Energy-Storage, Consumer Electronics and Wearables, Power Tools and Gardening Equipment, and SLI and Micro-Mobility), and Geography (North America, Europe, Asia-Pacific, and More).
Global Battery Cell Market Trends and Insights
Surging EV Production And Government Electrification Mandates
Global electric-vehicle output crossed 14 million units in 2024, and regulations in California, the EU, and China are compressing internal-combustion phase-outs to 2035 or earlier. The U.S. Inflation Reduction Act links a USD 7,500 consumer credit to battery-component sourcing from trade-agreement partners, steering cell procurement toward domestic or allied suppliers. Europe's fleet-average CO2 cap of 93.6 g/km for 2025 is forcing legacy brands to accelerate battery-electric launches even after Germany's subsidy withdrawal caused a 27% drop in early-2024 plug-in registrations. China extended its purchase-tax exemption for new-energy vehicles through 2027, underpinning roughly half of global EV demand. Divergent incentives are bifurcating chemistries: Western OEMs favor high-nickel cells for long-range models, whereas China's tier-2 cities adopt lithium-iron-phosphate packs priced under USD 80/kWh.
Utility-Scale Energy-Storage Demand Growth
Grid-scale battery capacity surpassed 50 GWh cumulatively in 2024 as renewable-penetration mandates and ancillary-service revenues lifted project economics. California's Moss Landing site expanded to 3 GWh after a January 2024 thermal event, signaling operator confidence in enhanced safety protocols. The Long Duration Energy Storage Council foresees 1.5 TWh installed by 2040, a 30-fold jump that pivots chemistry design toward 10,000-cycle durability. ERCOT added 4 GW in 2024, monetizing peak-hour price spikes above USD 5,000/MWh and creating financeable cash flows without subsidies. Australia's big-battery fleet now integrates renewables at penetration rates topping 60%, validating lithium-iron-phosphate dominance in stationary settings.
Critical-Mineral Supply Volatility And Price Spikes
Lithium-carbonate prices plunged 87% between late 2022 and late 2024, bankrupting marginal miners and delaying 300,000 t of planned capacity. Cobalt fell 40% in 2024, yet its 70% supply concentration in the Democratic Republic of Congo sustains geopolitical risk. Class-1 nickel premiums tightened as Indonesian laterite expansions added low-grade metal unsuited to battery cathodes. Ford's 2024 deal to license CATL lithium-iron-phosphate cells for Michigan-built pickups highlights OEM pivoting away from nickel dependency despite a 15% energy-density hit. The split between high-nickel premium cars and iron-phosphate mass models is fragmenting cathode procurement and complicating hedging strategies.
Other drivers and restraints analyzed in the detailed report include:
- Declining $/kWh From Giga-Scale Production Learning Curves
- Adoption Of 4680-Class Cylindrical And Large-Format Prismatic Cells
- Fire-Safety Incidents Triggering Tighter Regulations
For complete list of drivers and restraints, kindly check the Table Of Contents.
Segment Analysis
Cylindrical cells dominated the battery cell market with a 53.5% share in 2025, propelled by entrenched 18650/2170 lines and Tesla's 4680 ramp, while pouch formats are forecast to register a 25.8% CAGR to 2031 as automakers adopt module-less pack designs. The battery cell market size for pouch designs is set to more than triple by 2031 as cell-to-chassis architectures boost volumetric efficiency and shave vehicle curb weight.
The structural benefits are underscored by BYD's Blade battery, which is integrated directly into the chassis of the 2024 Seal sedan, achieving a 600 km range with 20% less pack capacity than cylindrical equivalents. European OEMs are following suit; Volkswagen's unified-cell plan originally banked on Northvolt's large pouch roadmap, although the supplier's 2024 bankruptcy has deferred European commercialization by at least 18 months. Durability concerns persist: flexible aluminum-laminate casings can swell under high-cycle duty, limiting adoption for commercial fleets that demand 3,000-plus cycles. Regulatory requirements for easy disassembly under the EU Battery Regulation could also temper pouch uptake in Europe post-2027, preserving a role for cylindrical and prismatic formats.
Geography Analysis
Asia-Pacific maintained a commanding 52.8% share of the battery cell market in 2025 and is expected to post a 25.2% CAGR through 2031 as China sustains 75% of global manufacturing capacity and Southeast Asia scales nickel and cathode refining. CATL's 120 GWh Fuding site exemplifies the region's scale advantage, while its 100 GWh Hungary project enables tariff-free European access under local-content rules.
North America's capacity pipeline exceeds 100 GWh between 2024-2026, led by LG-Honda, Samsung-Stellantis, and Panasonic expansions that unlock USD 35/kWh Advanced Manufacturing Production Credits. Europe has announced more than 1 TWh of prospective plants, but Northvolt's Chapter 11 filing and ACC's delays at Douvrin highlight execution risk for green-field entrants without vertically integrated supply chains.
South America presently holds under 3% share, focusing on lithium extraction rather than cell output, while the Middle East and Africa remain early-stage demand centers limited by grid constraints and financing hurdles. Japan and South Korea are pivoting from export-only models toward regional production to satisfy U.S. IRA domestic-content thresholds and mitigate rising freight costs.
- Contemporary Amperex Technology (CATL)
- LG Energy Solution
- BYD Co Ltd
- Panasonic Energy
- Samsung SDI
- SK On
- Envision AESC
- CALB Co Ltd
- Gotion High-Tech
- EVE Energy
- Northvolt AB
- SVOLT Energy
- Farasis Energy
- Sunwoda Electronic
- Murata Manufacturing
- VARTA AG
- EnerSys
- Duracell
- Microvast
- A123 Systems
- Amprius Technologies
- Solid Power
- QuantumScape
- ProLogium Technology
Additional Benefits:
- The market estimate (ME) sheet in Excel format
- 3 months of analyst support
TABLE OF CONTENTS
1 Introduction
- 1.1 Study Assumptions & Market Definition
- 1.2 Scope of the Study
2 Research Methodology
3 Executive Summary
4 Market Landscape
- 4.1 Market Drivers
- 4.1.1 Surging EV production & government electrification mandates
- 4.1.2 Utility-scale energy-storage demand growth
- 4.1.3 Declining $/kWh from giga-scale production learning curves
- 4.1.4 Adoption of 4680?class cylindrical & large-format prismatic cells
- 4.1.5 Gigafactory build-out accelerated by IRA & EU battery regulations
- 4.1.6 Commercialization of sodium-ion cells for low-cost mobility & ESS
- 4.2 Market Restraints
- 4.2.1 Critical-mineral supply volatility & price spikes
- 4.2.2 Fire-safety incidents triggering tighter regulations
- 4.2.3 Global over-capacity driving severe price competition
- 4.2.4 EV-subsidy roll-off & policy uncertainty dampening demand
- 4.3 Supply-Chain Analysis
- 4.4 Regulatory Landscape
- 4.5 Technological Outlook
- 4.6 Porter's Five Forces
- 4.6.1 Bargaining Power of Suppliers
- 4.6.2 Bargaining Power of Consumers
- 4.6.3 Threat of New Entrants
- 4.6.4 Threat of Substitutes
- 4.6.5 Intensity of Competitive Rivalry
5 Market Size & Growth Forecasts
- 5.1 By Form Factor
- 5.1.1 Prismatic
- 5.1.2 Cylindrical
- 5.1.3 Pouch
- 5.1.4 Coin and Button
- 5.2 By Chemistry
- 5.2.1 Li-ion NMC
- 5.2.2 Li-ion LFP
- 5.2.3 Li-ion NCA
- 5.2.4 Li-ion LMO/LCO
- 5.2.5 Solid-state (Semi- and All-solid)
- 5.2.6 Sodium-ion and Other Emerging
- 5.3 By Application
- 5.3.1 Automotive (BEV, PHEV, HEV)
- 5.3.2 Energy-Storage (Utility, C&I, Residential)
- 5.3.3 Consumer Electronics and Wearables
- 5.3.4 Power Tools and Gardening Equipment
- 5.3.5 SLI and Micro-mobility (e-bikes, scooters)
- 5.4 By Geography
- 5.4.1 North America
- 5.4.1.1 United States
- 5.4.1.2 Canada
- 5.4.1.3 Mexico
- 5.4.2 Europe
- 5.4.2.1 United Kingdom
- 5.4.2.2 Germany
- 5.4.2.3 France
- 5.4.2.4 Spain
- 5.4.2.5 NORDIC Countries
- 5.4.2.6 Russia
- 5.4.2.7 Rest of Europe
- 5.4.3 Asia-Pacific
- 5.4.3.1 China
- 5.4.3.2 India
- 5.4.3.3 Japan
- 5.4.3.4 South Korea
- 5.4.3.5 ASEAN Countries
- 5.4.3.6 Australia and New Zealand
- 5.4.3.7 Rest of Asia-Pacific
- 5.4.4 South America
- 5.4.4.1 Brazil
- 5.4.4.2 Argentina
- 5.4.4.3 Colombia
- 5.4.4.4 Rest of South America
- 5.4.5 Middle East and Africa
- 5.4.5.1 Saudi Arabia
- 5.4.5.2 United Arab Emirates
- 5.4.5.3 South Africa
- 5.4.5.4 Egypt
- 5.4.5.5 Rest of Middle East and Africa
- 5.4.1 North America
6 Competitive Landscape
- 6.1 Market Concentration
- 6.2 Strategic Moves (M&A, Partnerships, PPAs)
- 6.3 Market Share Analysis (Market Rank/Share for key companies)
- 6.4 Company Profiles (includes Global level Overview, Market level overview, Core Segments, Financials as available, Strategic Information, Products & Services, and Recent Developments)
- 6.4.1 Contemporary Amperex Technology (CATL)
- 6.4.2 LG Energy Solution
- 6.4.3 BYD Co Ltd
- 6.4.4 Panasonic Energy
- 6.4.5 Samsung SDI
- 6.4.6 SK On
- 6.4.7 Envision AESC
- 6.4.8 CALB Co Ltd
- 6.4.9 Gotion High-Tech
- 6.4.10 EVE Energy
- 6.4.11 Northvolt AB
- 6.4.12 SVOLT Energy
- 6.4.13 Farasis Energy
- 6.4.14 Sunwoda Electronic
- 6.4.15 Murata Manufacturing
- 6.4.16 VARTA AG
- 6.4.17 EnerSys
- 6.4.18 Duracell
- 6.4.19 Microvast
- 6.4.20 A123 Systems
- 6.4.21 Amprius Technologies
- 6.4.22 Solid Power
- 6.4.23 QuantumScape
- 6.4.24 ProLogium Technology
7 Market Opportunities & Future Outlook
- 7.1 White-space & Unmet-need Assessment
