
|
시장보고서
상품코드
2072531
이벤트 물류 : 시장 점유율 분석, 업계 동향 및 통계, 성장 예측(2026-2031년)Event Logistics - Market Share Analysis, Industry Trends & Statistics, Growth Forecasts (2026 - 2031) |
||||||
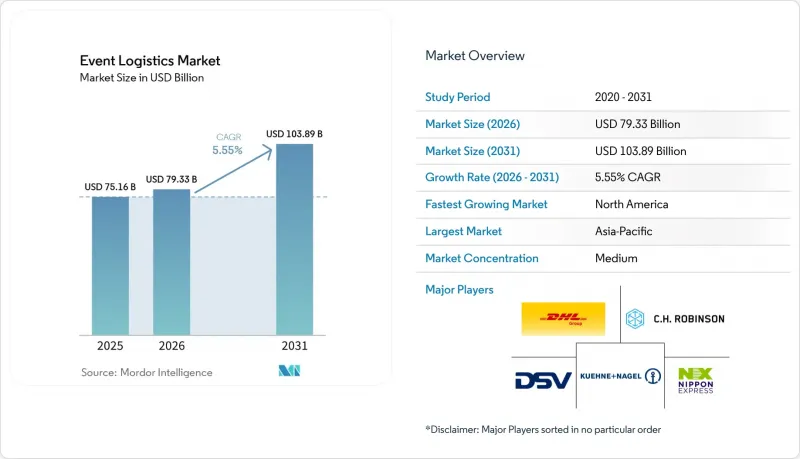
Mordor Intelligence에 의하면, 이벤트 물류 시장 규모는 2025년에 751억 6,000만 달러로 평가되었습니다. 2026년 793억 3,000만 달러에서 2031년까지 1,038억 9,000만 달러에 이를 것으로 예상되며, 예측 기간(2026-2031년) CAGR은 5.55%를 나타낼 전망입니다.

본 보고서는 서비스별(운송, 창고, 유통·재고 관리 등), 용도별(엔터테인먼트·미디어, 스포츠 행사, 박람회·전시회, 기업 행사, 기타 용도), 지역별(북미, 남미, 아시아태평양, 유럽, 중동 및 아프리카)로 분류되어 있습니다. 시장 전망치는 금액(달러)으로 표시되어 있습니다.
세계의 이벤트 물류 시장 동향 및 인사이트
메가 이벤트 증가와 하이브리드 형식의 보급이 전 세계 수요를 확대되고 있습니다.
하이브리드 이벤트에서는 현재 물류와 디지털 인프라를 병행하여 조정해야 할 필요가 있습니다. 2024년 파리 올림픽에서 CEVA 로지스틱스는 총 면적 8만 m²에 달하는 3개의 허브에서 17만 개의 팔레트를 처리하며 방송 장비의 배송을 조율했습니다. 이는 서비스 포트폴리오를 재구성하고 있는 듀얼 스트림 모델을 여실히 보여주고 있습니다. 이와 유사한 요구 사항은 기업 컨퍼런스에서도 나타나고 있어, 부스 설치 자재와 클라우드 스트리밍용 키트를 동시에 반입해야 할 필요가 생기고 있습니다. 이에 따라 각 통신사는 광섬유 연결, 디스플레이 장비, 현장 기술자를 단일 작업 지시서로 관리할 수 있는 전문 멀티미디어 팀을 구성해야 하는 상황에 직면해 있습니다.
국제 스포츠 및 문화 투어 일정이 지속적으로 확대되고 있습니다.
여행 일정이 길어지고 세계화가 진행됨에 따라 통관 절차와 카르네 관리가 복잡해지고 있습니다. 미국, 캐나다, 멕시코 간 국경을 넘는 트럭 운송 횟수는 2024년에 32만 회를 넘어섰습니다. 이는 연속되는 투어 개최지로 향하는 장비의 재입국 절차를 간소화하는 USMCA(미국·멕시코·캐나다 협정)의 규정이 뒷받침한 결과입니다. 스타디움 쇼의 주최 측은 현재 주요 국경 검문소 인근의 환적 거점에 예비 조명 장비와 리깅용 하드웨어를 준비하도록 공급업체에 요청하고 있으며, 이를 통해 행사 직전에 국경에서 발생할 수 있는 지연 위험을 줄이고 있습니다.
국제 항공·해상 운임의 지속적인 변동
항공화물의 현물 가격이 몇 주 만에 두 배로 치솟는 경우도 있어, 주최 측은 예비 예산을 늘리거나 조기 블록 예약을 협상할 수밖에 없는 상황입니다. 2024년에는 관세 문제로 인한 혼란 속에서 국경을 넘는 트럭 운송 요금이 50-75% 상승하면서, 이미 빠듯한 행사 예산에 이익률에 대한 압박이 더욱 가중되었습니다. 각 서비스 제공업체들은 가격 변동이 고객에게 미치는 영향을 완화하기 위해 헤지 계약이나 복합 운송 경로의 도입을 모색하고 있습니다.
부문별 분석
2025년, 이벤트 물류 시장에서 운송 부문은 77.60%를 차지하며, 특수 장비 운송에서 핵심적인 역할을 부각시켰습니다. 운임 변동에도 불구하고, 충격 흡수가 필요한 악기나 방송 장비의 경우, 온도 조절이 되는 화물실을 보장하는 항공 화물 노선에 대한 프리미엄 수요는 여전히 지속되고 있습니다. 통합형 IoT 센서를 통해 현재 위치 정보, 습도, 진동이 추적되고 있으며, 이를 통해 보험금 청구 건수가 감소하고 화주와 주최자 간의 신뢰가 강화되고 있습니다. 창고·유통·재고 관리 부문은 행사장이 집중된 지역 인근에 자산을 사전에 비축해 두기를 원하는 고객들의 요구를 반영하여 연평균 성장률(CAGR) 6.72%를 나타낼 것으로 전망됩니다. 지역 허브 내의 자동 출고 시스템과 RFID 게이트 덕분에 피킹 및 포장 시간이 22% 단축되어, 연속되는 투어 일정 사이에 야간 재배치가 가능해졌습니다. 그 결과, 이벤트 물류 시장의 창고 솔루션 시장 규모는 2031년까지 꾸준히 확대될 것으로 예측됩니다.
유연한 경로 설정이 가능하기 때문에 라스트 마일 운송에서는 여전히 도로 운송이 주류를 이루고 있지만, 특히 북미에서는 운전기사 부족으로 인한 제약에 직면해 있습니다. 중국과 EU의 철도 회랑은 리드타임이 길더라도 수용 가능한 대량의 스테이징 화물을 유치하며, 배출량 감축에도 기여하고 있습니다. 해상 운송은 긴급성이 낮은 부스 설비에 대한 선택지로 계속 자리 잡고 있으며, 지속가능성 노력과 부합하는 비용 절감의 이점을 제공합니다. 항공 운송은 시간적 제약이 엄격한 장비에 대한 틈새 시장으로서의 입지를 유지하고 있으며, 지연될 경우 가치가 급격히 떨어지는 인터랙티브 디지털 기기의 운송 분야에서 수요가 확대되고 있습니다. 따라서 이벤트 물류 업계에서는 화물 취급 요건에 따라 신뢰성이 가장 높고 저탄소인 운송 경로를 조합한 복합 운송 계획에 대한 투자가 진행되고 있습니다.
지역별 분석
2025년 북미는 이벤트 물류 시장의 37.75%를 계속 차지했습니다. 이는 라스베이거스, 시카고, 토론토에 걸쳐 있는 밀집된 행사장 네트워크가 물류 중계 거점으로도 기능하고 있는 점이 한몫하고 있습니다. USMCA(미국·멕시코·캐나다 협정)에 따른 절차 효율화와 성숙한 3PL 생태계가 신뢰할 수 있는 국경 간 물류를 실현하고 있습니다. 그렇긴 하지만, 유가 급등과 운전기사 부족이 계속해서 이익률을 압박하고 있습니다. 이 지역의 기업 행사 부문은 안정적인 마케팅 예산에 힘입어 연중 일정한 운송량을 유지하고 있으며, 이는 공급업체가 계절적 변동에 미치는 영향을 완화하고 있습니다. 멕시코가 4,756억 달러의 수입액을 기록하며 미국의 최대 무역 상대국으로 부상함에 따라, 니어쇼어링의 기회가 생겨나고 있으며, 이는 운송 거리 단축과 체류 시간 감소로 이어지고 있습니다.
아시아태평양은 2031년까지 연평균 성장률(CAGR)이 6.98%로, 가장 빠르게 성장하고 있는 지역입니다. 2027년까지 8,000억 달러에 달할 것으로 예상되는 출장 비용 증가와 인프라 구축의 가속화가 이러한 성장을 뒷받침하고 있습니다. 중국에서는 기술, 자동차, 제조업을 주제로 한 활기를 띠고 있는 국내 박람회 순회가, 복잡한 부스 설치에 정통한 전문 현장 작업 인력에 대한 수요를 부추기고 있습니다. 인도에서는 하이데라바드에서 뭄바이에 이르는 컨벤션 센터 건설 계획이 여러 도시를 순회하는 패키지 투어의 사업 범위를 넓히고 있는 반면, 일본에서는 스마트 행사장 기술에 대한 투자가 IoT를 통합한 물류 솔루션에 대한 수요를 촉진하고 있습니다. 그 결과, 아시아태평양의 이벤트 물류 시장 규모는 계속해서 급속히 확대되고 있습니다.
유럽에서는 균형 잡힌 전망이 유지되고 있습니다. ICS2 규제로 인해 규정 준수 부담이 커지고 있지만, 하노버 메세부터 밀라노 패션 위크에 이르기까지 유럽 대륙의 빽빽한 행사 일정이 안정적인 화물 물동량을 유지하고 있습니다. 스폰서들이 공급망의 모든 단계에서 탄소 보고를 의무화함에 따라, ISO 20121 준수를 입증할 수 있는 공급업체들이 경쟁 우위를 점하고 있습니다. 이 3대 주요 지역 외에도 중동 및 아프리카에서는 엑스포와 같은 프로젝트나 엔터테인먼트 도시 건설에 따른 새로운 비즈니스 기회가 나타나고 있지만, 인프라 부족으로 인해 당분간 처리량 확대에는 한계가 있습니다.
기타 혜택 :
- 엑셀 형식 시장 예측(ME) 시트
- 3개월간의 애널리스트 지원
자주 묻는 질문
목차
제1장 서론
제2장 조사 방법
제3장 주요 요약
제4장 시장 구도
제5장 시장 규모 및 성장 예측
제6장 경쟁 구도
제7장 시장 기회 및 향후 전망
KTHAccording to Mordor Intelligence, the event logistics market size was valued at USD 75.16 billion in 2025 and estimated to grow from USD 79.33 billion in 2026 to reach USD 103.89 billion by 2031, at a CAGR of 5.55% during the forecast period (2026-2031).
This report is Segmented by Service (Transportation, Warehousing, Distribution & Inventory Management and More), by Application (Entertainment & Media, Sports Events, Trade Fairs & Exhibitions, Corporate Events, and Other Applications), by Geography (North America, South America, Asia-Pacific, Europe, Middle East and Africa). The Market Forecasts are Provided in Terms of Value (USD).
Global Event Logistics Market Trends and Insights
Escalation of Mega-Events and Hybrid Formats Expanding Worldwide Demand
Hybrid events now demand parallel orchestration of freight flows and digital infrastructure. During the Paris 2024 Olympics, CEVA Logistics handled 170,000 pallets across three hubs totaling 80,000 m2 while coordinating broadcast equipment distribution, illustrating the dual-stream model reshaping service portfolios. The same requirement is surfacing in corporate conferences where booth construction and cloud-streaming kits must arrive together, prompting providers to build specialized multimedia teams that manage fibre connectivity, display rigs, and on-site technicians in a single work order.
Continuous Growth in International Sports and Cultural Touring Calendars
Touring schedules have lengthened and globalized, raising customs-handling complexity and carnet administration. Cross-border truck traffic between the US, Canada, and Mexico topped 320,000 movements in 2024, helped by USMCA provisions that simplify re-entry for equipment bound for consecutive tour stops. Stadium show promoters now require providers to stage spare lighting rigs and rigging hardware at transshipment depots near major crossings, lowering exposure to last-minute border delays.
Persistently Volatile International Air and Ocean Freight Rates
Air freight spot prices can double within weeks, forcing organizers to expand contingency budgets or negotiate early block bookings. Border truck rates rose 50-75% in 2024 amid tariff disruptions, adding margin pressure on already tight event budgets. Providers are experimenting with hedging contracts and multimodal routing to cushion customers against swings.
Other drivers and restraints analyzed in the detailed report include:
- Surge in Experiential Brand-Marketing Events Boosting Outsourced Logistics Spend
- Rising Organizer Preference for Single-Point End-to-End Logistics Outsourcing
- Multi-Jurisdictional Customs and Security Compliance Complexities
For complete list of drivers and restraints, kindly check the Table Of Contents.
Segment Analysis
Transportation contributed 77.60% of the event logistics market in 2025, underlining its role as the backbone for specialized equipment movement. Despite rate volatility, premium demand persists for air freight lanes that guarantee climate-controlled cabins for musical instruments and broadcast gear requiring shock attenuation. Integrated IoT sensors now track location, humidity, and vibration, reducing insurance claims and reinforcing trust between shippers and organizers. Warehousing, distribution & inventory management is projected to post a 6.72% CAGR, reflecting customer insistence on forward-stocking assets near venue clusters. Automated retrieval systems and RFID portals inside regional hubs cut pick-and-pack time by 22%, enabling overnight redeployments between back-to-back tour dates. As a result, the event logistics market size for warehousing solutions is anticipated to rise steadily through 2031.
Road transport continues to dominate last-mile moves thanks to flexible routing, yet faces constraints from driver shortages, especially in North America. Rail corridors in China and the EU attract bulk staging loads that can tolerate longer lead times while lowering emissions. Sea freight remains the option for non-critical booth infrastructure, offering cost-down benefits that align with sustainability pledges. Air lift retains its niche for time-critical gear and has grown for interactive digital sets that lose value rapidly if delayed. The event logistics industry is therefore investing in blended multimodal plans that match cargo sensitivity with the most reliable, low-carbon path available.
Complete Report Scope:
- By Service
- Transportation
- Road
- Rail
- Sea/Ocean
- Air
- Warehousing, Distribution & Inventory Management
- Other Services
- Transportation
- By Application
- Entertainment & Media
- Sports Events
- Trade Fairs & Exhibitions
- Corporate Events
- Other Applications
- By Geography
- North America
- United States
- Canada
- Mexico
- South America
- Brazil
- Peru
- Chile
- Argentina
- Rest of South America
- Asia-Pacific
- India
- China
- Japan
- Australia
- South Korea
- South East Asia (Singapore, Malaysia, Thailand, Indonesia, Vietnam, Philippines)
- Rest of Asia-Pacific
- Europe
- United Kingdom
- Germany
- France
- Spain
- Italy
- BENELUX (Belgium, Netherlands, Luxembourg)
- NORDICS (Denmark, Finland, Iceland, Norway, Sweden)
- Rest of Europe
- Middle East and Africa
- United Arab Emirates
- Saudi Arabia
- Turkey
- South Africa
- Nigeria
- Rest of Middle East and Africa
- North America
Geography Analysis
North America retained 37.75% of the event logistics market in 2025, benefiting from a dense network of venues in Las Vegas, Chicago, and Toronto that double as logistics marshalling points. USMCA streamlining and mature 3PL ecosystems deliver reliable cross-border flows; nevertheless, fuel-price spikes and driver shortages continue to test margins. The region's corporate event sector, backed by resilient marketing budgets, sustains year-round baseline volumes that cushion providers against seasonality. Mexico's ascent as the largest United States trading partner at USD 475.6 billion in imports unlocks near-shoring opportunities that tighten haul lengths and reduce dwell times.
Asia-Pacific represents the fastest-growing region with a 6.98% CAGR through 2031. Rising business travel spend, forecast to reach USD 800 billion by 2027, and accelerated infrastructure upgrades underpin the expansion. China's robust domestic trade-fair circuit, covering technology, automotive, and manufacturing themes, fuels demand for specialized on-site handling crews conversant in complex booth assembly. India's convention-center pipeline, from Hyderabad to Mumbai, widens the runway for multi-city touring packages, while Japan's investment in smart-venue technology sparks demand for IoT-integrated logistics solutions. As a result, the event logistics market size in Asia-Pacific continues to rise swiftly.
Europe sustains a balanced outlook. The ICS2 regime raises compliance overhead, yet the continent's dense calendar-ranging from Hannover Messe to Milan Fashion Week-maintains consistent cargo flows. Providers able to certify ISO 20121 compliance gain an edge as sponsors enforce carbon reporting at every segment of the supply chain. Beyond the tri-core regions, the Middle East and Africa showcase green-field opportunities tied to Expo-style projects and entertainment city build-outs, though infrastructure gaps still restrain immediate volume scaling.
- DHL Supply Chain & Global Forwarding
- Kuehne + Nagel International AG
- UPS Supply Chain Solutions
- DSV A/S
- Nippon Express
- FedEx Logistics
- C.H. Robinson Worldwide
- Sinotrans Ltd.
- Expeditors International
- CEVA Logistics
- GAC Group
- GEODIS
- Kerry Logistics Network
- Rock-it Cargo
- SOS Global Express
- Freeman Company
- EFI Logistics
- GES (Global Experience Specialists)
- Rhenus Sports & Events Logistics
- CTS Event Logistics
- Messe Frankfurt Exhibition Logistics (Mefex)
Additional Benefits:
- The market estimate (ME) sheet in Excel format
- 3 months of analyst support
TABLE OF CONTENTS
1 Introduction
- 1.1 Study Assumptions & Market Definition
- 1.2 Scope of the Study
2 Research Methodology
3 Executive Summary
4 Market Landscape
- 4.1 Market Overview
- 4.2 Market Drivers
- 4.2.1 Escalation of mega-events and hybrid (in-person + virtual) formats, expanding worldwide demand for integrated event logistics solutions.
- 4.2.2 Continuous growth in international sports, concert and cultural touring calendars, driving time-critical, cross-border freight movements.
- 4.2.3 Surge in experiential brand-marketing events across sectors, boosting outsourced logistics spend for rapid set-up and teardown cycles.
- 4.2.4 Rising organiser preference for single-point, end-to-end logistics outsourcing to control cost and execution risk.
- 4.2.5 Heightened attendee and organiser expectations for real-time shipment visibility enabled by IoT/RFID, pushing adoption of advanced logistics services.
- 4.2.6 Global sustainability pledges from sponsors and venues, accelerating demand for carbon-neutral, reverse-logistics and circular-material solutions
- 4.3 Market Restraints
- 4.3.1 Persistently volatile international air- and ocean-freight rates, squeezing event budget allocations for logistics.
- 4.3.2 Multi-jurisdictional customs, carnet and security compliance complexities that extend lead-times and add administrative cost.
- 4.3.3 Post-pandemic shortage of skilled on-site logistics labour, challenging reliable execution for large-scale events worldwide.
- 4.3.4 Increasing scrutiny of event carbon footprints and waste streams, elevating compliance costs and limiting traditional logistics practices.
- 4.4 Value / Supply-Chain Analysis
- 4.5 Technological Advancement in the Market
- 4.6 Government Regulations and Policies
- 4.7 Porter's Five Forces Analysis
- 4.7.1 Threat of New Entrants
- 4.7.2 Bargaining Power of Buyers
- 4.7.3 Bargaining Power of Suppliers
- 4.7.4 Threat of Substitutes
- 4.7.5 Competitive Rivalry
- 4.8 Impact of Geopolitical Events on the Market
5 Market Size & Growth Forecasts (Value)
- 5.1 By Service
- 5.1.1 Transportation
- 5.1.1.1 Road
- 5.1.1.2 Rail
- 5.1.1.3 Sea/Ocean
- 5.1.1.4 Air
- 5.1.2 Warehousing, Distribution & Inventory Management
- 5.1.3 Other Services
- 5.1.1 Transportation
- 5.2 By Application
- 5.2.1 Entertainment & Media
- 5.2.2 Sports Events
- 5.2.3 Trade Fairs & Exhibitions
- 5.2.4 Corporate Events
- 5.2.5 Other Applications
- 5.3 By Geography
- 5.3.1 North America
- 5.3.1.1 United States
- 5.3.1.2 Canada
- 5.3.1.3 Mexico
- 5.3.2 South America
- 5.3.2.1 Brazil
- 5.3.2.2 Peru
- 5.3.2.3 Chile
- 5.3.2.4 Argentina
- 5.3.2.5 Rest of South America
- 5.3.3 Asia-Pacific
- 5.3.3.1 India
- 5.3.3.2 China
- 5.3.3.3 Japan
- 5.3.3.4 Australia
- 5.3.3.5 South Korea
- 5.3.3.6 South East Asia (Singapore, Malaysia, Thailand, Indonesia, Vietnam, Philippines)
- 5.3.3.7 Rest of Asia-Pacific
- 5.3.4 Europe
- 5.3.4.1 United Kingdom
- 5.3.4.2 Germany
- 5.3.4.3 France
- 5.3.4.4 Spain
- 5.3.4.5 Italy
- 5.3.4.6 BENELUX (Belgium, Netherlands, Luxembourg)
- 5.3.4.7 NORDICS (Denmark, Finland, Iceland, Norway, Sweden)
- 5.3.4.8 Rest of Europe
- 5.3.5 Middle East and Africa
- 5.3.5.1 United Arab Emirates
- 5.3.5.2 Saudi Arabia
- 5.3.5.3 Turkey
- 5.3.5.4 South Africa
- 5.3.5.5 Nigeria
- 5.3.5.6 Rest of Middle East and Africa
- 5.3.1 North America
6 Competitive Landscape
- 6.1 Market Concentration
- 6.2 Strategic Moves
- 6.3 Market Share Analysis
- 6.4 Company Profiles (includes Global level Overview, Market level overview, Core Segments, Financials as available, Strategic Information, Market Rank/Share, Products & Services, Recent Developments)
- 6.4.1 DHL Supply Chain & Global Forwarding
- 6.4.2 Kuehne + Nagel International AG
- 6.4.3 UPS Supply Chain Solutions
- 6.4.4 DSV A/S
- 6.4.5 Nippon Express
- 6.4.6 FedEx Logistics
- 6.4.7 C.H. Robinson Worldwide
- 6.4.8 Sinotrans Ltd.
- 6.4.9 Expeditors International
- 6.4.10 CEVA Logistics
- 6.4.11 GAC Group
- 6.4.12 GEODIS
- 6.4.13 Kerry Logistics Network
- 6.4.14 Rock-it Cargo
- 6.4.15 SOS Global Express
- 6.4.16 Freeman Company
- 6.4.17 EFI Logistics
- 6.4.18 GES (Global Experience Specialists)
- 6.4.19 Rhenus Sports & Events Logistics
- 6.4.20 CTS Event Logistics
- 6.4.21 Messe Frankfurt Exhibition Logistics (Mefex)
