
|
시장보고서
상품코드
2072757
디지털 치료 시장 : 시장 점유율 분석, 업계 동향 및 통계, 성장 예측(2026-2031년)Digital Therapeutics - Market Share Analysis, Industry Trends & Statistics, Growth Forecasts (2026 - 2031) |
||||||
 Mordor Intelligence
Mordor Intelligence에 의하면, 디지털 치료 시장 규모는 2025년에 99억 8,000만 달러로 평가되었고, 2026년에 129억 1,000만 달러로 추정되고, 2031년까지 385억 4,000만 달러에 이를 것으로 예측되며, 2026-2031년 CAGR 25.24%로 성장할 전망입니다.
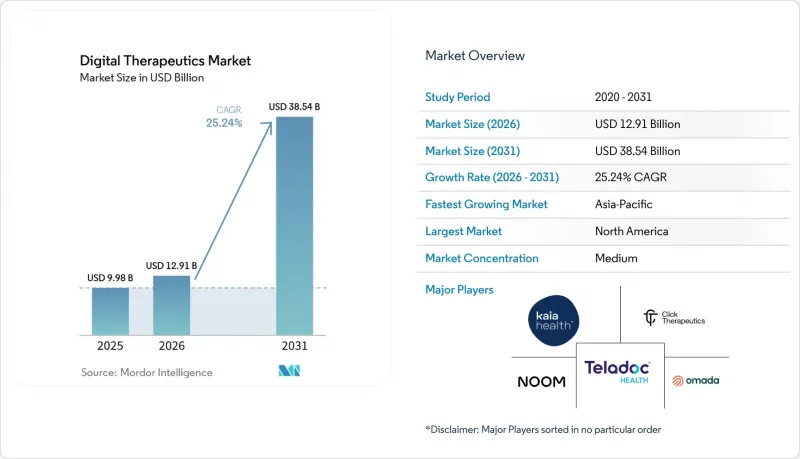
본 보고서는 유형별(소프트웨어, 하드웨어, 서비스), 용도별(예방, 관리, 치료), 적응증별(당뇨병, 비만 등), 비즈니스 모델별(D2C, B2B, 서비스 대가형), 최종 사용자별(환자, 의료 제공업체, 보험사, 고용주), 지역별(북미, 유럽, 아시아태평양, 중동 및 아프리카, 남미)로 분류되어 있습니다. 시장 전망은 금액(달러) 기준으로 제시되어 있습니다.
세계의 디지털 치료 시장 동향 및 인사이트
만성 질환으로 인한 부담이 커짐에 따라, 확장성이 있는 중재 플랫폼이 필요합니다.
만성 질환 유병률 증가에 따라, 기존의 대면 지원을 넘어선 확장 가능한 케어 모델이 요구되고 있으며, 디지털 치료 시장은 급속히 성장하고 있습니다. 당뇨병은 치료에 드는 막대한 부담, 측정 가능한 치료 성과, 그리고 보험사가 디지털 중재를 약물 복용 순응도, 당화헤모글로빈 수치, 입원 위험과 연관 짓고 있다는 점에서 여전히 중요한 중점 분야로 남아 있습니다. 클리블랜드 클리닉의 'Twin Precision Treatment' 플랫폼에 대한 연구 결과는 2형 당뇨병 환자의 약물 사용량 감축에 있어 해당 플랫폼의 잠재력을 입증했으며, 소프트웨어 주도형 심혈관 및 대사 질환 관리의 유효성을 뒷받침하는 것으로 나타났습니다. 이러한 접근 방식은 현재 비만, 고혈압, 심혈관 위험 관리 분야로도 확대되고 있으며, 디지털 프로그램이 약물 치료 및 코칭과 통합되어 복약 순응도를 높이고 치료의 지속성을 강화하기 위해 노력하고 있습니다.
AI를 활용한 개인 맞춤화가 임상 성과 수준을 높입니다.
정적인 컨텐츠만으로는 다양한 환자 프로파일의 참여를 유도하거나 치료 성과를 효과적으로 향상시키기 어렵기 때문에 개인화는 디지털 치료 시장에서 중요한 요소로 부상하고 있습니다. 2025년 임상시험에서는 AI 기반 음성 코치 'Lumen'이, 사람이 진행하는 코칭과 동등한 성과를 내는 문제 해결 요법을 제공하는 데 성공한 것으로 밝혀졌습니다. 또 다른 연구에서는 우울증 및 불안 장애에 대한 중재를 개인 맞춤형으로 설계하는 데 있어 강화 학습의 장점이 강조되었으며, 비개인 맞춤형 접근 방식에 비해 현저한 개선이 나타났습니다. 구매자들은 임상적 반응을 높이고 치료 비용을 절감하는 AI 기반 솔루션을 점점 더 우선시하고 있습니다. 환자 개개인에 맞춘 솔루션을 제공하는 업체는 특히 이탈률이 여전히 과제로 남아 있는 정신 건강 및 만성 질환 프로그램 분야에서 보험 적용 관련 협의 시 유리한 입장에 있습니다. 이러한 추세로 인해 시장 전체의 성과 기준이 상향 조정되고 있습니다.
상환 제도의 파편화가 확장 가능한 비즈니스 모델의 걸림돌이 되고 있습니다.
디지털 치료 시장은 보험사, 정부, 의료 현장별로 보상 체계가 분절되어 있어 상업적 접근이 제한되고 있습니다. 미국에서는 2025년 의사 보수 일정에 따라 디지털 정신건강 기기를 위한 G 코드가 도입되었으나, 전국적으로 통일된 가격 책정 기준이 없기 때문에 이용 여부는 계약 업체 수준의 가격 책정이나 지역의 청구 절차에 따라 달라집니다. 처방전이 필요한 디지털 치료에 대한 보험 급여 전략은 다양하며, 정책 설계는 환자의 접근성, 의료 제공업체의 도입, 그리고 상업적 확장성 측면에서 매우 중요한 역할을 하고 있습니다. 이로 인해, 장기간에 걸친 보험 적용 기간을 관리할 수 있는 기업과, 고용주에게 직접 청구하거나 본인 부담 모델로만 제한되는 기업 간에 격차가 발생하고 있습니다.
부문별 분석
2025년, 디지털 치료 시장에서 소프트웨어 솔루션은 53.78%의 점유율을 차지했습니다. 이는 전용 하드웨어가 필요 없는 앱 기반 치료 모델이 주도한 결과입니다. 이 부문은 신속한 전개, 원활한 업데이트, 그리고 제공 비용 절감을 통해 성장하여, 초기 및 중기 단계의 사업자들에게 상업적 핵심으로 자리매김했습니다. 하드웨어는 여전히 가장 작은 부문에 머물러 있으며, 주로 센서, 웨어러블 기기 또는 기타 연결 기기와 통합되어 보조적인 역할을 수행하고 있습니다. 디지털 치료 시장에서 소프트웨어가 차지하는 핵심적인 위상은 특히 원격 모니터링이 필요 없이 모바일 인터페이스만으로 임상 경로가 완결되는 시나리오에서 더욱 공고해졌습니다.
서비스 분야는 2026-2031년 연평균 성장률(CAGR) 27.10%를 나타낼 것으로 예측되며, 이는 소프트웨어를 중심으로 한 매니지드 케어 부문으로의 구매자 선호도 변화를 반영한 것입니다. 의료 시스템, 보험사 및 고용주는 치료 참여를 촉진하고, 치료의 연속성을 확보하며, 책임성을 강화하기 위한 케어 내비게이션, 코칭, 보고서 작성 및 도입 지원을 점점 더 중요하게 여기고 있습니다. 이러한 변화로 인해 시장은 일회성 라이선싱이나 앱 구독이 아닌, 지속적인 프로그램 제공으로 방향을 전환하고 있습니다. 소프트웨어는 여전히 핵심적인 치료 엔진으로 남아 있는 반면, 서비스는 도입을 측정 가능한 성과로 연결하는 상업적 계층으로 부상하고 있습니다.
2025년에는 당뇨병 예방, 금연, 체중 관리 분야의 꾸준한 도입에 힘입어 예방 분야가 디지털 치료 시장의 42.25%를 차지했습니다. 이러한 분야에서는 익숙한 행동 변화 모델을 활용한 예방 조치에 대해 고용주나 건강보험 플랜으로부터 자금이 지원되었기 때문에 견고한 상업적 기반이 확립되어 있었습니다. 예방 분야는 처방 치료에 비해 임상적 복잡성이 낮기 때문에 대규모 가입자층을 대상으로 광범위하게 확대 적용할 수 있게 되었으며, 2025년에는 가장 큰 용도 분야가 되었습니다. 그러나 현재 성장의 초점은 적극적인 질환 관리로 옮겨가고 있습니다.
관리 분야는 심혈관 대사 질환 및 만성 질환 분야에서 비용 절감 효과를 입증하는 프로그램에 대한 수요가 증가하는 것을 배경으로, 2031년까지 연평균 성장률(CAGR) 28.56%를 기록하며 성장할 것으로 예측됩니다. 오마다 헬스(Omada Health)는 2026년 1분기 매출이 전년 동기 대비 42% 증가한 7,800만 달러를 기록했으며, 총 회원 수가 102만 명을 넘어섰다고 보고하여, 관리에 중점을 둔 플랫폼의 확장성을 보여주고 있습니다. 치료 분야는 승인 요건과 증거 요건이 더 엄격하기 때문에 여전히 규모가 가장 작은 부문이지만, 보험사들이 일반적인 웰니스 정책보다 비용 관리 프로그램을 우선시함에 따라 수익 구성은 관리 분야로 점점 더 쏠리고 있습니다.
지역별 분석
2025년, 북미는 전 세계 디지털 치료 시장의 41.25%를 차지했으며, 매출 측면에서 가장 큰 기여를 한 지역이자 상업적으로도 가장 선진적인 시장이 되었습니다. 이러한 선도적 지위는 FDA의 규제 체계, 견고한 고용주 주도형 자체 보험 기반, 벤처 자본에 의한 활발한 개발, 그리고 소프트웨어 주도형 의료 모델에 대한 제도적 준비가 갖춰져 있었기 때문입니다. 2025년 의사 보수 일정표에서는 디지털 정신건강 치료 기기에 대한 환급 코드가 도입되었으며, 전국적인 가격 책정이 아직 확정되지 않았음에도 불구하고 공식적인 청구 체계가 확립되었습니다.
유럽은 여전히 2위 지역 시장이며, 디지털 치료에 대한 가장 체계적인 국가 차원의 보험 급여 체계인 DiGA 모델을 통해 독일이 주도적인 위치를 차지하고 있습니다. 2025년, DiGA 프로그램에서는 69만 5,000건의 유효한 처방전이 기록되었으며, 그 비용은 1억 7,100만 유로(1억 8,400만 달러)에 달하고, 전년 대비 64%의 성장률을 보였습니다. 2026년 1월부터 독일에서는 DiGA의 보상 가격 중 최소 20%를 측정된 결과에 연동하도록 의무화함에 따라, 견고한 실세계 데이터 시스템을 갖춘 플랫폼이 우대받게 되었습니다. 영국, 프랑스, 이탈리아, 스페인을 비롯한 기타 유럽 국가들도 점차 진전을 보이고 있으며, GAIA 및 다이이치산쿄 유럽과 같은 파트너십은 보다 광범위한 상용화를 위해 독일의 프레임워크를 활용하고 있음을 보여줍니다.
아시아태평양은 디지털 치료제 시장에서 가장 빠르게 성장하고 있으며, 2026-2031년 연평균 성장률(CAGR)은 27.60%로 전망됩니다. 이러한 성장은 만성 질환 유병률 증가, 디지털 헬스 인프라 확충, 그리고 일본, 한국, 호주에서의 '소프트웨어로서의 의료기기(SAMD)'의 공식 승인 절차가 마련됨에 따라 주도되고 있습니다. 2025년까지 한국은 불면증 치료제 'Somzz'를 포함한 14개의 디지털 치료 제품을 승인하며, 규제 측면에서 진전을 보이고 있습니다. 일본 PMDA의 체계와 호주의 TGA 승인 절차는 특히 정신 건강 및 당뇨병 관리 분야에서 체계적인 승인 및 보험 적용 절차를 추진하고 있습니다.
기타 혜택 :
- 엑셀 형식 시장 예측(ME) 시트
- 3개월간의 애널리스트 지원
자주 묻는 질문
목차
제1장 서론
제2장 조사 방법
제3장 주요 요약
제4장 시장 구도
제5장 시장 규모 및 성장 예측
제6장 경쟁 구도
제7장 시장 기회 및 향후 전망
AJY 26.07.07According to Mordor Intelligence, the digital therapeutics market size is projected to be USD 9.98 billion in 2025, USD 12.91 billion in 2026, and reach USD 38.54 billion by 2031, growing at a CAGR of 25.24% from 2026 to 2031.
This report is Segmented by Type (Software, Hardware, Services), Application (Prevention, Management, Treatment), Indication (Diabetes, Obesity, and More), Business Model (Direct-To-Consumer, B2B, Fee-For-Service), End User (Patients, Providers, Payers, Employers), and Geography (North America, Europe, Asia-Pacific, MEA, South America). The Market Forecasts are Provided in Terms of Value (USD).
Global Digital Therapeutics Market Trends and Insights
Rising Chronic Disease Burden Demands Scalable Intervention Platforms
The digital therapeutics market is growing rapidly due to the increasing prevalence of chronic diseases, which demand scalable care models beyond traditional in-person support. Diabetes remains a key focus area because of its significant care burden, measurable outcomes, and the ability for payers to link digital interventions with medication adherence, glycated hemoglobin levels, and hospitalization risks. Cleveland Clinic's findings on the Twin Precision Treatment platform demonstrated its potential in reducing medication use for type 2 diabetes, strengthening the case for software-driven cardiometabolic care. This approach is now extending to obesity, hypertension, and cardiovascular risk management, where digital programs are integrated with drug therapies and coaching to enhance adherence and care continuity.
AI-Enabled Personalization Raises the Clinical Performance Bar
Personalization is becoming a critical factor in the digital therapeutics market as static content fails to engage diverse patient profiles or improve outcomes effectively. A 2025 trial highlighted the success of Lumen, an AI-driven voice coach, in delivering problem-solving therapy with results comparable to human coaching. Another study emphasized the benefits of reinforcement learning in personalizing interventions for depression and anxiety, showing significant improvements over non-personalized approaches. Buyers are increasingly prioritizing AI-driven solutions that enhance clinical responses and reduce care costs. Vendors offering patient-specific adaptations are better positioned in coverage discussions, particularly in mental health and chronic disease programs, where dropout rates remain a challenge. This trend is raising the performance standards across the market.
Reimbursement Fragmentation Constrains Scalable Commercial Models
The digital therapeutics market faces limited commercial access due to fragmented reimbursement frameworks across payers, countries, and care settings. In the U.S., the 2025 Physician Fee Schedule introduced G-codes for digital mental health devices, but the absence of national pricing leaves access reliant on contractor-level pricing and local billing processes. Reimbursement strategies for prescription digital therapeutics vary widely, with policy design playing a critical role in patient access, provider adoption, and commercial scalability. This creates a divide between companies capable of managing extended coverage timelines and those restricted to employer-direct or cash-pay models.
Other drivers and restraints analyzed in the detailed report include:
- Regulatory Normalization of SaMD Creates Institutional Access Pathways
- Accelerating Payer Adoption Through Outcome-Linked Contracting
- Engagement Attrition Undermines Real-World Evidence Generation
For complete list of drivers and restraints, kindly check the Table Of Contents.
Segment Analysis
In 2025, software solutions held 53.78% of the digital therapeutics market, driven by app-based therapy models that bypass the need for specialized hardware. This segment thrived due to rapid distribution, seamless updates, and reduced delivery costs, establishing it as the commercial backbone for early and mid-stage players. Hardware remained the smallest segment, primarily serving a supportive role integrated with sensors, wearables, or other connected devices. Software's centrality in the digital therapeutics market was reinforced, especially in scenarios where mobile interfaces sufficed for clinical pathways without requiring remote monitoring.
Services are projected to grow at a 27.10% CAGR from 2026 to 2031, reflecting a shift in buyer preferences toward managed care layers around software. Health systems, payers, and employers increasingly value care navigation, coaching, reporting, and implementation support to enhance activation, continuity, and accountability. This shift is driving the market toward ongoing program delivery rather than one-time licensing or app subscriptions. Software remains the core therapeutic engine, while services emerge as the commercial layer translating adoption into measurable outcomes.
Prevention accounted for 42.25% of the digital therapeutics market in 2025, supported by strong adoption in diabetes prevention, smoking cessation, and weight management. These areas had established a solid commercial foundation due to employer and health plan funding for preventive measures with familiar behavior-change models. Prevention's lower clinical complexity compared to prescription treatments enabled broader deployment across large member pools, making it the largest application segment in 2025. However, growth is now shifting toward active disease management.
Management is expected to grow at a 28.56% CAGR through 2031, driven by rising demand for programs demonstrating cost-offset benefits in cardiometabolic care and chronic conditions. Omada Health reported Q1 2026 revenue of USD 78 million, a 42% year-over-year increase, with total members exceeding 1.02 million, showcasing the scalability of management-focused platforms. Treatment remains the smallest segment due to stricter authorization and evidence requirements, but the revenue mix is increasingly favoring management as payers prioritize cost-control programs over general wellness initiatives.
Complete Report Scope:
- By Type
- Softwares
- Hardware
- Services
- By Application
- Prevention
- Management
- Treatment
- By Indication
- Diabetes
- Obesity
- Gastrointestinal Disorders
- Cardiovascular Disease
- Central Nervous System Disorders
- Respiratory Disorders
- Smoking Cessation
- Other Indications
- By Business Model
- Direct-to-Consumer
- Business-to-Business
- Fee-for-Service
- By End User
- Patients
- Providers
- Payers
- Employers
- Geography
- North America
- United States
- Canada
- Mexico
- Europe
- Germany
- United Kingdom
- France
- Italy
- Spain
- Rest of Europe
- Asia-Pacific
- China
- India
- Japan
- Australia
- South Korea
- Rest of Asia-Pacific
- Middle East and Africa
- GCC
- South Africa
- Rest of Middle East and Africa
- South America
- Brazil
- Argentina
- Rest of South America
- North America
Geography Analysis
In 2025, North America accounted for 41.25% of the global digital therapeutics market, making it the largest regional contributor by revenue and the most commercially advanced market. This leadership stemmed from the FDA's regulatory framework, a strong employer self-insurance base, active venture-backed developments, and institutional readiness for software-driven care models. The 2025 Physician Fee Schedule introduced reimbursement codes for digital mental health treatment devices, creating a formal billing mechanism despite pending national pricing.
Europe remained the second-largest regional market, with Germany leading due to its DiGA model, the most structured national reimbursement pathway for digital therapeutics. In 2025, the DiGA program recorded 695,000 activated prescriptions, costing EUR 171 million (USD 184 million), reflecting 64% year-over-year growth. From January 2026, Germany required at least 20% of DiGA reimbursement pricing to be tied to measured outcomes, favoring platforms with robust real-world data systems. Other European countries, including the UK, France, Italy, and Spain, are progressing gradually, while partnerships like GAIA and Daiichi Sankyo Europe demonstrate the use of the German pathway for broader commercialization.
The Asia-Pacific region is the fastest-growing digital therapeutics market, with a projected CAGR of 27.60% from 2026 to 2031. Growth is driven by rising chronic disease prevalence, expanding digital health infrastructure, and formal software-as-medical-device pathways in Japan, South Korea, and Australia. By 2025, South Korea approved 14 digital therapeutics products, including the insomnia treatment Somzz, showcasing regulatory progress. Japan's PMDA framework and Australia's TGA pathway are advancing structured approval and reimbursement processes, particularly in mental health and diabetes care.
- 2Morrow
- Akili
- Better Therapeutics, LLC
- Big Health Ltd
- Biofourmis Inc.
- Canary Health, Inc.
- Click Therapeutics, Inc.
- DarioHealth Corp.
- Huma Therapeutics Limited
- IQVIA
- Kaia Health Software GmbH
- Lark Technologies, Inc.
- Medtronic
- Noom, Inc.
- Omada Health
- Otsuka
- Resmed
- Teladoc Health
- Virta Health Corp.
- Welldoc, Inc.
Additional Benefits:
- The market estimate (ME) sheet in Excel format
- 3 months of analyst support
TABLE OF CONTENTS
1 INTRODUCTION
- 1.1 Study Assumptions and Market Definition
- 1.2 Scope of the Study
2 RESEARCH METHODOLOGY
3 EXECUTIVE SUMMARY
4 MARKET LANDSCAPE
- 4.1 Market Overview
- 4.2 Market Drivers
- 4.2.1 Rising Chronic Disease Burden Requiring Continuous Out-of-Clinic Care
- 4.2.2 Accelerating Payer Adoption of Value-Based Digital Care Pathways
- 4.2.3 Prescription Digital Therapeutics Integration with GLP-1 and Other Drug Regimens
- 4.2.4 AI-Enabled Personalization and Adaptive Coaching Increasing Clinical Persistence
- 4.2.5 Greater Employer Demand for Measurable Productivity and Adherence Outcomes
- 4.2.6 Regulatory Normalization of SaMD, PDURS, and Reimbursement Pathways
- 4.3 Market Restraints
- 4.3.1 Uneven Reimbursement Coverage Across Indications and Payers
- 4.3.2 High Evidence Generation Cost for Clinical Validation and Real-World Proof
- 4.3.3 Low Persistence and Engagement Drop-Off After Initial Adoption
- 4.3.4 Integration Friction with EHR, Claims, and Provider Workflows
- 4.4 Supply/Value Chain Analysis
- 4.5 Regulatory Landscape
- 4.6 Technological Outlook
- 4.7 Porter's Five Forces Analysis
- 4.7.1 Threat of New Entrants
- 4.7.2 Bargaining Power of Suppliers
- 4.7.3 Bargaining Power of Buyers
- 4.7.4 Threat of Substitutes
- 4.7.5 Competitive Rivalry
5 MARKET SIZE AND GROWTH FORECASTS (VALUE, USD)
- 5.1 By Type
- 5.1.1 Softwares
- 5.1.2 Hardware
- 5.1.3 Services
- 5.2 By Application
- 5.2.1 Prevention
- 5.2.2 Management
- 5.2.3 Treatment
- 5.3 By Indication
- 5.3.1 Diabetes
- 5.3.2 Obesity
- 5.3.3 Gastrointestinal Disorders
- 5.3.4 Cardiovascular Disease
- 5.3.5 Central Nervous System Disorders
- 5.3.6 Respiratory Disorders
- 5.3.7 Smoking Cessation
- 5.3.8 Other Indications
- 5.4 By Business Model
- 5.4.1 Direct-to-Consumer
- 5.4.2 Business-to-Business
- 5.4.3 Fee-for-Service
- 5.5 By End User
- 5.5.1 Patients
- 5.5.2 Providers
- 5.5.3 Payers
- 5.5.4 Employers
- 5.6 Geography
- 5.6.1 North America
- 5.6.1.1 United States
- 5.6.1.2 Canada
- 5.6.1.3 Mexico
- 5.6.2 Europe
- 5.6.2.1 Germany
- 5.6.2.2 United Kingdom
- 5.6.2.3 France
- 5.6.2.4 Italy
- 5.6.2.5 Spain
- 5.6.2.6 Rest of Europe
- 5.6.3 Asia-Pacific
- 5.6.3.1 China
- 5.6.3.2 India
- 5.6.3.3 Japan
- 5.6.3.4 Australia
- 5.6.3.5 South Korea
- 5.6.3.6 Rest of Asia-Pacific
- 5.6.4 Middle East and Africa
- 5.6.4.1 GCC
- 5.6.4.2 South Africa
- 5.6.4.3 Rest of Middle East and Africa
- 5.6.5 South America
- 5.6.5.1 Brazil
- 5.6.5.2 Argentina
- 5.6.5.3 Rest of South America
- 5.6.1 North America
6 COMPETITIVE LANDSCAPE
- 6.1 Market Concentration
- 6.2 Market Share Analysis
- 6.3 Company Profiles (includes Global Level Overview, Market Level Overview, Core Segments, Financials as available, Strategic Information, Market Rank/Share, Products and Services, Recent Developments)
- 6.3.1 2Morrow, Inc.
- 6.3.2 Akili, Inc.
- 6.3.3 Better Therapeutics, LLC
- 6.3.4 Big Health Ltd
- 6.3.5 Biofourmis Inc.
- 6.3.6 Canary Health, Inc.
- 6.3.7 Click Therapeutics, Inc.
- 6.3.8 DarioHealth Corp.
- 6.3.9 Huma Therapeutics Limited
- 6.3.10 IQVIA Holdings Inc.
- 6.3.11 Kaia Health Software GmbH
- 6.3.12 Lark Technologies, Inc.
- 6.3.13 Medtronic plc
- 6.3.14 Noom, Inc.
- 6.3.15 Omada Health, Inc.
- 6.3.16 Otsuka Pharmaceutical Co., Ltd.
- 6.3.17 ResMed Inc.
- 6.3.18 Teladoc Health, Inc.
- 6.3.19 Virta Health Corp.
- 6.3.20 Welldoc, Inc.
7 MARKET OPPORTUNITIES AND FUTURE OUTLOOK
- 7.1 White-Space and Unmet-Need Assessment