

|
시장보고서
상품코드
2072873
소프트웨어 에너지 소비 분석 시장 : 점유율 분석, 업계 동향과 통계, 성장 예측(2026-2031년)Software Energy Consumption Analytics - Market Share Analysis, Industry Trends & Statistics, Growth Forecasts (2026 - 2031) |
||||||
 Mordor Intelligence
Mordor Intelligence에 의하면, 소프트웨어 에너지 소비 분석 시장 규모는 2025년에 9억 8,000만 달러로 평가되었고 2031년까지 23억 달러에 이를 것으로 예측되며, 2026-2031년까지 CAGR 15.48%로 성장할 전망입니다.
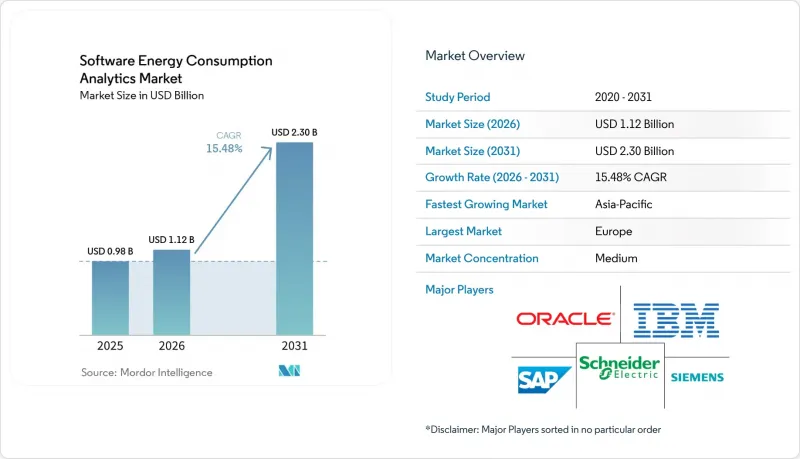
본 보고서는 도입 형태(클라우드 기반, On-Premise형, 하이브리드형), 구성 요소(소프트웨어, 서비스), 용도(에너지 가시화·모니터링, 용도의 에너지 최적화 등), 최종 이용 산업(IT 및 통신, 은행, 금융서비스 및 보험(BFSI), 산업 제조, 에너지 및 유틸리티 등), 그리고 지역별로 분류되어 있습니다. 시장 전망은 금액(달러) 기준으로 제시되어 있습니다.
전 세계 소프트웨어 에너지 소비 분석 시장 동향 및 인사이트
증가하는 에너지 비용 부담과 에너지 효율화 의무화
에너지 효율에 관한 규제가 정책 목표에서 운영 요건으로 전환됨에 따라, 소프트웨어 에너지 소비 분석 시장의 구매자들의 시급성이 높아지고 있습니다. 개정된 EU 에너지 효율 지침에 따라, 회원국들은 2025년 10월까지 해당 규정을 국내법에 반영해야 할 의무가 부과되었으며, 이에 따라 대규모 에너지 소비 사업자에 대한 규정 준수 기한이 더욱 엄격해졌습니다. 제11조에서는 연간 85 TJ를 초과하는 에너지를 소비하는 기업에 대해 ISO 50001 인증을 취득한 에너지 관리 시스템의 도입을 의무화하고 있으며, 10 TJ를 초과하는 에너지를 소비하는 기업에게는 정기적인 에너지 감사 실시가 요구되고 있습니다. 이러한 의무로 인해, 다수의 거점에 걸친 수동 추적 작업을 감사 대응이 가능한 수준으로 유지하기가 어려워지고 있으며, 그 결과 자동화된 모니터링, 보고 및 기록 보관 도구의 가치가 높아지고 있습니다. 이러한 플랫폼이 도입되면, 에너지 보고는 일회성 작업이 아닌 정기적인 워크플로우로 자리 잡게 되어, 소프트웨어 에너지 소비 분석 시장에서 보다 장기적인 구독 주기의 정착을 촉진하게 될 것입니다.
스마트 계량기 및 IoT 원격 측정 기술의 급속한 보급
스마트 미터와 IoT 도입이 확대됨에 따라, 기업이 빌딩, 공장, 분산된 거점 전체에서 수집·분석할 수 있는 소비 데이터 양이 증가하고 있습니다. 이는 소프트웨어 에너지 소비 분석 시장에 있어 중요한 의미를 지닙니다. 왜냐하면, 더 높은 빈도의 계량 데이터는 부하 프로파일링, 이상 감지, 벤치마킹 및 장치 수준의 패턴 인식을 가능하게 하기 때문입니다. 단순한 월별 청구 기록에 그치지 않는 이러한 움직임은 구매자들의 기대를 변화시키고 있습니다. 사용자들은 정적인 사후 보고서가 아니라, 거의 실시간으로 상황을 파악할 수 있는 가시성을 원하기 때문입니다. 이러한 변화는 소프트웨어 설계에 대한 요구 수준도 높이고 있습니다. 벤더는 운영 담당자가 수많은 알림에 파묻히지 않고 데이터를 바탕으로 조치를 취할 수 있도록, 더 우수한 필터링, 우선순위 지정 및 워크플로 도구를 제공해야 하기 때문입니다. 이러한 수요가 가장 두드러지게 영향을 미치는 곳은 아시아태평양의 대규모 도입 시장입니다. 이 지역에서는 계측 기기의 보급이 확대됨에 따라 소프트웨어 에너지 소비 분석 시장의 향후 구매자 기반이 확대되고 있습니다.
레거시 IT 및 OT 통합의 복잡성
레거시 운영 기술(OT)은 소프트웨어 에너지 소비 분석 시장에서 여전히 가장 두드러진 도입 장벽 중 하나입니다. 많은 산업 시설에서는 최신 엔터프라이즈 분석 계층과의 지속적인 연결을 염두에 두고 설계되지 않은 구식 제어 시스템이나 독자적인 프로토콜이 여전히 가동되고 있습니다. 따라서 구매자가 라이브 데이터 피드를 신뢰할 수 있게 되기까지는 미들웨어나 단계적인 전환 계획, 일시적인 병행 운영이 필요한 경우가 많아 프로젝트 비용이 증가하고 있습니다. 규제가 엄격한 환경에서는 이 문제가 더욱 심각합니다. 보안 심사 및 운영 승인으로 인해 도입 일정에 수개월의 지연이 발생할 가능성이 있기 때문입니다. 일반적인 히스토리안이나 OT 데이터 스토어에 이미 연결되어 있는 벤더들은 이러한 고객 접근 방식에서 우위를 점하고 있지만, 통합에 따른 마찰로 인해 소프트웨어 에너지 소비 분석 시장 전체에서의 도입이 여전히 지연되고 있습니다.
부문별 분석
2025년에는 클라우드 기반 솔루션이 66.74%의 점유율을 차지하며, 소프트웨어 에너지 소비 분석 시장에서 주도적인 위치를 확립했습니다. 이 결과는 기업의 전반적인 업무에서 SaaS(Software-as-a-Service)로의 전환이 확산되고 있음을 반영하고 있습니다. 클라우드 플랫폼은 대규모 계량 데이터 세트를 보다 효율적으로 처리하며, 현장 수준의 인프라 업데이트 없이도 지속적인 업데이트를 지원합니다. 또한 IoT 기기, 과금 시스템, 데이터 웨어하우스, 지속가능성 보고 도구와의 연동도 간소화합니다. 이러한 조합 덕분에, 신속한 도입과 소유 비용 절감을 원하는 구매자들에게 클라우드는 기본적인 선택지가 되고 있습니다.
하이브리드형은 2026년부터 2031년까지 연평균 성장률(CAGR) 16.25%를 나타낼 것으로 예측되며, 소프트웨어 에너지 소비 분석 시장에서 가장 빠르게 성장하는 형태가 될 것입니다. 이러한 매력은 기밀성이 높은 OT 데이터를 On-Premise에 보관하면서도 클라우드 AI나 벤치마크 서비스도 활용하고자 하는 조직들 사이에서 특히 크게 느껴지고 있습니다. Bidgely의 UtilityAI Pro는 이러한 추세를 반영하여, 유틸리티자가 AWS, Snowflake, Databricks 등의 자체 클라우드 환경에서 맞춤형 AI 모델을 실행하는 동시에 공유 플랫폼의 기능도 활용할 수 있도록 했습니다. SAP나 Oracle과 같은 벤더들이 더욱 강력한 분석 및 AI 기능을 갖춘 클라우드 네이티브 로드맵을 지속적으로 중시함에 따라, On-Premise형 도구의 상대적 중요성은 줄어들고 있습니다.
2025년에는 소프트웨어가 구성 요소의 70.12%를 차지하며, 에너지 소비 분석 시장에서 가장 큰 점유율을 기록했습니다. 이 결과는 벤더들이 정기적인 라이선스 비용이나 플랫폼 구독료를 통해 이 부문에서 수익을 창출하고 있는 현실과 일치합니다. 지속적인 데이터 수집, 모델 업데이트, 규제 변경 등은 일회성 프로젝트 작업보다 소프트웨어를 통해 관리하는 것이 더 쉽습니다. 또한, 이러한 경향은 구매자들이 서비스 이용 빈도를 늘리기 전에 확장 가능한 시스템 오브 레코드를 우선시하고 있음을 보여줍니다. 소프트웨어 에너지 소비 분석 업계에서 이러한 추세로 인해 플랫폼 관리는 여전히 벤더 전략의 핵심으로 자리 잡고 있습니다.
소프트웨어 에너지 소비 분석 시장에서 점점 더 많은 고객이 공급업체에 도입, 분석 및 보고서 작성 워크플로우에 대한 지원을 요청함에 따라, 서비스 부문은 2026년부터 2031년까지 연평균 성장률(CAGR) 15.92%로 성장할 것으로 전망됩니다. 이러한 경향은 컴플라이언스 프로그램으로 인해 기업이 여러 시설에 걸쳐 기술 도입과 운영 변경을 병행할 수밖에 없는 상황에서 특히 두드러집니다. 슈나이더 일렉트릭은 2026년 1월, 소프트웨어 제공과 에너지 관련 전문 지식을 융합한 ‘Resource Advisor+’와 ‘Sera AI 에이전트’를 출시하며 이러한 융합을 한층 더 추진했습니다. 에너지 시스템과 데이터 모델을 모두 이해하는 숙련된 팀은 소프트웨어 에너지 소비 분석 업계 전반에 걸쳐 여전히 드문 편이므로, 서비스 분야의 성장 기회는 앞으로도 지속될 것으로 전망됩니다.
지역별 분석
2025년, 유럽은 소프트웨어 에너지 소비 분석 시장의 34.56%를 차지하며 최대 지역 시장이 되었습니다. 이 지역의 경쟁력은 법적 구속력이 있는 에너지 효율 목표, 의무화된 지속가능성 보고, 그리고 분석 기술의 신속한 도입을 뒷받침하는 성숙한 디지털 인프라에 기인합니다. 개정된 유럽 에너지 효율 지침(EED)에서는 회원국들에게 2025년 10월까지 해당 규정을 국내법에 반영할 것을 요구하고 있으며, 감사 및 관리 시스템의 의무화를 통해 대규모 에너지 사용자에 대한 규정 준수 압박이 강화되었습니다. 독일, 영국, 프랑스, 이탈리아가 수요의 핵심 클러스터를 형성하고 있으며, 특히 독일에서는 EED 관련 요건이 국내 규정 준수 실무에 반영됨에 따라 그 존재감이 두드러지고 있습니다. 이 지역의 구매자들은 감사에 대응할 수 있는 보고 기능, 엄격한 온실가스(GHG) 산정, 그리고 ISO 50001 워크플로우 지원 여부를 기준으로 공급업체를 선정하는 경향이 점점 더 강해지고 있습니다.
북미는 소프트웨어 에너지 소비 분석 시장에서 여전히 2위의 규모를 차지하고 있습니다. 미국은 주요 혁신의 중심지이며, GridPoint, Bidgely, Uplight, Sense Labs, EnergyCAP과 같은 업체들이 소프트웨어 기반 에너지 소비 분석 시장 전반에서 볼 수 있는 다양한 상업용 및 유틸리티용 활용 사례를 주도하고 있습니다. Oracle은 2026년 5월, AI, 클라우드, 고객 주도 혁신을 통해 달성한 성과에 대해 엑셀론(Exelon), 엘파소 일렉트릭(El Paso Electric)과 같은 유틸리티자를 사례로 들며, 이 지역 기업들 사이에서 이러한 기술이 깊이 뿌리내리고 있음을 보여주었습니다. 캐나다에서는 꾸준한 수요가 나타나고 있는 반면, 멕시코와 남미 일부 지역에서는 산업 효율화 프로그램과 대규모 지역 그룹이 관리하는 국경을 초월한 도입을 통해 시장이 부상하고 있습니다.
아시아태평양은 2026년부터 2031년까지 연평균 성장률(CAGR) 16.34%를 나타낼 것으로 예측되며, 소프트웨어 에너지 소비 분석 시장에서 가장 빠르게 성장하는 지역이 될 것입니다. 중국과 인도는 탈탄소화 정책, 스마트 계량기 도입, 대기업의 디지털화를 통해 이러한 성장의 상당 부분을 주도하고 있습니다. 일본, 한국, 호주 역시 송전망 현대화, 가상 발전소(VPP) 운영, 그리고 보다 세밀한 전력 시장 운영을 통해 수요를 뒷받침하고 있습니다. Wipro와 Kongsberg Digital은 2026년 4월, 에너지 및 유틸리티 부문을 대상으로 AI를 활용한 디지털 트윈 솔루션을 제공하기 위한 제휴를 발표했으며, 이는 이 지역에서 고급 분석 기능이 얼마나 빠르게 보급되고 있는지를 여실히 보여주고 있습니다. 중동 및 아프리카는 여전히 초기 단계 시장이지만, 걸프 국가들의 국가 주도 에너지 프로그램과 남아프리카공화국 및 나이지리아의 규제 준수에 따른 수요를 배경으로, 에너지 소비 분석 소프트웨어 시장의 향후 구매자 기반은 점차 확대되고 있습니다.
기타 혜택:
- 엑셀 형식 시장 예측(ME) 시트
- 3개월간의 애널리스트 지원
자주 묻는 질문
목차
제1장 서론
제2장 조사 방법
제3장 주요 요약
제4장 시장 구도
제5장 시장 규모와 성장 예측
제6장 경쟁 구도
제7장 시장 기회와 향후 전망
JHS 26.07.07According to Mordor Intelligence, the software energy consumption analytics market was valued at USD 0.98 billion in 2025 and is forecast to reach USD 2.30 billion by 2031, advancing at a CAGR of 15.48% from 2026 to 2031.
This report is Segmented by Deployment Mode (Cloud-Based, On-Premises, and Hybrid), Component (Software, and Services), Application (Energy Visibility and Monitoring, Application Energy Optimization, and More), End-Use Industry (IT and Telecom, BFSI, Industrial Manufacturing, Energy and Utilities, and More), and Geography. The Market Forecasts are Provided in Terms of Value (USD).
Global Software Energy Consumption Analytics Market Trends and Insights
Rising Utility Cost Pressure and Energy Efficiency Mandates
Energy efficiency rules have shifted from policy targets to operational requirements, driving greater buyer urgency in the software energy consumption analytics market. The recast EU Energy Efficiency Directive required member states to transpose its provisions into national law by October 2025, which tightened compliance timelines for large energy users. Article 11 requires enterprises that consume more than 85 TJ annually to implement ISO 50001-certified energy management systems, while those that consume more than 10 TJ must complete periodic energy audits. Those obligations make manual tracking across many sites difficult to maintain at audit-ready quality, which raises the value of automated monitoring, reporting, and record retention tools. Once these platforms are installed, energy reporting becomes a recurring workflow rather than a one-time exercise, which supports longer subscription cycles in the software energy consumption analytics market.
Rapid Smart Meter And IoT Telemetry Expansion
Smart meter and IoT rollouts are increasing the amount of consumption data that enterprises can capture and review across buildings, plants, and distributed sites. This matters for the software energy consumption analytics market because higher-frequency meter feeds support load profiling, anomaly detection, benchmarking, and device-level pattern recognition. The move beyond simple monthly billing records is changing buyer expectations, as users now want near-real-time visibility rather than static retrospective reports. That shift also raises the bar for software design, since vendors need better filtering, prioritization, and workflow tools so operators can act on the data without getting buried in alerts. The demand effect is strongest in large rollout markets across Asia-Pacific, where metering expansion is widening the future buyer base for the software energy consumption analytics market.
Legacy IT and OT Integration Complexity
Legacy operational technology remains one of the clearest deployment barriers in the software energy consumption analytics market. Many industrial sites still run older control systems and proprietary protocols that were not designed for continuous connection with modern enterprise analytics layers. That raises project cost because buyers often need middleware, staged migration plans, and temporary parallel operations before they can trust live data feeds. The problem is even harder in regulated environments, where security reviews and operating approvals can add months to deployment timelines. Vendors that already connect to common historians and OT data stores enter these accounts with an advantage, but integration friction still slows adoption across the software energy consumption analytics market.
Other drivers and restraints analyzed in the detailed report include:
- Shift Toward Cloud Native Energy Intelligence Platforms
- AI Enabled Load, Anomaly, and Benchmark Analytics Adoption
- Weak Data Quality And Energy Baseline Standardization
For complete list of drivers and restraints, kindly check the Table Of Contents.
Segment Analysis
Cloud-based deployment held a 66.74% share in 2025, giving it the leading position in the software energy consumption analytics market. This result reflects the wider move to software-as-a-service across enterprise operations. Cloud platforms handle large meter datasets more efficiently and support continuous updates without site-level infrastructure refreshes. They also simplify connections with IoT devices, billing systems, data warehouses, and sustainability reporting tools. That combination has made the cloud the default choice for buyers who want faster rollout and lower ownership costs.
Hybrid deployment is projected to grow at a 16.25% CAGR from 2026 to 2031, which makes it the fastest-growing mode in the software energy consumption analytics market. The appeal is strongest among organizations that want to keep sensitive OT data on-site while still using cloud AI and benchmarking services. Bidgely's UtilityAI Pro reflected this direction by enabling utilities to run custom AI models in their own cloud environments, including AWS, Snowflake, and Databricks, while still leveraging shared platform capabilities. On-premises tools are losing relative weight as vendors such as SAP and Oracle continue to favor cloud-native roadmaps with stronger analytics and AI layers.
Software accounted for 70.12% of the component mix in 2025, giving it the largest share in the software energy consumption analytics market. That outcome aligns with how vendors monetize the category through recurring licenses and platform subscriptions. Continuous data ingestion, model updates, and regulatory changes are easier to manage through software than through one-time project work. The lead also shows that buyers are prioritizing scalable systems of record before they expand service intensity. In the software energy consumption analytics industry, that bias keeps platform control at the center of vendor strategy.
Services are projected to grow at a 15.92% CAGR from 2026 to 2031 as more customers ask vendors to support deployment, analytics, and reporting workflows in the software energy consumption analytics market. This pattern is strongest where compliance programs force companies to combine technology rollout with operating changes across many facilities. Schneider Electric pushed this mix further in January 2026 when it launched Resource Advisor+ with the Sera AI agent, which blended software delivery with embedded energy expertise. The services opportunity should remain durable because skilled teams that understand both energy systems and data models are still limited across the software energy consumption analytics industry.
Complete Report Scope:
- By Deployment Mode
- Cloud Based
- On Premises
- Hybrid
- By Component
- Software
- Services
- By Application
- Energy Visibility and Monitoring
- Application Energy Optimization
- Cloud and Data Center Optimization
- Forecasting and Predictive Analytics
- Sustainability and Carbon Intelligence
- By End-Use Industry
- IT and Telecom
- BFSI
- Industrial Manufacturing
- Energy and Utilities
- Oil and Gas
- Retail and E-Commerce
- Food and Beverage Manufacturing
- Construction and Infrastructure
- Government and Public Sector
- Other End-User Industries
- By Geography
- North America
- United States
- Canada
- Mexico
- South America
- Brazil
- Rest of South America
- Europe
- Germany
- United Kingdom
- France
- Italy
- Spain
- Russia
- Rest of Europe
- Asia-Pacific
- China
- India
- Japan
- South Korea
- Australia
- Rest of Asia-Pacific
- Middle East
- Turkey
- Saudi Arabia
- United Arab Emirates
- Rest of Middle East
- Africa
- South Africa
- Nigeria
- Rest of Africa
- North America
Geography Analysis
Europe held 34.56% of the software energy consumption analytics market share in 2025, making it the largest regional market. The region's lead came from binding energy efficiency targets, mandatory sustainability reporting, and a mature digital base that supports faster analytics adoption. The recast EED required member states to transpose its provisions by October 2025, which increased compliance pressure on large energy users through audit and management system obligations. Germany, the United Kingdom, France, and Italy formed the core demand cluster, with Germany standing out as EED-related requirements moved into national compliance practice. Buyers in this region are increasingly screening vendors for audit-ready reporting, disciplined GHG accounting, and support for ISO 50001 workflows.
North America remained the second-largest geography in the software energy consumption analytics market. The United States is the main innovation center, with vendors such as GridPoint, Bidgely, Uplight, Sense Labs, and EnergyCAP shaping many of the commercial and utility use cases seen across the software energy consumption analytics market. Oracle highlighted utilities such as Exelon and El Paso Electric in May 2026 for results driven by AI, cloud, and customer innovation, reflecting the depth of enterprise adoption in the region. Canada adds steady demand, while Mexico and parts of South America are emerging through industrial efficiency programs and cross-border deployments managed by larger regional groups.
Asia-Pacific is projected to grow at a 16.34% CAGR from 2026 to 2031, which makes it the fastest-growing geography in the software energy consumption analytics market. China and India are driving much of that expansion through decarbonization policies, smart meter rollouts, and large-enterprise digitization. Japan, South Korea, and Australia are also supporting demand through grid modernization, virtual power plant activity, and more granular electricity market operation. Wipro and Kongsberg Digital announced an April 2026 partnership to deliver AI-powered digital twin solutions for the energy and utilities sector, underscoring how quickly advanced analytics capabilities are spreading across the region. The Middle East and Africa remain earlier-stage markets, but sovereign energy programs in the Gulf and compliance-led demand in South Africa and Nigeria are gradually widening the future buyer base for the software energy consumption analytics market.
- Oracle Corporation
- International Business Machines Corporation
- SAP SE
- SAS Institute Inc.
- Teradata Corporation
- C3.ai, Inc.
- Palantir Technologies Inc.
- Verdigris Technologies
- Aspen Technology, Inc.
- Schneider Electric SE
- AVEVA Group Limited
- Eaton Corporation
- Bidgely, Inc.
- EnergyCAP, LLC
- GridPoint, Inc.
- Uplight, Inc.
- Energyworx B.V.
- Spacewell International NV
- Sense Labs, Inc.
- Smarter Grid Solutions Limited
Additional Benefits:
- The market estimate (ME) sheet in Excel format
- 3 months of analyst support
TABLE OF CONTENTS
1 INTRODUCTION
- 1.1 Study Assumptions and Market Definition
- 1.2 Scope of the Study
2 RESEARCH METHODOLOGY
3 EXECUTIVE SUMMARY
4 MARKET LANDSCAPE
- 4.1 Market Overview
- 4.2 Market Drivers
- 4.2.1 Rising Utility Cost Pressure and Energy Efficiency Mandates
- 4.2.2 Rapid Smart Meter and IoT Telemetry Expansion
- 4.2.3 Shift Toward Cloud Native Energy Intelligence Platforms
- 4.2.4 AI Enabled Load, Anomaly, and Benchmark Analytics Adoption
- 4.2.5 Data Center Power Optimization and Sustainability Reporting Demand
- 4.2.6 Digital Twin Based Software Energy Profiling in Large Enterprises
- 4.3 Market Restraints
- 4.3.1 Legacy IT and OT Integration Complexity
- 4.3.2 Weak Data Quality and Energy Baseline Standardization
- 4.3.3 Cybersecurity, Privacy, and Data Sovereignty Constraints
- 4.3.4 Specialized Implementation Talent Shortage
- 4.4 Industry Value Chain Analysis
- 4.5 Regulatory Landscape
- 4.6 Impact of Macroeconomic Factors on the Market
- 4.7 Technological Outlook
- 4.8 Porter's Five Forces Analysis
- 4.8.1 Bargaining Power of Suppliers
- 4.8.2 Bargaining Power of Buyers
- 4.8.3 Threat of New Entrants
- 4.8.4 Threat of Substitutes
- 4.8.5 Intensity of Competitive Rivalry
5 MARKET SIZE AND GROWTH FORECASTS (VALUE)
- 5.1 By Deployment Mode
- 5.1.1 Cloud Based
- 5.1.2 On Premises
- 5.1.3 Hybrid
- 5.2 By Component
- 5.2.1 Software
- 5.2.2 Services
- 5.3 By Application
- 5.3.1 Energy Visibility and Monitoring
- 5.3.2 Application Energy Optimization
- 5.3.3 Cloud and Data Center Optimization
- 5.3.4 Forecasting and Predictive Analytics
- 5.3.5 Sustainability and Carbon Intelligence
- 5.4 By End-Use Industry
- 5.4.1 IT and Telecom
- 5.4.2 BFSI
- 5.4.3 Industrial Manufacturing
- 5.4.4 Energy and Utilities
- 5.4.5 Oil and Gas
- 5.4.6 Retail and E-Commerce
- 5.4.7 Food and Beverage Manufacturing
- 5.4.8 Construction and Infrastructure
- 5.4.9 Government and Public Sector
- 5.4.10 Other End-User Industries
- 5.5 By Geography
- 5.5.1 North America
- 5.5.1.1 United States
- 5.5.1.2 Canada
- 5.5.1.3 Mexico
- 5.5.2 South America
- 5.5.2.1 Brazil
- 5.5.2.2 Rest of South America
- 5.5.3 Europe
- 5.5.3.1 Germany
- 5.5.3.2 United Kingdom
- 5.5.3.3 France
- 5.5.3.4 Italy
- 5.5.3.5 Spain
- 5.5.3.6 Russia
- 5.5.3.7 Rest of Europe
- 5.5.4 Asia-Pacific
- 5.5.4.1 China
- 5.5.4.2 India
- 5.5.4.3 Japan
- 5.5.4.4 South Korea
- 5.5.4.5 Australia
- 5.5.4.6 Rest of Asia-Pacific
- 5.5.5 Middle East
- 5.5.5.1 Turkey
- 5.5.5.2 Saudi Arabia
- 5.5.5.3 United Arab Emirates
- 5.5.5.4 Rest of Middle East
- 5.5.6 Africa
- 5.5.6.1 South Africa
- 5.5.6.2 Nigeria
- 5.5.6.3 Rest of Africa
- 5.5.1 North America
6 COMPETITIVE LANDSCAPE
- 6.1 Market Concentration
- 6.2 Strategic Moves
- 6.3 Market Share Analysis
- 6.4 Company Profiles (includes Global Level Overview, Market Level Overview, Core Segments, Financials as available, Strategic Information, Market Rank/Share, Products and Services, Recent Developments)
- 6.4.1 Oracle Corporation
- 6.4.2 International Business Machines Corporation
- 6.4.3 SAP SE
- 6.4.4 SAS Institute Inc.
- 6.4.5 Teradata Corporation
- 6.4.6 C3.ai, Inc.
- 6.4.7 Palantir Technologies Inc.
- 6.4.8 Verdigris Technologies
- 6.4.9 Aspen Technology, Inc.
- 6.4.10 Schneider Electric SE
- 6.4.11 AVEVA Group Limited
- 6.4.12 Eaton Corporation
- 6.4.13 Bidgely, Inc.
- 6.4.14 EnergyCAP, LLC
- 6.4.15 GridPoint, Inc.
- 6.4.16 Uplight, Inc.
- 6.4.17 Energyworx B.V.
- 6.4.18 Spacewell International NV
- 6.4.19 Sense Labs, Inc.
- 6.4.20 Smarter Grid Solutions Limited
7 MARKET OPPORTUNITIES AND FUTURE OUTLOOK
- 7.1 White Space and Unmet Need Assessment


