|
시장보고서
상품코드
2072954
그린 코드 분석 및 최적화 소프트웨어 시장 : 점유율 분석, 업계 동향과 통계, 성장 예측(2026-2031년)Green Code Analysis and Optimization Software - Market Share Analysis, Industry Trends & Statistics, Growth Forecasts (2026 - 2031) |
||||||
 Mordor Intelligence
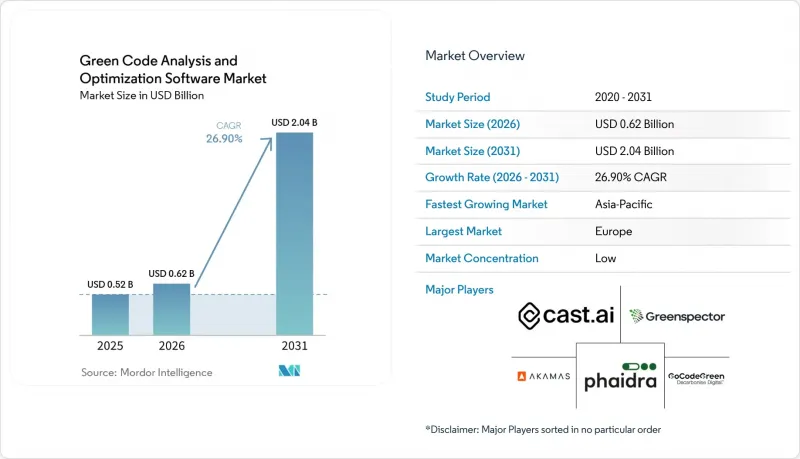
Mordor Intelligence에 의하면, 그린 코드 분석 및 최적화 소프트웨어 시장 규모는 2025년에 5억 2,000만 달러, 2026년에 6억 2,000만 달러되어, 2031년까지 20억 4,000만 달러에 이를 것으로 예측되며, 2026년부터 2031년까지 CAGR 26.9%로 성장할 전망입니다.
본 보고서는 솔루션 유형(탄소 배출량 측정 및 코드 분석 등), 도입 형태(클라우드, 하이브리드, On-Premise), 기업 규모(대기업, 중소기업), 최종 이용 산업(IT 및 통신, 은행, 금융서비스 및 보험(BFSI), 산업 제조 등) 및 지역별로 분류되어 있습니다. 시장 전망은 금액(달러) 기준으로 제시되어 있습니다.
전 세계 그린 코드 분석 및 최적화 소프트웨어 시장 동향과 인사이트
강화되는 소프트웨어 탄소 거버넌스 요건
기업 소프트웨어 팀은 더 이상 환경 정보 공개 속도를 독자적으로 결정할 수 없습니다. 왜냐하면, 외부 규제에 따라 그 일정이 정해져 있기 때문입니다. CSRD 1단계에서는 대규모 상장 기업에 대해 2024 회계연도의 소프트웨어 관련 배출량 공시가 의무화되었으며, 2025년에 보고가 이루어지게 되었습니다. 이에 따라 소프트웨어 관련 배출량은 내부적인 과제를 넘어 공식적인 보고 관행으로 전환되었습니다. 2026년 2월 24일자 옴니버스 지침에서는 적용 대상이 직원 수 1,000명 이상이고 매출액이 4억 5,000만 유로(5억 900만 달러) 이상인 기업으로 한정되었으나, 대형 구매업체들이 계속해서 설문조사나 계약 조항을 통해 공개 요건을 공급업체에 전가하고 있기 때문에 공급망 전반에 걸친 압박은 여전히 지속되고 있습니다. '소프트웨어 탄소 강도' 프레임워크는 2024년 3월에 ISO/IEC 21031:2024로 공식 제정되었으며, 그린 소프트웨어 재단에 따르면 마이크로소프트, NTT 데이터, AVEVA, UBS 등의 기관이 이미 이를 실용적인 측정 기준으로 적용하고 있다고 합니다. 또한, ISO/IEC TS 20125-1:2026을 통해 두 번째 표준화 트랙도 형성되고 있습니다. 이는 요구사항 수집부터 수명 주기 종료에 이르기까지 디지털 서비스의 전체 수명 주기에 걸친 친환경 설계 요구사항을 규정한 것입니다. 이러한 보고 규정과 기술 표준의 결합을 통해 그린코드 분석 및 최적화 소프트웨어 시장에 직접적인 조달 채널이 제공되고 있습니다. 이는 구매자들이 소프트웨어 공급업체에 코드 배출량의 측정 및 관리 방법을 제시해 줄 것을 점점 더 요구하고 있기 때문입니다.
클라우드 네이티브 환경에서 AI 워크로드 효율화에 대한 압박
AI 워크로드의 경제성 덕분에 소프트웨어 효율성은 더 이상 틈새 분야의 지속가능성 논의가 아니라, 이사회 차원의 예산 문제로 대두되고 있습니다. 전 세계 데이터센터의 전력 소비량은 2025년에 361.6 TWh에 달할 것으로 예상되며, 2030년까지 945 TWh에 이를 것으로 전망되어, 워크로드가 더욱 확대되기 전에 낭비를 줄이도록 기업들에게 강력한 유인을 제공합니다. 2026년 4월, MIT 연구진은 데이터센터 운영자가 배포 전에 워크로드 수준의 전력 소비량을 추정하는 데 도움이 되는 신속한 예측 도구를 발표했습니다. 이는 실제 환경 도입 전의 소프트웨어 검토나 배포 계획에 직접 반영할 수 있습니다. 또한, 구글은 7세대 Ironwood TPU가 이전 세대인 TPU v5p와 비교해 “"Compute Carbon Intensity(연산당 탄소 배출량)"을 3.7배 개선했다고 보고하고 있으며, 이는 하드웨어의 효율은 향상되었지만 소프트웨어 측면에서의 제어가 더 이상 필요하지 않은 것은 아니라는 점을 뒷받침하고 있습니다. 추론 수요가 엔지니어링 팀이 용도 로직을 최적화할 수 있는 속도를 능가하는 속도로 증가하면, 아무리 최고의 하드웨어라 할지라도 비효율적인 소프트웨어 설계나 피할 수 있는 토큰 생성 오버헤드로 인해 그 효과가 상쇄되고 맙니다. 이러한 격차로 인해 그린 코드 분석 및 최적화 소프트웨어 시장이 확대되고 있습니다. 이는 재무팀이 코드의 비효율성을 컴퓨팅 비용의 직접적인 원인으로 간주하게 되었기 때문입니다.
전체 툴체인 전반에 걸친 그린 코드 텔레메트리 표준화가 미흡합니다.
그린 코드 분석 및 최적화 소프트웨어 시장은 여전히 심각한 과제에 직면해 있습니다. 그 이유는 소프트웨어의 탄소 배출량 측정이 아직 모든 툴체인 및 실행 환경에서 표준화되지 않았기 때문입니다. ISO/IEC 21031:2024는 공통된 조사 기법을 제공하지만, 사용자의 도입 여부는 여전히 언어, 서비스, 컨테이너, 클라우드 환경을 아우르는 벤더별 구현 방식에 좌우됩니다. MDPI의 학술지 『Software』에 게재된 연구에 따르면, 측정 단위와 관련된 뿌리 깊은 문제와 주요 클라우드 제공업체의 실시간 에너지 데이터 부족이 지적되었으며, 연구팀은 완벽하게 측정된 실제 데이터가 아닌 추정치에 의존할 수밖에 없는 상황에 처해 있습니다. 그 결과, 구매 담당자가 도구를 동등한 조건에서 비교하기 어려워져, 멀티 클라우드 환경 전반에 걸친 대규모 조달 결정이 지연되고 있습니다. Green Software Foundation의 하드웨어 표준화 노력은 저수준 텔레메트리 지원을 개선하는 것을 목표로 하고 있지만, 업계 전반의 발맞춤을 이루고 채택이 확산되기까지는 일반적으로 시간이 걸립니다. 팀이 프로그래밍 언어와 인프라 계층을 아우르며 일관된 탄소 데이터를 확보할 수 있게 될 때까지는 그린 코드 분석 및 최적화 소프트웨어 시장의 기업 대상 확대가 높은 관심과는 달리 여전히 완만한 속도에 그칠 것으로 보입니다.
부문별 분석
2025년, 그린 코드 분석 및 최적화 소프트웨어 시장에서 "탄소 측정 및 코드 분석"은 29.84%의 점유율을 차지했습니다. 이는 많은 구매자들이 여전히 최적화 단계로 넘어가기 전에 시각화 단계부터 시작하고 있음을 보여줍니다. 이러한 경향은 엔지니어링 팀이 코드 변경, 실행 시 튜닝 또는 조달 결정을 정당화하기 위해 우선 기준선을 수립해야 한다는 실무상의 필요성을 반영하고 있습니다. ISO/IEC 21031:2024로 공식 제정된 "소프트웨어 탄소 강도(SCI)" 방법은 구매자들에게 공통된 기준점을 제공함으로써, 배출량을 일관되게 측정할 수 있는 도구에 대한 수요를 높이고 있습니다. 2025년 12월에 승인된 AI용 SCI 사양은 그 적용 범위를 AI 훈련, 미세 조정, 추론까지 확대함으로써, 그동안 이러한 워크로드에서 소프트웨어 고유의 배출량을 추적하지 않았던 조직들에게 새로운 수요층을 창출했습니다. "그린 SDLC 및 CI/CD 자동화"는 2031년까지 연평균 성장률(CAGR) 27.56%로 확대될 것으로 예측되며, 이는 구매자들이 일회성 감사에서 소프트웨어 제공에 통합된 지속적인 관리로 전환하고 있음을 보여줍니다.
이러한 변화가 중요한 이유는 그린 코드 분석 및 최적화 소프트웨어 업계에서 책임의 소재가 고립된 ESG 팀에서 주류 엔지니어링 실무로 점차 이동하고 있기 때문입니다. 기업들이 탄소 진단 결과를 실질적인 규모 최적화 및 워크로드 대책으로 연결하려는 가운데, 측정과 병행하여 실행 시 최적화 및 리소스 효율화도 확대되고 있습니다. 또한, 지속가능성 분석과 벤치마킹 역시 여전히 중요하며, 구매자는 시정 조치의 우선순위를 결정하기 전에 용도, 팀, 사업 부문을 아우르는 비교 분석이 필요하기 때문입니다. 거버넌스, 컴플라이언스, 인증 도구는 규제가 엄격한 업계에서 주목을 받고 있습니다. 이러한 업계에서는 조달 팀이 보다 광범위한 환경 보고 요구 사항을 충족하고 감사에 대응할 수 있는 문서를 요구하고 있습니다. 마이크로소프트와 공동으로 개발된 테크 마힌드라의 "Green CodeRefiner"는 현대화된 용도의 전체 코드베이스에서 환경 영향 점수가 20%에서 40%까지 개선되었다고 보고하며, 통합된 도구 세트가 단순한 점수 산출에 그치지 않고 측정 가능한 코드 개선 프로그램으로 발전할 수 있음을 입증하고 있습니다.
2025년에는 클라우드가 그린 코드 분석 및 최적화 소프트웨어 시장의 66.12%를 차지했습니다. 이는 소프트웨어의 지속가능성을 위해 가장 먼저 움직이기 시작한 기업의 '클라우드 퍼스트' 자세를 반영하고 있습니다. SaaS를 통한 제공 방식은 이미 역동적인 환경에서 운영되고 있으며, 도구 관리를 일원화하는 것을 선호하는 플랫폼 팀의 경우 도입 장벽을 낮춰줍니다. 주요 공급업체들이 제공하는 네이티브 클라우드 기반 탄소 대시보드 역시 분석 및 최적화를 위해 타사 소프트웨어와 연동할 수 있는 기본적인 데이터 레이어를 제공합니다. 하이브리드 방식은 2031년까지 연평균 성장률(CAGR) 27.34%를 나타낼 것으로 예측되며, 그린코드 분석 및 최적화 소프트웨어 시장에서 가장 빠르게 성장하는 사업 모델이 될 전망입니다. 이러한 성장은 사설 인프라와 퍼블릭 클라우드 모두에서 탄소 가시성을 요구하는 규제 대상 부문에 의해 주도되고 있습니다.
On-Premise 배포의 규모는 여전히 작지만, 국방, 정부, 규제 대상 금융기관 등 주권을 중시하는 환경에서 여전히 중요한 역할을 수행하고 있습니다. 유럽연합 집행위원회는 2026년 4월, '소버린 클라우드 프레임워크'의 일환으로, 4개 통신사에 1억 8,000만 유로(2억 400만 달러) 규모의 계약을 체결하고, 8가지 주권 기준 중 하나로 환경적 지속가능성을 포함시켰습니다. 이는 기밀성이 높은 환경에서도 친환경 성과에 대한 대응이 요구되고 있음을 보여줍니다. 이는 수요가 순수한 클라우드 네이티브 기업에 그치지 않고, 그동안 지속가능성 도구를 선택 사항으로만 여겨왔던 구매자층까지 확대되고 있다는 점에서 중요합니다. 이러한 환경이 현대화됨에 따라, 분산 시스템 전체에 걸친 단일 운영 뷰를 지원하는 하이브리드 텔레메트리의 가치가 높아지고 있습니다. 따라서 그린 코드 분석 및 최적화 소프트웨어 시장에서는 고객에게 단일 인프라 모델을 강요하지 않으면서 클라우드, 사설 인프라, 레거시 환경을 연동할 수 있는 벤더가 우위를 점하게 됩니다.
지역별 분석
2025년, 유럽은 그린 코드 분석 및 최적화 소프트웨어 시장 점유율의 34.67%를 차지하며, 지역별로는 가장 큰 기여도를 보였습니다. 이 지역의 경쟁력은 가장 잘 갖춰진 소프트웨어 지속가능성 환경에서 비롯됩니다. 이곳에서는 CSRD 및 ESRS E1에 따라 기업의 보고 및 조달 과정에서 소프트웨어 관련 배출량이 더욱 가시화되고 있습니다. 2026년 6월 30일부터 적용되는 유럽위원회 시행규칙 EU:2026/718은 탄소중립 기술을 대상으로 하는 공공 조달 절차에 환경 지속가능성에 관한 최소 요건을 추가하고 있으며, 이에 따라 정부 조달 분야에서 소프트웨어 효율성에 대한 검증 가능한 증거에 대한 수요가 증가하고 있습니다. 또한, 유럽집행위원회는 2026년 6월 3일에 '클라우드·AI 개발법'을 제안했습니다. 이 법은 에너지 효율이 높은 데이터센터의 용량과 환경 지속가능성 평가 기준에 명확히 초점을 맞추고 있으며, 지역 인프라에 도입되는 소프트웨어에 대한 하류 측의 압력을 높이고 있습니다. 또한, 유럽에는 SonarSource, Software Improvement Group, Greenspector와 같은 벤더들이 밀집해 있어, 이로 인해 그린 코드 분석 및 최적화 소프트웨어 시장이 구매자와 표준 제정 활동 양쪽 모두와 밀접하게 연결되어 있습니다.
아시아태평양은 2031년까지 연평균 성장률(CAGR) 28.45%를 나타낼 것으로 예측되며, 그린 코드 분석 및 최적화 소프트웨어 시장에서 가장 빠르게 성장하는 지역 부문이 될 전망입니다. 일본에서는 NTT가 2026년 3월에 발표한 "제조부터 폐기에 이르는 소프트웨어 CO₂ 배출량 산정 규칙"을 통해 중요한 정책 및 조달 관련 신호가 전달되고 있습니다. 이를 통해 소프트웨어 수명 주기 측정이 기업의 조달 및 보고 요구 사항과 더욱 밀접하게 부합하게 됩니다. 또한, 이 지역에서는 클라우드의 급속한 확산, 현지 인프라 구축, 그리고 산업 전반에 걸쳐 디지털 서비스가 확대됨에 따라 소프트웨어 효율성에 대한 관심이 높아지고 있습니다. Cast AI가 2025년에 인도와 싱가포르에 개설한 사무소와 그 이후 해당 지역에서 진행된 투자 활동은 각 벤더 기업들이 아시아태평양을 차기 주요 성장 분야로 적극 우선시하고 있음을 보여줍니다. 중국, 인도, 일본, 한국, 호주는 소프트웨어 조달에 대한 압박, 현지화 요건, 클라우드 최적화 요구 사항이 각기 다른 조합으로 존재하며, 이로 인해 각국 수요가 증가하고 있습니다.
북미는 그린 코드 분석 및 최적화 소프트웨어 시장 규모 측면에서 여전히 2위 지역 시장을 유지하고 있습니다. 이는 해당 지역의 대기업들이 이미 클라우드 최적화, AI 인프라 구축, 그리고 FinOps 실천에 적극적으로 나서고 있기 때문입니다. 미국에는 아직 CSRD에 필적할 만한 단일 연방 차원의 보고 체계가 존재하지는 않지만, 주 차원의 기후 변화 관련 설명 책임 요건과 공급망으로부터의 압력으로 인해 소프트웨어 배출량은 여전히 기업의 주요 과제로 자리 잡고 있습니다. 남미는 여전히 소규모 시장이지만, 클라우드 도입 확대와 다국적 바이어들의 보고 기대에 힘입어 성장하고 있습니다. 한편, 중동 및 아프리카는 각국의 디지털화 프로그램이 지속가능성 보고의 필요성과 맞물리기 시작한, 아직 초기 단계에 있는 지역입니다. 아랍에미리트와 사우디아라비아가 앞서 두각을 나타내고 있는 반면, 남아프리카공화국과 나이지리아는 인프라 제약으로 인해 전체 기술 자산에 걸친 원격 측정 데이터의 심도와 일관성이 여전히 제한받고 있어, 다소 완만한 속도로 발전하고 있습니다.
기타 혜택:
- 엑셀 형식 시장 예측(ME) 시트
- 3개월간의 애널리스트 지원
자주 묻는 질문
목차
제1장 서론
제2장 조사 방법
제3장 주요 요약
제4장 시장 구도
제5장 시장 규모와 성장 예측
제6장 경쟁 구도
제7장 시장 기회와 향후 전망
JHS 26.07.03According to Mordor Intelligence, the green code analysis and optimization software market size is projected to be USD 0.52 billion in 2025, USD 0.62 billion in 2026, and reach USD 2.04 billion by 2031, growing at a CAGR of 26.9% from 2026 to 2031.
This report is Segmented by Solution Type (Carbon Measurement and Code Analysis, and More), Deployment Mode (Cloud, Hybrid, and On-Premise), Enterprise Size (Large Enterprises, and Small and Medium-Sized Enterprises), End-Use Industry (IT and Telecom, BFSI, Industrial Manufacturing, and More), and Geography. The Market Forecasts are Provided in Terms of Value (USD).
Global Green Code Analysis and Optimization Software Market Trends and Insights
Rising Software Carbon Governance Requirements
Enterprise software teams are no longer setting their own pace on environmental disclosure because external rules now define the timetable. CSRD Wave 1 required large listed companies to disclose software-related emissions for the financial year 2024, with reporting taking place in 2025, thereby moving software-related emissions from an internal topic into formal reporting practice. The February 24, 2026, Omnibus Directive adjusted applicability to companies with more than 1,000 employees and EUR 450 million in turnover (USD 509 million), but the broader supply-chain pressure persists because large buyers continue to pass disclosure requirements to vendors through questionnaires and contract terms. The Software Carbon Intensity framework was formalized as ISO/IEC 21031:2024 in March 2024, and the Green Software Foundation states that organizations, including Microsoft, NTT DATA, AVEVA, and UBS, are already applying it as a practical measurement base. A second standards track is also forming through ISO/IEC TS 20125-1:2026, which sets ecodesign requirements across the digital service life cycle from requirements gathering to end-of-life. This mix of reporting rules and technical standards is providing the green code analysis and optimization software market with a direct procurement channel, as buyers increasingly want software vendors to demonstrate how code emissions are measured and controlled.
AI Workload Efficiency Pressure in Cloud-Native Environments
The economics of AI workloads are making software efficiency a board-level budget issue rather than a niche sustainability topic. Global data center electricity consumption reached 361.6 TWh in 2025 and is projected to reach 945 TWh by 2030, providing enterprises with a strong incentive to reduce waste before workloads scale further. In April 2026, MIT researchers published a rapid prediction tool that helps data center operators estimate workload-level power use before deployment, which fits directly into pre-production software review and deployment planning. Google also reported that its seventh-generation Ironwood TPUs deliver a 3.7x improvement in Compute Carbon Intensity over the previous TPU v5p generation, confirming that hardware efficiency is improving but not removing the need for software-side control. When inference demand rises faster than engineering teams can optimize application logic, even the best hardware can be offset by wasteful software design and avoidable token-generation overhead. That gap is expanding the market for green code analysis and optimization software, as finance teams now see code inefficiency as a direct driver of compute costs.
Limited Green Code Telemetry Standardization Across Toolchains
The green code analysis and optimization software market still faces a real friction point because software carbon measurement is not yet standardized across all toolchains and runtime environments. ISO/IEC 21031:2024 provides a common methodology, but user adoption still depends on vendor-specific implementations across languages, services, containers, and cloud environments. Research published in MDPI's Software journal highlighted persistent issues with measurement granularity and the lack of real-time energy data from major cloud providers, forcing teams to rely on estimates rather than fully instrumented actuals. That makes it harder for buyers to compare tools on a like-for-like basis and slows large procurement decisions across multi-cloud estates. The Green Software Foundation's hardware standards work is intended to improve lower-level telemetry support, but industry alignment and adoption typically take time. Until teams can capture consistent carbon data across languages and infrastructure layers, enterprise rollouts in the green code analysis and optimization software market will continue to move more slowly than interest levels suggest.
Other drivers and restraints analyzed in the detailed report include:
- Code-Level Energy Waste Visibility in CI/CD Pipelines
- FinOps and GreenOps Convergence in Enterprise Engineering Teams
- High Integration Effort With Legacy DevOps and Observability Stacks
For complete list of drivers and restraints, kindly check the Table Of Contents.
Segment Analysis
Carbon Measurement and Code Analysis held 29.84% of the green code analysis and optimization software market share in 2025, which shows that most buyers still begin with visibility before moving to optimization. That pattern reflects the practical need to establish a baseline before engineering teams can justify code changes, runtime tuning, or procurement decisions. The Software Carbon Intensity method, formalized as ISO/IEC 21031:2024, is providing buyers with a common reference point, strengthening demand for tools that can measure emissions consistently. The SCI for AI specification, ratified in December 2025, extended that logic into AI training, fine-tuning, and inference, adding a new demand layer for organizations that did not previously track software-specific emissions in those workloads. Green SDLC and CI/CD Automation is projected to expand at a 27.56% CAGR through 2031, indicating that buyers are moving from stand-alone audits to continuous controls embedded in software delivery.
This change matters because the green code analysis and optimization software industry is shifting accountability away from isolated ESG teams and into mainstream engineering practice. Runtime Optimization and Resource Efficiency are growing alongside measurement, as enterprises seek to translate carbon diagnostics into practical rightsizing and workload actions. Sustainability Analytics and Benchmarking also remain relevant, since buyers need comparison views across applications, teams, and business units before they can prioritize remediation. Governance, Compliance, and Certification tools are gaining traction in regulated sectors, where procurement teams seek audit-ready documentation aligned with broader environmental reporting expectations. Tech Mahindra's Green CodeRefiner, built with Microsoft, reported a 20% to 40% improvement in green impact scores across modernized application codebases, demonstrating that integrated tooling can move beyond scoring into measurable code-improvement programs.
Cloud accounted for a 66.12% share of the green code analysis and optimization software market in 2025, reflecting the cloud-first posture of enterprises that moved earliest toward software sustainability. SaaS delivery lowers deployment friction for platform teams that already operate in dynamic environments and prefer centralized tool administration. Native cloud carbon dashboards from major providers also provide a basic data layer that can connect with third-party software for analysis and optimization. Hybrid deployment is projected to grow at a 27.34% CAGR through 2031, making it the fastest-growing deployment model in the green code analysis and optimization software market. That growth is being driven by regulated sectors that need carbon visibility across both private infrastructure and public cloud.
On-premise deployment remains smaller, but it still serves sovereignty-sensitive environments in defense, government, and regulated financial institutions. The European Commission's Sovereign Cloud Framework awarded an EUR 180 million contract, or USD 204 million, to four providers in April 2026 and included environmental sustainability as 1 of 8 sovereignty criteria, which signals that even sensitive environments are being asked to address green performance. That is important because it broadens demand beyond purely cloud-native organizations and into buyers that previously treated sustainability tooling as optional. As these estates modernize, hybrid telemetry becomes more valuable because it supports a single operating view across distributed systems. The green code analysis and optimization software market, therefore, favors vendors that can connect cloud, private infrastructure, and legacy estates without forcing clients into a single infrastructure model.
Complete Report Scope:
- By Solution Type
- Carbon Measurement and Code Analysis
- Runtime Optimization and Resource Efficiency
- Green SDLC and CI/CD Automation
- Sustainability Analytics and Benchmarking
- Governance, Compliance and Certification
- By Deployment Mode
- Cloud
- Hybrid
- On-Premise
- By Enterprise Size
- Large Enterprises
- Small and Medium-Sized Enterprises
- By End-Use Industry
- IT and Telecom
- BFSI
- Industrial Manufacturing
- Energy and Utilities
- Oil and Gas
- Retail and E-Commerce
- Food and Beverage Manufacturing
- Construction and Infrastructure
- Government and Public Sector
- Other End-User Industries
- By Geography
- North America
- United States
- Canada
- Mexico
- South America
- Brazil
- Rest of South America
- Europe
- Germany
- United Kingdom
- France
- Italy
- Spain
- Russia
- Rest of Europe
- Asia-Pacific
- China
- India
- Japan
- South Korea
- Australia
- Rest of Asia-Pacific
- Middle East
- Turkey
- Saudi Arabia
- United Arab Emirates
- Rest of Middle East
- Africa
- South Africa
- Nigeria
- Rest of Africa
- North America
Geography Analysis
Europe held 34.67% of the green code analysis and optimization software market share in 2025, making it the largest regional contributor. The region's lead comes from the most formal software sustainability environment, where CSRD and ESRS E1 have made software-related emissions more visible in enterprise reporting and procurement. Commission Implementing Regulation EU: 2026/718, applicable from June 30, 2026, adds minimum environmental sustainability requirements to public procurement procedures covering net-zero technologies, thereby strengthening demand for auditable evidence of software efficiency in government buying. The European Commission also proposed the Cloud and AI Development Act on June 3, 2026, with explicit focus on energy-efficient data center capacity and environmental sustainability rating rules, which increases downstream pressure on software deployed in regional infrastructure. Europe also benefits from a dense vendor base that includes SonarSource, Software Improvement Group, and Greenspector, which keeps the green code analysis and optimization software market close to both buyers and standard-setting activity.
Asia-Pacific is projected to grow at a 28.45% CAGR through 2031, making it the fastest-growing regional segment in the green code analysis and optimization software market. Japan is providing an important policy and procurement signal through NTT's March 2026 cradle-to-grave software CO2 calculation rules, which align software life-cycle measurement more closely with enterprise purchasing and reporting needs. The region also combines rapid cloud expansion, local infrastructure build-out, and rising interest in software efficiency as digital services scale across industries. Cast AI's 2025 office openings in India and Singapore, followed by later regional investment activity, show that vendors are actively prioritizing Asia-Pacific as the next major growth zone. China, India, Japan, South Korea, and Australia each add demand through different mixes of software procurement pressures, localization requirements, and cloud-optimization needs.
North America remained the second-largest regional market for green code analysis and optimization software because large enterprises in the region are already active in cloud optimization, AI infrastructure build-out, and FinOps practices. The United States does not yet have a single federal reporting framework equal to CSRD, but state-level climate accountability requirements and supply-chain pressure still keep software emissions on the enterprise agenda. South America is still a smaller market, led by growing cloud adoption and reporting expectations from multinational buyers, while the Middle East and Africa remain earlier-stage regions where national digital programs are beginning to intersect with sustainability reporting needs. The United Arab Emirates and Saudi Arabia are emerging first, while South Africa and Nigeria are moving more gradually because infrastructure constraints still limit the depth and consistency of telemetry across technology estates.
- CAST AI Group Inc.
- Akamas S.p.A.
- Phaidra Inc.
- Digital Tactics Ltd
- Greenspector
- GoCodeGreen Limited
- Software Improvement Group B.V.
- Greenplaces, Inc.
- GreenCode
- Electricity Maps
- CarbonAware
- open source, Green Software Directory
- Ab Ovo B.V.
- SustainAIOps Limited
- Kubex AI, Inc.
- EAR, Energy Aware Runtime
- EcoCode
- ecoCode
- CodeScene AB
- SonarSource S.A.
- CAST Software B.V.
Additional Benefits:
- The market estimate (ME) sheet in Excel format
- 3 months of analyst support
TABLE OF CONTENTS
1 INTRODUCTION
- 1.1 Study Assumptions and Market Definition
- 1.2 Scope of the Study
2 RESEARCH METHODOLOGY
3 EXECUTIVE SUMMARY
4 MARKET LANDSCAPE
- 4.1 Market Overview
- 4.2 Market Drivers
- 4.2.1 Rising Software Carbon Governance Requirements
- 4.2.2 Code-Level Energy Waste Visibility In CI/CD Pipelines
- 4.2.3 AI Workload Efficiency Pressure In Cloud-Native Environments
- 4.2.4 FinOps and GreenOps Convergence In Enterprise Engineering Teams
- 4.2.5 Carbon-Aware Application Scheduling And Runtime Optimization
- 4.2.6 Sustainability-by-Design Procurement Clauses From Large Buyers
- 4.3 Market Restraints
- 4.3.1 Limited Green Code Telemetry Standardization Across Toolchains
- 4.3.2 Fragmented Developer Buy-In Beyond Core Platform Teams
- 4.3.3 High Integration Effort With Legacy DevOps And Observability Stacks
- 4.3.4 Ambiguous Short-Term ROI For Code-Only Optimization Programs
- 4.4 Impact of Macroeconomic Factors on the Market
- 4.5 Industry Value-Chain Analysis
- 4.6 Regulatory Landscape
- 4.7 Technological Outlook
- 4.8 Porter's Five Forces Analysis
- 4.8.1 Bargaining Power of Buyers
- 4.8.2 Bargaining Power of Suppliers
- 4.8.3 Threat of New Entrants
- 4.8.4 Threat of Substitutes
- 4.8.5 Intensity of Competitive Rivalry
5 MARKET SIZE AND GROWTH FORECASTS (VALUE)
- 5.1 By Solution Type
- 5.1.1 Carbon Measurement and Code Analysis
- 5.1.2 Runtime Optimization and Resource Efficiency
- 5.1.3 Green SDLC and CI/CD Automation
- 5.1.4 Sustainability Analytics and Benchmarking
- 5.1.5 Governance, Compliance and Certification
- 5.2 By Deployment Mode
- 5.2.1 Cloud
- 5.2.2 Hybrid
- 5.2.3 On-Premise
- 5.3 By Enterprise Size
- 5.3.1 Large Enterprises
- 5.3.2 Small and Medium-Sized Enterprises
- 5.4 By End-Use Industry
- 5.4.1 IT and Telecom
- 5.4.2 BFSI
- 5.4.3 Industrial Manufacturing
- 5.4.4 Energy and Utilities
- 5.4.5 Oil and Gas
- 5.4.6 Retail and E-Commerce
- 5.4.7 Food and Beverage Manufacturing
- 5.4.8 Construction and Infrastructure
- 5.4.9 Government and Public Sector
- 5.4.10 Other End-User Industries
- 5.5 By Geography
- 5.5.1 North America
- 5.5.1.1 United States
- 5.5.1.2 Canada
- 5.5.1.3 Mexico
- 5.5.2 South America
- 5.5.2.1 Brazil
- 5.5.2.2 Rest of South America
- 5.5.3 Europe
- 5.5.3.1 Germany
- 5.5.3.2 United Kingdom
- 5.5.3.3 France
- 5.5.3.4 Italy
- 5.5.3.5 Spain
- 5.5.3.6 Russia
- 5.5.3.7 Rest of Europe
- 5.5.4 Asia-Pacific
- 5.5.4.1 China
- 5.5.4.2 India
- 5.5.4.3 Japan
- 5.5.4.4 South Korea
- 5.5.4.5 Australia
- 5.5.4.6 Rest of Asia-Pacific
- 5.5.5 Middle East
- 5.5.5.1 Turkey
- 5.5.5.2 Saudi Arabia
- 5.5.5.3 United Arab Emirates
- 5.5.5.4 Rest of Middle East
- 5.5.6 Africa
- 5.5.6.1 South Africa
- 5.5.6.2 Nigeria
- 5.5.6.3 Rest of Africa
- 5.5.1 North America
6 COMPETITIVE LANDSCAPE
- 6.1 Market Concentration
- 6.2 Strategic Moves
- 6.3 Market Share Analysis
- 6.4 Company Profiles (includes Global Level Overview, Market Level Overview, Core Segments, Financials as available, Strategic Information, Market Rank/Share, Products and Services, Recent Developments)
- 6.4.1 CAST AI Group Inc.
- 6.4.2 Akamas S.p.A.
- 6.4.3 Phaidra Inc.
- 6.4.4 Digital Tactics Ltd
- 6.4.5 Greenspector
- 6.4.6 GoCodeGreen Limited
- 6.4.7 Software Improvement Group B.V.
- 6.4.8 Greenplaces, Inc.
- 6.4.9 GreenCode
- 6.4.10 Electricity Maps
- 6.4.11 CarbonAware
- 6.4.12 open source, Green Software Directory
- 6.4.13 Ab Ovo B.V.
- 6.4.14 SustainAIOps Limited
- 6.4.15 Kubex AI, Inc.
- 6.4.16 EAR, Energy Aware Runtime
- 6.4.17 EcoCode
- 6.4.18 ecoCode
- 6.4.19 CodeScene AB
- 6.4.20 SonarSource S.A.
- 6.4.21 CAST Software B.V.
7 MARKET OPPORTUNITIES AND FUTURE OUTLOOK
- 7.1 White-Space and Unmet-Need Assessment