
|
시장보고서
상품코드
2073094
배출 계수 라이브러리 및 탄소 인텔리전스 소프트웨어 시장 : 점유율 분석, 업계 동향과 통계, 성장 예측(2026-2031년)Emissions Factor Library and Carbon Intelligence Software - Market Share Analysis, Industry Trends & Statistics, Growth Forecasts (2026 - 2031) |
||||||
 Mordor Intelligence
Mordor Intelligence에 의하면, 배출 계수 라이브러리 및 탄소 인텔리전스 소프트웨어 시장 규모는 2025년 18억 6,000만 달러에서 2026년에는 21억 9,000만 달러로 확대되어 2031년까지 49억 3,000만 달러에 이를 것으로 예상되고 있어 2026-2031년까지 CAGR 17.62%로 성장할 전망입니다.
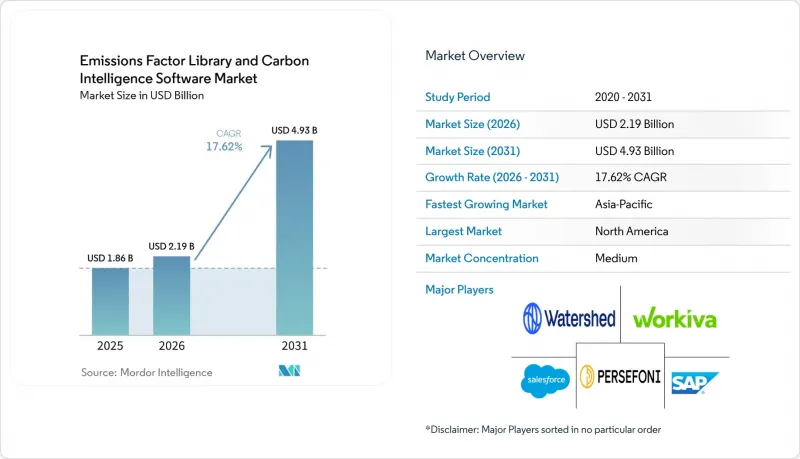
본 보고서는 구성 요소(소프트웨어 및 서비스), 도입 형태(클라우드 기반, On-Premise형, 하이브리드형), 용도(탄소 회계, 보고, 규정 준수, 배출량 추적 및 모니터링, 기타), 최종 사용자 산업(제조업, 에너지 및 유틸리티, 기타), 지역별로 분류되어 있습니다. 시장 전망은 금액(달러) 기준으로 제시되어 있습니다.
전 세계 배출 계수 라이브러리 및 탄소 인텔리전스 소프트웨어 시장 동향 및 인사이트
기후 관련 정보 공개 의무 및 감사 대응 준비
보고 기한으로 인해 구조화된 데이터 수집 및 문서화된 산정 기법이 직접적으로 필요하기 때문에 공개 의무는 배출 계수 라이브러리 및 탄소 인텔리전스 소프트웨어 시장에 있어 여전히 가장 강력한 단기적 촉진요인으로 작용하고 있습니다. 이러한 압박은 배출 총량의 공표에만 그치지 않습니다. 왜냐하면, 보증 요건에는 감사인이 정보 출처 데이터, 조사 방법, 배출 계수 전반에 걸쳐 확인할 수 있는 추적 가능한 기록도 요구되기 때문입니다. 이에 따라 배출 계수 라이브러리 및 탄소 인텔리전스 소프트웨어 시장은 더욱 강력한 감사 로그, 체계적인 워크플로우, 온실가스(GHG) 산정 기준과의 보다 명확한 연동을 갖춘 플랫폼으로 발전해 나가고 있습니다. 또한, ISO 14064-3가 실무상의 보증 업무 방식을 계속해서 형성하고 있기 때문에 타당성 확인과 검증의 역할도 더욱 중요해지고 있습니다. 그 결과, 배출 계수 라이브러리 및 탄소 인텔리전스 소프트웨어 시장의 구매자들은 더 이상 공개용 결과물만을 요구하지 않고, 제한적 보증은 물론 향후 보고 심사 기준이 더욱 엄격해지더라도 견딜 수 있는 시스템을 원하고 있습니다.
전체 공급망 전반에 걸친 Scope 3 데이터 품질에 대한 압박
스코프 3 배출량은 소프트웨어 수요의 양상을 계속해서 변화시키고 있습니다. 이는 공급업체나 가치사슬에서 발생하는 배출량이 기업의 탄소 발자국의 상당 부분을 차지하는 경우가 많기 때문입니다. 기업들은 3가지 배출 범위 모두에 걸친 보고를 확대하고 있지만, 공급업체 데이터의 확보 가능성과 내부 데이터의 품질은 여전히 일상적인 실행에 있어 큰 걸림돌로 남아 있습니다. 이러한 상황에 따라 배출 계수 라이브러리 및 탄소 인텔리전스 소프트웨어 시장은 단순한 공개 도구에서 벗어나, 공급업체와의 연계, 배출원 수준의 증거 확보, 보다 체계적인 할당을 지원할 수 있는 시스템으로 전환되고 있습니다. 스코프 3 지침 개정안에 따라 일반적인 지출 기반 접근법의 지속가능성이 점차 약화되고 있으며, 1차 공급업체 데이터와 보다 견고한 데이터 거버넌스의 필요성이 대두되고 있습니다. 배출 계수 라이브러리 및 탄소 인텔리전스 소프트웨어 시장에서 이는 데이터 수집, 계수 관리, 워크플로우 제어를 단일 환경에서 통합할 수 있는 공급업체에게 유리하게 작용하고 있습니다.
단편적이고 일관성이 없는 배출계수 조사 방법
배출 계수 라이브러리 및 탄소 인텔리전스 소프트웨어 시장에서는 GHG 프로토콜, ISO 14064, PCAF, ESRS와 관련된 보고 요건 및 부문별 고유 방법론이 중복되어 여전히 마찰이 발생하고 있습니다. 벤더는 계산 엔진을 여러 프레임워크에 통합하는 동시에, 고객이 서로 다른 규정 준수 요건 하에서 단일 배출 인벤토리를 보고할 수 있도록 지원해야 합니다. 이로 인해 제품의 복잡성이 증가함에 따라, 배출 계수 라이브러리 및 탄소 인텔리전스 소프트웨어 시장에서 규격 개정이 공급업체와 구매자 모두에게 더 큰 혼란을 초래하게 될 것입니다. 또한, 조사 방법의 선정, 관리, 정기적인 갱신에 전념할 수 있는 사내 기술 인력을 보유하고 있지 않은 중견 기업 사용자에게는 이는 추가적인 부담이 됩니다. 그 결과, 조사 방법의 세분화로 인해, 간단한 도구를 필요로 하면서도 복잡한 공시 요건에 직면해 있는 배출 계수 라이브러리 및 탄소 인텔리전스 소프트웨어 시장의 일부에서 도입 속도가 둔화되고 있습니다.
부문별 분석
2025년에는 소프트웨어가 총매출의 78.41%를 차지했으며, 배출 계수 라이브러리 및 탄소 인텔리전스 소프트웨어 시장의 이 부문은 플랫폼 구독 및 기업 소프트웨어 도입을 중심으로 성장했습니다. 대부분의 대량 구매자들이 여전히 더 강력한 관리 기능을 갖추고, 탄소 데이터를 재무, 조달, 공급망 워크플로우에 통합할 수 있는 시스템을 선호함에 따라, 소프트웨어 부문은 계속해서 지배적인 위치를 유지했습니다. 탄소 회계 소프트웨어 산업에서도 플랫폼이 ERP나 보고 프로세스와 한 번 연동되면 전환 비용이 높아진다는 점이 소프트웨어의 장점으로 작용하고 있습니다. 이로 인해 구매자가 도입 지원이나 도메인 지원을 더 많이 요구하게 되더라도 수익 기반은 안정적입니다.
서비스 부문은 2026년부터 2031년까지 연평균 성장률(CAGR) 19.67%를 나타낼 것으로 예측되며, 배출 계수 라이브러리 및 탄소 인텔리전스 소프트웨어 시장에서 가장 빠르게 성장하는 부문으로 꼽히고 있습니다. 사내에 숙련된 팀을 갖추지 못한 기업의 경우, 인벤토리 설계, 보증 준비, 조사 방법의 통합이 어렵기 때문에 이에 대한 수요가 증가하고 있습니다. 따라서 배출 계수 라이브러리 및 탄소 인텔리전스 소프트웨어 시장에서는 소프트웨어 이용 권한과 자문 지원 서비스를 결합한 관리형 서비스 모델이 증가하고 있습니다. 이러한 경향은 Normative가 2026년에 “Carbon Inventory Managed Services”를 도입하여, 시작 후 6주 만에 GHG 프로토콜 인증을 획득하고 1,000시간 이상의 전담 고객 지원을 제공했다고 보고했을 때 특히 두드러졌습니다. 향후에는 소프트웨어 플랫폼의 핵심적인 역할을 훼손하지 않으면서, 수익 구조가 번들형 서비스로 전환될 것으로 예측됩니다.
2025년에는 클라우드 기반 도입이 매출의 69.94%를 차지했습니다. 이는 배출 계수 라이브러리 및 탄소 인텔리전스 소프트웨어 시장이 SaaS 중심의 구조를 띠고 있으며, 여러 거점과 공급업체에 걸쳐 방대한 양의 활동 데이터를 처리해야 할 필요성을 반영한 것입니다. 클라우드 시스템은 확장 및 업데이트가 용이하고, 공시 및 감사 준비에 사용되는 외부 데이터 흐름과의 연동도 용이하기 때문에 여전히 매력적입니다. 이는 보고 주기가 정기적이며 데이터 양이 여전히 증가하고 있는 배출 계수 라이브러리 및 탄소 인텔리전스 소프트웨어 시장에서 특히 중요한 점입니다. 또한 구매자들은 완전한 On-Premise 도입에 비해 클라우드 도구의 설정 부담이 적다는 점을 계속해서 높이 평가했습니다.
하이브리드 방식은 2026년부터 2031년까지 연평균 성장률(CAGR) 18.83%를 나타낼 것으로 예측되며, 이러한 성장은 규모와 관리 사이에서 보다 현실적인 균형을 반영하고 있습니다. 다국적 기업은 클라우드 기반 분석 기능을 필요로 하는 경우가 많은 반면, 사내 정책이나 관할 지역별 데이터 처리 요건에 따라 일부 데이터는 On-Premise 또는 기존 엔터프라이즈 환경 내에 보관해야 할 필요도 있습니다. 배출 계수 라이브러리 및 탄소 인텔리전스 소프트웨어 시장은 계산, 데이터 관리, 보고서 생성 등을 여러 환경에 걸쳐 수행할 수 있도록 하는 아키텍처를 통해 이에 대응하고 있습니다. Sweep이 2026년에 AWS와 통합된 클라우드 배출량 측정 솔루션을 출시한 것은 각 벤더들이 추적 가능한 보고 체계 내에서 클라우드 데이터 흐름을 통합하려 하고 있음을 보여줍니다. 보증 및 데이터 계보에 대한 요건이 더욱 엄격해짐에 따라, 이는 하이브리드 배포의 추가적인 확대에 기여할 것으로 보입니다.
지역별 분석
2025년, 북미는 매출 점유율의 36.44%를 차지하며 배출 계수 라이브러리 및 탄소 인텔리전스 소프트웨어 시장에서 가장 규모가 큰 지역 블록이 되었습니다. 이 지역은 이미 성숙한 보고, 조달, 재무 시스템을 운영하고 있는 대기업들이 집중되어 있다는 장점이 있어, 플랫폼 통합이 용이합니다. 또한, 캘리포니아주의 공개 일정에 따라 2026년에 구조화된 스코프 1 및 스코프 2 보고가 필요하며, 그 후 스코프 3 요건도 이어질 예정인 기업들 사이에서 단기적인 구매의 시급성이 높아지고 있습니다. 배출 계수 라이브러리 및 탄소 인텔리전스 소프트웨어 시장에서 이로 인해 북미는 규정 준수 수요와 기업의 대비 태세가 강력하게 결합된 상황을 보이고 있습니다.
아시아태평양은 2031년까지 연평균 성장률(CAGR) 22.81%를 나타낼 것으로 예측되며, 배출 계수 라이브러리 및 탄소 인텔리전스 소프트웨어 시장에서 가장 빠르게 성장하는 지역으로 부상하고 있습니다. 이러한 성장은 일본, 호주, 싱가포르, 한국, 중국에서 의무화 또는 단계적 공개 움직임이 뒷받침하고 있으며, 이에 따라 해당 지역의 공식 탄소 데이터 시스템에 대한 수요가 확대되고 있습니다. 또한, 이 지역은 세계 제조 공급망에서 차지하는 역할 덕분에 혜택을 누리고 있습니다. 이는 공급업체 차원의 배출량 정보 제공 요청이 아시아태평양 생산 네트워크의 더 깊은 부분까지 미치고 있기 때문입니다. 이에 따라 배출 계수 라이브러리 및 탄소 인텔리전스 소프트웨어 시장은 대형 상장 기업뿐만 아니라, 스코프 3 보고 요구 사항이 있는 국제적인 고객에게 서비스를 제공하는 공급업체에게도 중요한 요소가 되고 있습니다. 인도 역시, “기업의 사회적 책임 및 지속가능성 보고서(BRSR)”프레임워크를 통해 그 기세가 점점 더 커지고 있으며, 이는 온실가스(GHG) 인벤토리 도구에 대한 보다 체계적인 관심을 촉진하고 있습니다.
유럽은 2025년에도 여전히 2위 지역 시장이며, 수요는 보다 정교한 기후 보고서에 대한 기대와 보증 필요성에 직면한 대기업에 집중되어 있습니다. 2026년에 CSRD의 적용 범위가 축소된다 하더라도, 적용 대상에 남아 있는 기업들은 구매력이 높은 고객층을 구성하고 있으며, 이것이 엔터프라이즈급 지출의 지속을 뒷받침하고 있습니다. 남미는 여전히 신흥 시장으로서의 기회를 제공하고 있으며, 해당 시장의 진출은 다국적 기업의 보고 요건과 연계된 광업, 농업, 소비재 부문에 집중되어 있습니다. 중동 및 아프리카는 배출 계수 라이브러리 및 탄소 인텔리전스 소프트웨어 시장에서 여전히 초기 단계에 있으며, 해당 시장의 도입은 완전히 성숙한 현지 수요라기보다는 각국의 넷제로 프로그램, 다국적 기업의 자회사, 외부와의 협력을 통한 정보 공개 요구에 의해 주도되고 있습니다.
기타 혜택
- 엑셀 형식 시장 예측(ME) 시트
- 3개월간의 애널리스트 지원
목차
제1장 서론
제2장 조사 방법
제3장 주요 요약
제4장 시장 구도
제5장 시장 규모와 성장 예측
제6장 경쟁 구도
제7장 시장 기회와 향후 전망
JHSAccording to Mordor Intelligence, the emissions factor library and carbon intelligence software market size is expected to increase from USD 1.86 billion in 2025 to USD 2.19 billion in 2026 and reach USD 4.93 billion by 2031, growing at a CAGR of 17.62% over 2026 to 2031.
This report is Segmented by Component (Software, and Services), Deployment (Cloud-Based, On-Premises, and Hybrid), Application (Carbon Accounting, Reporting, and Compliance, Emissions Tracking and Monitoring, and More), End User Industry (Manufacturing, Energy and Utilities, and More), and Geography. The Market Forecasts are Provided in Terms of Value (USD).
Global Emissions Factor Library and Carbon Intelligence Software Market Trends and Insights
Mandatory Climate Disclosure and Audit Readiness
Mandatory disclosure remains the strongest near-term trigger for the emissions factor library and carbon intelligence software market because reporting deadlines create a direct need for structured data collection and documented calculation methods. The pressure is not limited to publishing emissions totals, because assurance requirements also require traceable records that auditors can review across source data, methodologies, and emissions factors. This is pushing the emissions factor library and carbon intelligence software market toward platforms with stronger audit logs, controlled workflows, and clearer linkage to GHG accounting standards. The role of validation and verification has also become more important as ISO 14064-3 continues to shape how assurance work is carried out in practice. As a result, buyers in the emissions factor library and carbon intelligence software market are no longer looking only for disclosure outputs, they are also looking for systems that can stand up to limited assurance and future upgrades in reporting scrutiny.
Scope 3 Data Quality Pressure Across Supplier Networks
Scope 3 emissions continue to reshape software demand because supplier and value chain emissions often make up the largest part of a company's footprint. Companies are expanding reporting across all 3 emissions scopes, but supplier data availability and internal data quality remain major barriers in day-to-day implementation. This is moving the emissions factor library and carbon intelligence software market away from narrow disclosure tools and toward systems that can support supplier engagement, source-level evidence, and more controlled allocations. Proposed revisions to Scope 3 guidance are also making generic spend-based approaches less durable, which increases the need for primary supplier data and stronger data governance. In the emissions factor library and carbon intelligence software market, this favors vendors that can connect data collection, factor management, and workflow control in a single environment.
Fragmented and Inconsistent Emissions Factor Methodologies
The emissions factor library and carbon intelligence software market still faces friction from the overlap between GHG Protocol, ISO 14064, PCAF, ESRS-linked reporting needs, and sector-specific methods. Vendors must keep calculation engines aligned with more than one framework, while also helping customers report a single emissions inventory across different compliance settings. This increases product complexity and makes standard revisions more disruptive for both suppliers and buyers in the emissions factor library and carbon intelligence software market. It also creates a heavier burden for midmarket users that do not have internal technical staff focused on methodology choices, controls, and periodic updates. The result is that methodology fragmentation slows adoption in parts of the emissions factor library and carbon intelligence software market where buyers need simple tools but face complex disclosure expectations.
Other drivers and restraints analyzed in the detailed report include:
- Emissions Factor Library Version Control and Traceability Demand
- AI-Enabled Activity-to-Factor Matching
- Low Quality Supplier Activity Data for Scope 3 Mapping
For complete list of drivers and restraints, kindly check the Table Of Contents.
Segment Analysis
Software held 78.41% of total revenue in 2025, which kept this part of the emissions factor library and carbon intelligence software market centered on platform subscriptions and enterprise software deployments. The software category remained dominant because most large buyers still prefer systems that can bring carbon data into finance, procurement, and supply chain workflows with stronger controls. In the carbon accounting software industry, software also benefits from higher switching costs once a platform is connected to ERP and reporting processes. This keeps the revenue base stable even as buyers ask for more implementation help and domain support.
Services are projected to grow at a 19.67% CAGR from 2026 to 2031, which makes it the fastest-moving component in the emissions factor library and carbon intelligence software market. Demand is rising because inventory design, assurance preparation, and methodology alignment are difficult for companies that lack trained in-house teams. The emissions factor library and carbon intelligence software market is, therefore, seeing more managed service models that combine access to software with advisory and support layers. That pattern was visible when Normative introduced Carbon Inventory Managed Services in 2026 and reported more than 1,000 hours of dedicated GHG Protocol-certified client support in the first 6 weeks. Over time, this should shift revenue mix toward bundled offerings without displacing the central role of software platforms.
Cloud-Based deployment held 69.94% of revenue in 2025, which reflected the SaaS-led structure of the emissions factor library and carbon intelligence software market and the need to process large volumes of activity data across sites and suppliers. Cloud systems remain attractive because they are easier to scale, update, and connect to external data flows used in disclosure and audit preparation. This is especially relevant in the emissions factor library and carbon intelligence software market, where reporting cycles are recurring, and data volumes are still rising. Buyers also continue to value the lower setup burden of cloud tools when compared with fully local implementations.
Hybrid deployment is expected to grow at an 18.83% CAGR from 2026 to 2031, and that growth reflects a more practical balance between scale and control. Multinational companies often need cloud-based analytics, but they also need to keep some data within local or existing enterprise environments because of internal policy or jurisdiction-specific data handling needs. The emissions factor library and carbon intelligence software market is responding with architectures that allow calculations, data custody, and reporting outputs to sit across more than one environment. Sweep's 2026 launch of an AWS-integrated cloud emissions measurement solution showed how vendors are trying to unify cloud data flows within traceable reporting structures. This should help hybrid deployments expand further as assurance and data lineage requirements become stricter.
Complete Report Scope:
- By Component
- Software
- Services
- By Deployment
- Cloud-Based
- On-Premises
- Hybrid
- By Application
- Carbon Accounting, Reporting, and Compliance
- Emissions Tracking and Monitoring
- Emissions Factor Library Management
- Sustainability Data Management
- Carbon Intelligence and Analytics
- By End User Industry
- Manufacturing
- Energy and Utilities
- Transportation and Logistics
- Banking, Financial Services, and Insurance (BFSI)
- Retail and Consumer Goods
- Healthcare and Life Sciences
- Information Technology and Telecommunications
- Government and Public Sector
- Other End User Industries
- By Geography
- North America
- United States
- Canada
- Mexico
- South America
- Brazil
- Argentina
- Chile
- Rest of South America
- Europe
- Germany
- United Kingdom
- France
- Italy
- Spain
- Rest of Europe
- Asia-pacific
- China
- Japan
- India
- Australia
- South Korea
- Singapore
- Rest of Asia-pacific
- Middle East
- Saudi Arabia
- United Arab Emirates
- Turkey
- Rest of Middle East
- Africa
- South Africa
- Egypt
- Nigeria
- Rest of Africa
- North America
Geography Analysis
North America held 36.44% revenue share in 2025, which made it the largest regional block in the emissions factor library and carbon intelligence software market. The region benefits from a high concentration of large enterprises that already run mature reporting, procurement, and finance systems, which makes platform integration easier. California's disclosure timetable is also reinforcing near-term buying urgency among companies that need structured Scope 1 and Scope 2 reporting in 2026, with Scope 3 requirements following after that. In the emissions factor library and carbon intelligence software market, this gives North America a strong mix of compliance demand and enterprise readiness.
Asia-Pacific is projected to grow at a 22.81% CAGR through 2031, which makes it the fastest-growing region in the emissions factor library and carbon intelligence software market. Growth is being supported by mandatory or phased disclosure moves in Japan, Australia, Singapore, South Korea, and China, which together widen the regional need for formal carbon data systems. The region also benefits from its role in global manufacturing supply chains because supplier-level emissions requests are moving deeper into Asia-Pacific production networks. This makes the emissions factor library and carbon intelligence software market relevant not only for large listed companies, but also for suppliers serving international customers with Scope 3 reporting needs. India is also adding momentum through its Business Responsibility and Sustainability Reporting framework, which is supporting more structured interest in GHG inventory tools.
Europe remained the second-largest regional market in 2025, with demand centered on large enterprises that face more advanced climate reporting expectations and assurance needs. Even with the narrowed CSRD scope in 2026, the remaining in-scope companies represent the more procurement-capable part of the buyer base, which supports continued enterprise-grade spending. South America remains an emerging opportunity, with adoption concentrated in extractive, agricultural, and consumer-facing sectors that are tied to multinational reporting expectations. The Middle East and Africa remain earlier-stage parts of the emissions factor library and carbon intelligence software market, with adoption driven more by national net-zero programs, multinational subsidiaries, and externally linked disclosure needs than by fully mature local demand.
- Salesforce, Inc.
- Workiva Inc.
- Persefoni AI, Inc.
- Watershed Technology, Inc.
- SAP SE
- IBM Corporation
- Microsoft Corporation
- ENGIE Impact
- Schneider Electric SE
- Sphera Solutions, Inc.
- Cority Software Inc.
- Normative AB
- Sweep SAS
- Position Green AB
- Greenly SAS
- Enablon North America Corporation
- Diligent Corporation
- IsoMetrix Software LLC
- Emitwise Ltd.
Additional Benefits:
- The market estimate (ME) sheet in Excel format
- 3 months of analyst support
TABLE OF CONTENTS
1 INTRODUCTION
- 1.1 Study Assumptions and Market Definition
- 1.2 Scope of the Study
2 RESEARCH METHODOLOGY
3 EXECUTIVE SUMMARY
4 MARKET LANDSCAPE
- 4.1 Market Overview
- 4.2 Market Drivers
- 4.2.1 Mandatory Climate Disclosure and Audit Readiness
- 4.2.2 Scope 3 Data Quality Pressure Across Supplier Networks
- 4.2.3 Emissions Factor Library Version Control and Traceability Demand
- 4.2.4 AI Enabled Activity to Factor Matching
- 4.2.5 Integration With ERP, Procurement, and FinOps Stacks
- 4.2.6 Granular Product and Facility Level Decarbonization Planning
- 4.3 Market Restraints
- 4.3.1 Fragmented and Inconsistent Emissions Factor Methodologies
- 4.3.2 Low Quality Supplier Activity Data for Scope 3 Mapping
- 4.3.3 High Implementation Burden for Midmarket Buyers
- 4.3.4 Limited Assured Factor Coverage for Niche Materials and Emerging Markets
- 4.4 Impact of Macroeconomic Factors on the Market
- 4.5 Industry Value-Chain Analysis
- 4.6 Regulatory Landscape
- 4.7 Technological Outlook
- 4.8 Porter's Five Forces Analysis
- 4.8.1 Bargaining Power of Buyers
- 4.8.2 Bargaining Power of Suppliers
- 4.8.3 Threat of New Entrants
- 4.8.4 Threat of Substitutes
- 4.8.5 Competitive Rivalry
5 MARKET SIZE AND GROWTH FORECASTS (VALUE)
- 5.1 By Component
- 5.1.1 Software
- 5.1.2 Services
- 5.2 By Deployment
- 5.2.1 Cloud-Based
- 5.2.2 On-Premises
- 5.2.3 Hybrid
- 5.3 By Application
- 5.3.1 Carbon Accounting, Reporting, and Compliance
- 5.3.2 Emissions Tracking and Monitoring
- 5.3.3 Emissions Factor Library Management
- 5.3.4 Sustainability Data Management
- 5.3.5 Carbon Intelligence and Analytics
- 5.4 By End User Industry
- 5.4.1 Manufacturing
- 5.4.2 Energy and Utilities
- 5.4.3 Transportation and Logistics
- 5.4.4 Banking, Financial Services, and Insurance (BFSI)
- 5.4.5 Retail and Consumer Goods
- 5.4.6 Healthcare and Life Sciences
- 5.4.7 Information Technology and Telecommunications
- 5.4.8 Government and Public Sector
- 5.4.9 Other End User Industries
- 5.5 By Geography
- 5.5.1 North America
- 5.5.1.1 United States
- 5.5.1.2 Canada
- 5.5.1.3 Mexico
- 5.5.2 South America
- 5.5.2.1 Brazil
- 5.5.2.2 Argentina
- 5.5.2.3 Chile
- 5.5.2.4 Rest of South America
- 5.5.3 Europe
- 5.5.3.1 Germany
- 5.5.3.2 United Kingdom
- 5.5.3.3 France
- 5.5.3.4 Italy
- 5.5.3.5 Spain
- 5.5.3.6 Rest of Europe
- 5.5.4 Asia-pacific
- 5.5.4.1 China
- 5.5.4.2 Japan
- 5.5.4.3 India
- 5.5.4.4 Australia
- 5.5.4.5 South Korea
- 5.5.4.6 Singapore
- 5.5.4.7 Rest of Asia-pacific
- 5.5.5 Middle East
- 5.5.5.1 Saudi Arabia
- 5.5.5.2 United Arab Emirates
- 5.5.5.3 Turkey
- 5.5.5.4 Rest of Middle East
- 5.5.6 Africa
- 5.5.6.1 South Africa
- 5.5.6.2 Egypt
- 5.5.6.3 Nigeria
- 5.5.6.4 Rest of Africa
- 5.5.1 North America
6 COMPETITIVE LANDSCAPE
- 6.1 Market Concentration
- 6.2 Strategic Moves
- 6.3 Market Share Analysis
- 6.4 Company Profiles (includes Global Level Overview, Market Level Overview, Core Segments, Financials as available, Strategic Information, Market Rank/Share, Products and Services, Recent Developments)
- 6.4.1 Salesforce, Inc.
- 6.4.2 Workiva Inc.
- 6.4.3 Persefoni AI, Inc.
- 6.4.4 Watershed Technology, Inc.
- 6.4.5 SAP SE
- 6.4.6 IBM Corporation
- 6.4.7 Microsoft Corporation
- 6.4.8 ENGIE Impact
- 6.4.9 Schneider Electric SE
- 6.4.10 Sphera Solutions, Inc.
- 6.4.11 Cority Software Inc.
- 6.4.12 Normative AB
- 6.4.13 Sweep SAS
- 6.4.14 Position Green AB
- 6.4.15 Greenly SAS
- 6.4.16 Enablon North America Corporation
- 6.4.17 Diligent Corporation
- 6.4.18 IsoMetrix Software LLC
- 6.4.19 Emitwise Ltd.
7 MARKET OPPORTUNITIES AND FUTURE OUTLOOK
- 7.1 White-Space and Unmet-Need Assessment