

|
시장보고서
상품코드
2073108
ESG 분석 및 벤치마킹 플랫폼 시장 : 점유율 분석, 업계 동향과 통계, 성장 예측(2026-2031년)ESG Analytics and Benchmarking Platform - Market Share Analysis, Industry Trends & Statistics, Growth Forecasts (2026 - 2031) |
||||||
 Mordor Intelligence
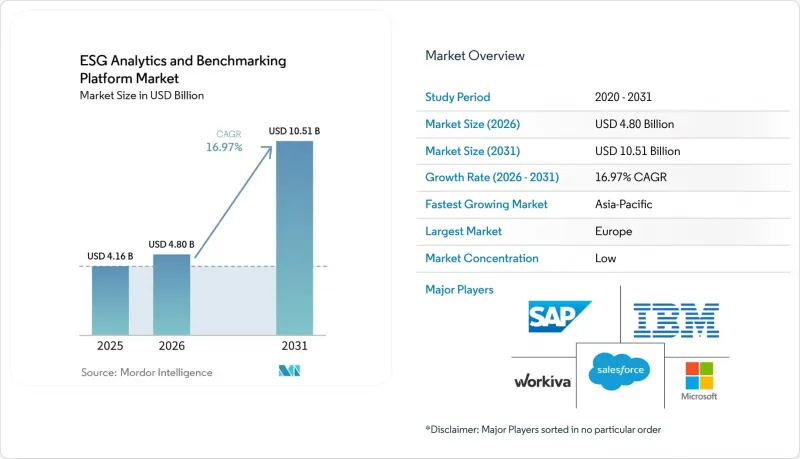
Mordor Intelligence에 의하면, ESG 분석 및 벤치마킹 플랫폼 시장 규모는 2025년에 41억 6,000만 달러, 2026년에 48억 달러가 되어, 2031년까지 105억 1,000만 달러에 이를 것으로 예측되며, 2026년부터 2031년까지 CAGR 16.97%로 성장할 전망입니다.
본 보고서는 도입 형태(클라우드 기반, On-Premise형, 하이브리드형), 제공 형태(소프트웨어 플랫폼 및 서비스), 기업 규모(대기업, 중소기업), 최종 이용 산업(IT 및 통신, 은행, 금융서비스 및 보험(BFSI), 산업 제조, 에너지 및 유틸리티 등) 및 지역별로 분류되어 있습니다. 시장 전망은 금액(달러) 기준으로 제시되어 있습니다.
세계 ESG 분석 및 벤치마킹 플랫폼 시장 동향과 인사이트
감사 가능한 ESG 공시에 대한 수요 증가
보고 의무가 강화됨에 따라 ESG 소프트웨어는 단순한 공시 지원 도구에서 관리형 보고를 위한 운영 체제로 변화하고 있습니다. 현재 기업들은 수작업에 의존한 스프레드시트 집계 방식에 얽매이지 않고, 정기적인 제출 주기, 내부 검토 및 외부 보증을 지원할 수 있는 워크플로우를 필요로 하고 있습니다. 이러한 변화는 ESG 분석 및 벤치마킹 플랫폼 시장에 있어 중요합니다. 규제상의 압박은 직접 보고를 하는 기업뿐만 아니라, 규제 대상 범위에 포함된 사업체와 연계된 다국적 기업 그룹이나 공급망에도 영향을 미치고 있기 때문입니다. 그 결과 발생하는 수요는 보고 규정이 보다 성숙한 지역에서 가장 강하지만, 현지에서 임시방편으로 대처하는 것이 아니라, 단일하고 거버넌스가 확립된 데이터 레이어를 추구하는 전 세계 사업 전반에 걸쳐 유사한 구매 논리가 확산되고 있습니다. 이를 통해 단일 환경 내에서 중복 중요도 평가, 버전 관리, 프레임워크 매핑을 처리할 수 있는 플랫폼의 가치도 높아지고 있습니다. 공시가 재무 보고에 가까워짐에 따라, 구매와 관련된 논의는 단순한 ESG 도구에서 감사 가능한 데이터 인프라로 점차 전환되고 있습니다.
AI를 활용한 파편화된 ESG 데이터의 정규화
AI는 기업이 시스템이나 사업체 간에 일관성이 없는 지속가능성 데이터를 정리하고, 구조화하며, 대조해야 하는 상황에서 가장 유용해지고 있습니다. ESG 분석 및 벤치마킹 플랫폼 시장에서 이는 중요한 의미를 지닙니다. 왜냐하면, 파편화된 입력 데이터는 여전히 벤치마크의 품질을 제한하고 있으며, 특히 기업이 국경을 초월한 비교나 여러 사업 부문 간의 비교가 필요한 경우에는 그 영향이 더욱 두드러지기 때문입니다. IBM은 2026년, Envizi 제품의 업데이트를 통해 이 정규화 계층을 확장했습니다. 이번 업데이트에서는 Excel을 통한 배출량 계산 지원 기능과, 개정된 보고 요건에 맞추어 새로운 프레임워크 설정이 추가되었습니다. 이러한 움직임은 각 벤더들이 ESG 계산을 핵심 비즈니스 워크플로우와 밀접하게 연계하는 동시에, 업데이트에 따른 운영 부담을 줄이려 하고 있음을 보여줍니다. 또한, AI 및 임베디드 계산 도구가 단순한 데이터 수집에서 해석, 벤치마킹, 시나리오 분석 지원으로 경쟁의 초점을 옮기고 있는 이유도 보여주고 있습니다. 이러한 기능이 발전함에 따라, 스코프 3의 적용 범위를 확대하는 데 필요한 시간과 비용은 줄어들고 있습니다.
민간 공급업체 간 ESG 데이터의 품질 격차
ESG 분석 및 벤치마킹 플랫폼 시장의 가장 큰 운영상 약점은 여전히 업스트림 공급업체의 데이터 품질에 있습니다. 2025년에 발표된 OECD의 분석에 따르면, 주요 제품에 걸친 ESG 지표 중 공급망 리스크 관리에 직접적으로 대응하고 있는 지표는 고작 7%에 그친 반면, 성과 지표의 68%는 여전히 입력 기반이며 정성적인 성격이었습니다. 2025년 12월 Sage사의 조사에 따르면, 지속가능성 보고 체계를 갖추고 있는 중소기업은 고작 32%에 불과하며, 62%는 공식 보고의 주요 장애물로 “복잡성”를 예로 들었습니다. 이러한 상황이 중요한 이유는 소규모 공급업체가 기업의 밸류체인에서 큰 비중을 차지하고 있음에도 불구하고, 여전히 감사 가능한 ESG 데이터를 생성할 수 있는 시스템을 갖추지 못한 기업이 많기 때문입니다. 그로 인해 플랫폼 공급업체는 추정 모델, 공급업체 참여 모듈, 데이터 품질 관리에 더욱 의존할 수밖에 없게 되었으며, 그 결과 제품의 복잡성과 서비스 제공에 따른 부담이 증가하고 있습니다. 업스트림 측의 보고 체계가 성숙해지기 전까지는 많은 고객 환경에서 벤치마크의 정확도는 여전히 제각각일 것입니다.
부문별 분석
2025년, ESG 분석 및 벤치마킹 플랫폼 시장에서 클라우드 기반 도입이 66.12%를 차지했습니다. 이 리드는 일회성 사내 IT 변경이 아닌, 지속적인 제품 출시를 통해 규제 변경에 대응할 수 있는 제공 모델의 장점을 반영하고 있습니다. 기업들은 변화하는 보고 프레임워크에 맞추어 공시 논리, 벤치마크 설정, 배출량 산정을 조정하기 위해 클라우드 환경을 활용하고 있습니다. 이로 인해 ESG 분석 및 벤치마킹 플랫폼 시장에서 보다 신속한 도입과 손쉬운 업데이트 주기를 원하는 구매자들에게 클라우드가 기본 선택지로 자리 잡고 있습니다.
하이브리드 시장 규모는 2026년부터 2031년까지 연평균 성장률(CAGR) 17.25%로 확대될 것으로 전망됩니다. 이러한 성장은 기밀성이 높은 직원 데이터, 보상 데이터, 사회 데이터가 반드시 단일 퍼블릭 클라우드 환경으로 이전될 수 있는 것은 아니라는 현실을 반영하고 있습니다. 다국적 기업은 중앙 집중화된 벤치마킹 및 정보 공개 관리를 유지하면서도, 제한된 데이터에 대해서는 현지에서 처리해야 하는 경우가 종종 있습니다. 이러한 균형 덕분에 ESG 분석 및 벤치마킹 플랫폼 시장에서 하이브리드 방식이 계속해서 가장 빠르게 성장하는 전개 패턴이 될 것으로 예측됩니다.
2025년, ESG 분석 및 벤치마킹 플랫폼 시장에서 소프트웨어 플랫폼이 69.45%를 차지했습니다. 기업들은 ESG 데이터 관리, 공시 워크플로우 및 벤치마킹 결과를 단일 거버넌스가 적용된 환경에서 통합할 수 있는 사용자 정의가 가능한 플랫폼을 선호했습니다. 이러한 경향은 보고에 대한 기대가 재무 및 규정 준수 관리에 가까워짐에 따라 더욱 뚜렷해졌습니다. 따라서 감사 추적, 워크플로우 승인, 사용자 수준 접근 제어와 같은 기능들이 ESG 분석 및 벤치마킹 플랫폼 시장에서 소프트웨어의 선도적 지위를 뒷받침하고 있습니다.
서비스 분야는 2026년부터 2031년까지 연평균 성장률(CAGR) 17.05%로 성장할 것으로 전망됩니다. 이러한 확대는 ERP, 조달, 인사, 공급업체, 시설 등 다양한 데이터 소스에 걸쳐 ESG 시스템을 동시에 도입하는 데 따르는 복잡성을 반영하고 있습니다. 많은 기업에서는 사내 데이터를 CSRD, GRI, SASB, CDP, ISSB 등의 프레임워크에 매핑하기 위한 지원이 여전히 필요로 하고 있습니다. 또한, 많은 조직에서는 완전한 도입이나 프레임워크로의 전환을 자체적으로 관리할 수 있을 만큼 충분한 사내 보고 체계가 아직 갖춰지지 않았기 때문에 서비스 수요도 증가하고 있습니다.
지역별 분석
2025년, 유럽은 ESG 분석 및 벤치마킹 플랫폼 시장의 34.56% 점유율을 차지했습니다. 해당 지역이 1위를 차지한 이유는 대기업 전반에 걸쳐 법적 구속력이 있는 공시 규정, 구매자의 기대, 그리고 보고 체계가 가장 견고하게 결합되어 있었기 때문입니다. 이러한 환경은 정기적인 보고 주기의 관리, 보증 준비 및 벤치마크의 일관성을 확보할 수 있는 플랫폼에 대한 수요를 뒷받침했습니다. 또한, 이 지역 시장은 공급망 효과의 혜택도 누리고 있습니다. 이는 대상 범위 내의 대기업들이 구조화된 ESG 데이터 요건을 훨씬 더 광범위한 공급업체 기반에 전가하고 있기 때문입니다. IHK 뮌헨은 2026년에 CSRD의 직접적인 적용 범위에서 제외된 많은 기업들조차도 고객과의 관계를 통해 간접적인 보고 요구에 계속 직면하게 될 것이라고 지적했습니다.
북미 역시 2025년 ESG 분석 및 벤치마킹 플랫폼 시장에서 상당한 점유율을 차지했습니다. 기업의 기후 변화 보고 수요, 투자자들의 면밀한 검토, 그리고 유럽의 공시 요건이 전 세계 기업에 미치는 역외 적용 효과가 해당 지역 수요를 견인했습니다. 유럽에서 사업을 전개하거나, 상장되어 있거나, 공급업체와 연계 관계를 맺고 있는 미국 기반의 다국적 기업들은 현지 규정이 그다지 통일되어 있지 않더라도 보고 체계를 강화할 수밖에 없었습니다. 이로 인해 여러 보고 제도를 동시에 준수해야 하는 기업들 사이에서 플랫폼 도입이 촉진되었습니다. 남미는 여전히 초기 단계에 머물러 있으며, 브라질이 주요 상장 기업들 사이에서 수요를 주도하는 반면, 다른 남미 시장들은 보다 완만한 도입 단계에 머물렀습니다.
아시아태평양은 2026년부터 2031년까지 연평균 성장률(CAGR) 17.45%로 확대될 것으로 예상되며, ESG 분석 및 벤치마킹 플랫폼 시장에서 가장 두드러진 성장을 보일 지역 부문이 될 전망입니다. 이 지역의 성장세는 단일 규제 요인에 대한 의존이라기보다는 사업 운영 전반에 걸쳐 지속가능성이 광범위하게 통합되고 있음을 반영하고 있습니다. 컨퍼런스 보드는 2026년 보고서에서 아시아태평양의 경영진이 전 세계 동종 업계 종사자들보다 기업의 지속가능성을 더 중요하게 여기고 있으며, 이 지역 기업의 50% 이상이 2026년까지 지속가능성 활동을 완전히 통합할 것으로 예상된다고 지적했습니다. 이는 2025년의 36%에서 증가한 수치입니다. 중동 및 아프리카도 소규모 기반에서 성장을 이어가고 있으며, 각국의 지속가능성 정책, 투자자의 심사 요건, 그리고 수출 기업을 대상으로 한 구매자 주도형 공급망 보고 요청 등이 이러한 성장을 뒷받침하고 있습니다.
기타 혜택:
- 엑셀 형식 시장 예측(ME) 시트
- 3개월간의 애널리스트 지원
자주 묻는 질문
목차
제1장 서론
제2장 조사 방법
제3장 주요 요약
제4장 시장 구도
제5장 시장 규모와 성장 예측
제6장 경쟁 구도
제7장 시장 기회와 향후 전망
JHS 26.07.09According to Mordor Intelligence, the ESG analytics and benchmarking platform market size is projected to be USD 4.16 billion in 2025, USD 4.80 billion in 2026, and reach USD 10.51 billion by 2031, growing at a CAGR of 16.97% from 2026 to 2031.
This report is Segmented by Deployment Mode (Cloud-Based, On-Premises, and Hybrid), Offering (Software Platforms, and Services), Enterprise Size (Large Enterprises, and Small and Medium-Sized Enterprises), End-Use Industry (IT and Telecom, BFSI, Industrial Manufacturing, Energy and Utilities, and More), and Geography. The Market Forecasts are Provided in Terms of Value (USD).
Global ESG Analytics and Benchmarking Platform Market Trends and Insights
Rising Demand for Auditable ESG Disclosures
Mandatory reporting is changing ESG software from a disclosure support tool into an operating system for controlled reporting. Companies now need workflows that can support recurring filing cycles, internal review, and external assurance without relying on manual spreadsheet consolidation. That shift is important for the ESG analytics and benchmarking platform market because regulatory pressure now affects not only direct reporters but also multinational groups and supplier networks tied to in-scope entities. The resulting demand is strongest where reporting rules are more mature, but the same buying logic is spreading across global operations that want a single, governed data layer rather than local workarounds. This is also raising the value of platforms that can handle dual materiality, version control, and framework mapping in a single environment. As disclosure moves closer to financial reporting, the buying conversation is shifting from optional ESG tooling to an auditable data infrastructure.
AI-Enabled Normalization of Fragmented ESG Data
AI is becoming most useful where companies need to clean, structure, and reconcile inconsistent sustainability data across systems and entities. In the ESG analytics and benchmarking platform market, that matters because fragmented inputs still limit benchmark quality, especially when enterprises need cross-border or multi-business-unit comparisons. IBM expanded this normalization layer in 2026 through Envizi product updates that supported emissions calculations in Excel and new framework configurations tied to revised reporting needs. Those moves show how vendors are trying to reduce the operational burden of updates while keeping ESG calculations closer to core business workflows. They also show why AI and embedded calculation tools are pushing competition away from simple data capture and toward interpretation, benchmarking, and scenario support. As these capabilities mature, the time and cost required to improve Scope 3 coverage are declining.
ESG Data Quality Gaps Across Private Suppliers
The biggest operating weakness in the ESG analytics and benchmarking platform market is still the quality of upstream supplier data. An OECD analysis published in 2025 found that only 7% of ESG metrics across major products directly addressed supply-chain risk management, while 68% of performance metrics remained input-based and qualitative. A December 2025 Sage study added that only 32% of SMEs had sustainability reporting infrastructure in place, and 62% identified complexity as the main barrier to formal reporting. These conditions matter because small suppliers account for a large share of enterprise value chains, yet many still lack systems capable of producing auditable ESG data. That forces platform vendors to rely more heavily on estimation models, supplier engagement modules, and data quality controls, which raises product complexity and service effort. Until upstream reporting maturity improves, benchmarking depth will remain uneven across many customer environments.
Other drivers and restraints analyzed in the detailed report include:
- Investor Pressure for Comparable ESG Scores
- Procurement-Led Supplier ESG Screening
- Methodology Drift Across Rating and Benchmarking Models
For complete list of drivers and restraints, kindly check the Table Of Contents.
Segment Analysis
Cloud-based deployment accounted for 66.12% of the ESG analytics and benchmarking platform market in 2025. That lead reflects the advantage of delivery models that can absorb regulatory updates through ongoing product releases rather than through one-time internal IT changes. Companies are using cloud environments to keep disclosure logic, benchmark settings, and emissions calculations aligned with changing reporting frameworks. This has made the cloud the default option for buyers who want faster implementation and easier update cycles across the ESG analytics and benchmarking platform market.
Hybrid deployment is projected to expand at 17.25% CAGR from 2026 to 2031. This growth reflects the reality that sensitive workforce, compensation, and social data cannot always move into a single public cloud environment. Multinational companies often need local handling for restricted data while still using centralized benchmarking and disclosure controls. That balance is expected to keep hybrid as the fastest-growing deployment pattern in the ESG analytics and benchmarking platform market.
Software platforms accounted for 69.45% of the ESG analytics and benchmarking platform market in 2025. Enterprises favored configurable platforms that could bring together ESG data management, disclosure workflows, and benchmarking outputs in a single, governed environment. This preference strengthened as reporting expectations moved closer to finance and compliance controls. Audit trails, workflow approvals, and user-level access controls therefore support the leading position of software in the ESG analytics and benchmarking platform market.
Services are projected to grow at 17.05% CAGR from 2026 to 2031. This expansion reflects the complexity of implementing ESG systems across ERP, procurement, HR, supplier, and facility data sources simultaneously. Many companies still need support to map internal data to frameworks such as CSRD, GRI, SASB, CDP, and ISSB. Services are also gaining because many organizations still lack enough in-house reporting depth to manage full deployment and framework translation on their own.
Complete Report Scope:
- By Deployment Mode
- Cloud-Based
- On-Premises
- Hybrid
- By Offering
- Software Platforms
- Services
- By Enterprise Size
- Large Enterprises
- Small and Medium Enterprises
- By End-Use Industry
- IT and Telecom
- BFSI
- Industrial Manufacturing
- Energy and Utilities
- Oil and Gas
- Retail and E-Commerce
- Food and Beverage Manufacturing
- Construction and Infrastructure
- Government and Public Sector
- Other End-User Industries
- By Geography
- North America
- United States
- Canada
- Mexico
- South America
- Brazil
- Argentina
- Rest of South America
- Europe
- Germany
- United Kingdom
- France
- Italy
- Spain
- Russia
- Rest of Europe
- Asia-Pacific
- China
- India
- Japan
- South Korea
- Australia
- Rest of Asia-Pacific
- Middle East and Africa
- Middle East
- Saudi Arabia
- United Arab Emirates
- Rest of Middle East
- Africa
- South Africa
- Nigeria
- Rest of Africa
- Middle East
- North America
Geography Analysis
Europe held 34.56% of the ESG analytics and benchmarking platform market share in 2025. The region led because it had the strongest mix of enforceable disclosure rules, buyer expectations, and reporting discipline across large enterprises. That environment supported demand for platforms that could manage recurring reporting cycles, assurance preparation, and benchmark consistency. The regional market also benefits from supply-chain effects because large in-scope companies pass structured ESG data requirements to a much wider supplier base. IHK Munchen noted in 2026 that many firms removed from direct CSRD scope would still face indirect reporting demands through customer relationships.
North America also accounted for a meaningful share of the ESG analytics and benchmarking platform market in 2025. Enterprise climate reporting needs, investor scrutiny, and the extraterritorial effect of European disclosure requirements on global companies have driven demand in the region. U.S.-based multinationals with operations, listings, or supplier links in Europe have had to strengthen their reporting systems, even where local rules were less uniform. This has supported platform adoption among companies that need to work across multiple reporting regimes simultaneously. South America remained at an earlier stage, with Brazil leading demand among large listed companies, while other South American markets stayed in a more gradual adoption phase.
Asia-Pacific is projected to expand at a 17.45% CAGR from 2026 to 2031, making it the fastest-growing regional segment in the ESG analytics and benchmarking platform market. The region's momentum reflects a broader rise in sustainability integration across business operations rather than reliance on a single regulatory trigger. The Conference Board reported in 2026 that Asia-Pacific executives placed greater emphasis on corporate sustainability than global peers, and that 50% or more of businesses in the region were expected to have fully integrated sustainability operations by 2026, up from 36% in 2025. The Middle East and Africa are also growing from a smaller base, supported by national sustainability agendas, investor screening requirements, and buyer-led supply-chain reporting requests for export-facing companies.
- Microsoft Corporation
- IBM Corporation
- SAP SE
- Salesforce, Inc.
- Wolters Kluwer N.V.
- Workiva Inc.
- Sphera Solutions, Inc.
- Enablon SAS
- Intelex Technologies ULC
- Diligent Corporation
- Cority Software Inc.
- Nasdaq, Inc.
- EcoVadis SAS
- Ulula Inc.
- Novisto Inc.
- SP Global Inc.
- Moody's Corporation
- LSEG Data and Analytics,
- Gensuite LLC
- Persefoni AI, Inc.
Additional Benefits:
- The market estimate (ME) sheet in Excel format
- 3 months of analyst support
TABLE OF CONTENTS
1 INTRODUCTION
- 1.1 Study Assumptions and Market Definition
- 1.2 Scope of the Study
2 RESEARCH METHODOLOGY
3 EXECUTIVE SUMMARY
4 MARKET LANDSCAPE
- 4.1 Market Overview
- 4.2 Market Drivers
- 4.2.1 Rising Demand for Auditable ESG Disclosures
- 4.2.2 Procurement-Led Supplier ESG Screening
- 4.2.3 AI-Enabled Normalization of Fragmented ESG Data
- 4.2.4 Investor Pressure for Comparable ESG Scores
- 4.2.5 Double Materiality Adoption in Reporting Workflows
- 4.2.6 Integration With Enterprise Risk and Finance Systems
- 4.3 Market Restraints
- 4.3.1 ESG Data Quality Gaps Across Private Suppliers
- 4.3.2 Methodology Drift Across Rating and Benchmarking Models
- 4.3.3 High Implementation Burden for Mid-Market Firms
- 4.3.4 Regulatory Fragmentation Across Jurisdictions
- 4.4 Impact of Macroeconomic Factors on the Market
- 4.5 Industry Value / Supply-Chain Analysis
- 4.6 Regulatory Landscape
- 4.7 Technological Outlook
- 4.8 Porter's Five Forces Analysis
- 4.8.1 Threat of New Entrants
- 4.8.2 Bargaining Power of Suppliers
- 4.8.3 Bargaining Power of Buyers
- 4.8.4 Threat of Substitutes
- 4.8.5 Intensity Of Competitive Rivalry
5 MARKET SIZE AND GROWTH FORECASTS (VALUE)
- 5.1 By Deployment Mode
- 5.1.1 Cloud-Based
- 5.1.2 On-Premises
- 5.1.3 Hybrid
- 5.2 By Offering
- 5.2.1 Software Platforms
- 5.2.2 Services
- 5.3 By Enterprise Size
- 5.3.1 Large Enterprises
- 5.3.2 Small and Medium Enterprises
- 5.4 By End-Use Industry
- 5.4.1 IT and Telecom
- 5.4.2 BFSI
- 5.4.3 Industrial Manufacturing
- 5.4.4 Energy and Utilities
- 5.4.5 Oil and Gas
- 5.4.6 Retail and E-Commerce
- 5.4.7 Food and Beverage Manufacturing
- 5.4.8 Construction and Infrastructure
- 5.4.9 Government and Public Sector
- 5.4.10 Other End-User Industries
- 5.5 By Geography
- 5.5.1 North America
- 5.5.1.1 United States
- 5.5.1.2 Canada
- 5.5.1.3 Mexico
- 5.5.2 South America
- 5.5.2.1 Brazil
- 5.5.2.2 Argentina
- 5.5.2.3 Rest of South America
- 5.5.3 Europe
- 5.5.3.1 Germany
- 5.5.3.2 United Kingdom
- 5.5.3.3 France
- 5.5.3.4 Italy
- 5.5.3.5 Spain
- 5.5.3.6 Russia
- 5.5.3.7 Rest of Europe
- 5.5.4 Asia-Pacific
- 5.5.4.1 China
- 5.5.4.2 India
- 5.5.4.3 Japan
- 5.5.4.4 South Korea
- 5.5.4.5 Australia
- 5.5.4.6 Rest of Asia-Pacific
- 5.5.5 Middle East and Africa
- 5.5.5.1 Middle East
- 5.5.5.1.1 Saudi Arabia
- 5.5.5.1.2 United Arab Emirates
- 5.5.5.1.3 Rest of Middle East
- 5.5.5.2 Africa
- 5.5.5.2.1 South Africa
- 5.5.5.2.2 Nigeria
- 5.5.5.2.3 Rest of Africa
- 5.5.5.1 Middle East
- 5.5.1 North America
6 COMPETITIVE LANDSCAPE
- 6.1 Market Concentration
- 6.2 Strategic Moves
- 6.3 Market Share Analysis
- 6.4 Company Profiles (includes Global Level Overview, Market Level Overview, Core Segments, Financials as available, Strategic Information, Market Rank/Share, Products and Services, Recent Developments)
- 6.4.1 Microsoft Corporation
- 6.4.2 IBM Corporation
- 6.4.3 SAP SE
- 6.4.4 Salesforce, Inc.
- 6.4.5 Wolters Kluwer N.V.
- 6.4.6 Workiva Inc.
- 6.4.7 Sphera Solutions, Inc.
- 6.4.8 Enablon SAS
- 6.4.9 Intelex Technologies ULC
- 6.4.10 Diligent Corporation
- 6.4.11 Cority Software Inc.
- 6.4.12 Nasdaq, Inc.
- 6.4.13 EcoVadis SAS
- 6.4.14 Ulula Inc.
- 6.4.15 Novisto Inc.
- 6.4.16 SP Global Inc.
- 6.4.17 Moody's Corporation
- 6.4.18 LSEG Data and Analytics,
- 6.4.19 Gensuite LLC
- 6.4.20 Persefoni AI, Inc.
7 MARKET OPPORTUNITIES AND FUTURE OUTLOOK
- 7.1 White-space and Unmet-Need Assessment


