|
시장보고서
상품코드
2073312
아시아태평양의 AI 기반 에너지 관리 소프트웨어 : 시장 점유율 분석, 업계 동향 및 통계, 성장 예측(2026-2031년)Asia-Pacific AI-Powered Energy Management Software - Market Share Analysis, Industry Trends & Statistics, Growth Forecasts (2026 - 2031) |
||||||
 Mordor Intelligence
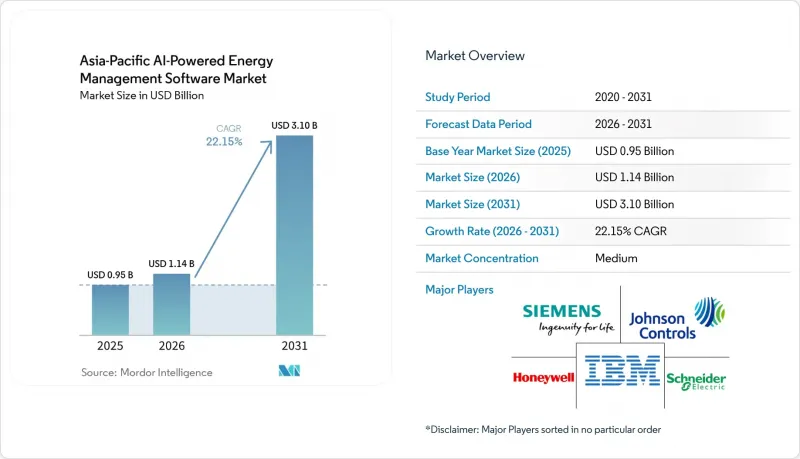
Mordor Intelligence에 의하면, 아시아태평양의 AI 기반 에너지 관리 소프트웨어 시장 규모는 2025년에 9억 5,000만 달러로 평가되었고 2031년까지 31억 달러에 이를 것으로 예측되며, 2026년부터 2031년에 걸쳐 CAGR 22.15%로 성장할 전망입니다.
본 보고서는 구성 요소(소프트웨어 및 서비스), 배포 방식(클라우드 기반, On-Premise형, 하이브리드형), 용도(에너지 소비 및 수요 최적화, 자산 성능 및 예측 유지보수 등), 최종 사용자(상업용 건물, 산업 시설 등) 및 지역별로 분류되어 있습니다. 시장 전망치는 금액(달러)으로 표시되어 있습니다.
아시아태평양의 AI 기반 에너지 관리 소프트웨어 시장 동향 및 인사이트
상업시설 및 산업 시설에서 실시간 에너지 최적화에 대한 수요가 증가하고 있습니다.
아시아태평양의 상업 및 산업 시설 운영자들은 총 소비량뿐만 아니라 피크 수요에 대해서도 높은 벌금이 부과되는 요금 체계에 직면해 있습니다. 인도에서는 고압 배전 요금에 시간대별 피크 요금이 포함되어 있으며, 해당 요금은 비피크 시간대 요금보다 40-70% 더 높습니다. 또한, 수요 요금이 전기 요금 총액의 30-40%를 차지하고 있습니다. 이러한 요금 체계로 인해 수동적인 모니터링의 가치는 떨어지고 있으며, 배터리 저장 일정 설정, 태양광 발전 출력 관리, 실시간 부하 이동을 가능하게 하는 AI 플랫폼에 대한 수요가 증가하고 있습니다. 아시아태평양의 AI 기반 에너지 관리 소프트웨어 시장은 이러한 추세의 혜택을 받고 있습니다. 대규모 제조 거점이나 상업시설에서는 핵심 업무를 중단하지 않고도 에너지 사용량을 조절할 수 있는 경우가 많기 때문입니다. 하네웰과 타타 컨설팅 서비스는 2026년 2월, 인도를 첫 번째 중점 시장으로 삼아 건물 및 산업 분야를 위한 AI 기반 자율 운영을 추진하기 위한 제휴를 발표했습니다.
스마트 그리드 및 분산형 에너지 자원과의 AI 통합
스마트 그리드 및 분산형 에너지 자원과의 AI 통합을 통해, 지역 전체의 발전 조정 품질과 시스템 가시성이 향상되고 있습니다. 한국전력공사는 2.8 GW가 넘는 분산형 에너지 자원을 집약하고, AI를 활용해 배터리, HVAC 시스템, 산업용 부하를 조절하는 가상 발전소 플랫폼을 운영하고 있습니다. 중국에서는 2026년 5월, 국가에너지국을 비롯한 관련 기관들이 51가지 AI·에너지 응용 시나리오와 2030년 역량 목표를 담은 행동 계획을 발표하고, 지원 체계를 한층 더 강화했습니다. 이러한 시스템을 도입·운영하는 전력회사는 벤더, 운영자, 그리고 레퍼런스 고객이라는 세 가지 역할을 동시에 수행하게 되므로, 경쟁 우위를 확보할 수 있습니다. 이는 아시아태평양의 AI 기반 에너지 관리 소프트웨어 시장에서 검증된 오케스트레이션 도구의 가치를 부각시키는 것으로, 특히 전력망, 부하, 에너지 저장 등 각 계층에 걸쳐 운영 가능한 소프트웨어가 필요한 전력 회사들에게 중요합니다.
기존 OT 및 IT 시스템과의 고도화된 통합이 수반하는 복잡성
아시아태평양의 AI 기반 에너지 관리 소프트웨어 시장에서 가장 큰 장애물은 최신 소프트웨어 스택과 수년에 걸쳐 도입되어 온 운영 기술(OT) 간의 격차입니다. 많은 전력 회사, 공장, 대규모 빌딩에서는 개방형 데이터 교환을 염두에 두고 설계되지 않은 독자적인 프로토콜이나 제어 시스템에 여전히 의존하고 있습니다. 그 때문에 벤더는 현장별로 특화된 커넥터나 미들웨어를 구축할 수밖에 없으며, 그 결과 비용이 증가하고 도입 기간이 길어지고 있습니다. 또한, 에너지 및 산업용 자산은 몇년단위가 아니라 15-25년 단위로 갱신되는 경우가 많기 때문에 이 문제는 일반적인 소프트웨어 주기보다 더 장기화됩니다. 그 결과, 맞춤 설정을 최소화하면서도 혼합 환경에 대응할 수 있는 공급업체일수록, 유틸리티 및 중공업 분야에서 사업을 확장할 가능성이 높아집니다.
부문별 분석
2025년, 아시아태평양의 AI 기반 에너지 관리 소프트웨어 시장에서 소프트웨어가 70.18%의 점유율을 차지했습니다. 이는 고립된 단일 기능 도구보다 플랫폼 중심의 도입이 훨씬 더 선호되고 있음을 반영합니다. 이러한 점유율은 지출을 운영 예산에 반영하고, 많은 사용자의 구매 절차를 간소화한 구독 모델에 힘입어 달성되었습니다. 또한 예측, 최적화, 보고서 작성이 개별 도구로 분산되지 않고 단일 인터페이스에서 이루어지기를 기대하게 되면서, 소프트웨어는 계속해서 주요 상용 레이어로서의 지위를 유지했습니다. 아시아태평양의 AI 기반 에너지 관리 소프트웨어 시장에서 이러한 추세에 따라 보다 광범위한 플랫폼 기능을 갖춘 공급업체들은 도입 초기 및 중기 단계에서 뚜렷한 우위를 점했습니다.
서비스 분야는 2026년부터 2031년까지 연평균 성장률(CAGR) 22.23%로 확대될 것으로 예상되며, 이는 도입 지원 수요가 핵심 소프트웨어 수요와 거의 비슷한 속도로 증가하고 있음을 보여줍니다. 고객은 초기 도입 후에도 여전히 시스템 통합, 모델 튜닝, 데이터 파이프라인 유지보수, 워크플로우 맞춤 설정이 필요합니다. 이로 인해 서비스는 도입 후에도 계속해서 그 중요성을 유지하게 되며, 플랫폼이 일상 업무에 정착되면 전환 비용이 높아집니다. 하네웰이 2026년 2월에 타타 컨설팅 서비스(Tata Consultancy Services)와 체결한 제휴는 기술력과 건물 및 산업 시설에서의 도입 실적을 결합함으로써 이러한 방향성을 반영한 것이었습니다.
2025년에는 중국, 인도, 싱가포르, 일본, 호주의 디지털 인프라 확장에 힘입어 클라우드 기반 도입이 시장의 61.14%를 차지했습니다. 클라우드 모델은 사내 IT 부담을 줄이고, 업데이트를 용이하게 하며, 여러 거점으로 신속하게 서비스를 확장하고자 하는 사용자에게 매력적입니다. 이는 독자적인 완전한 데이터 스택을 유지하기를 원하지 않는 상업용 건물 운영자나 소규모 유틸리티자에게 특히 적합합니다. 아시아태평양의 AI 기반 에너지 관리 소프트웨어 시장에서는 확장성 측면에서 클라우드가 계속해서 선호되고 있지만, 이러한 경향이 모든 최종 사용자에게 일률적으로 적용되는 것은 아닙니다.
하이브리드형 도입은 2026년부터 2031년에 걸쳐 연평균 성장률(CAGR) 22.34%를 나타낼 것으로 예측되며, 시장에서 가장 빠르게 성장하는 도입 형태가 될 전망입니다. 이는 지연 시간에 민감한 기능에 대해서는 로컬 제어를 원하면서도, 보다 광범위한 최적화를 위해서는 클라우드 분석을 활용하고자 하는 전력 회사 및 산업 사업자의 요구를 반영한 것입니다. 또한, 데이터 주권 관련 정책이나 운영 리스크로 인해 완전한 클라우드 전환이 어려운 경우에도 하이브리드형 구성은 수용되기 쉬운 특징이 있습니다. 장기적으로는 고객에게 단일 아키텍처를 강요하지 않으면서도 엣지 처리, 현장 제어 및 중앙 집중식 분석을 연계할 수 있는 벤더에게 새로운 비즈니스 기회가 생길 것입니다.
기타 혜택 :
- 엑셀 형식 시장 예측(ME) 시트
- 3개월간의 애널리스트 지원
자주 묻는 질문
목차
제1장 서론
제2장 조사 방법
제3장 주요 요약
제4장 시장 구도
제5장 시장 규모 및 성장 예측
제6장 경쟁 구도
제7장 시장 기회 및 향후 전망
KTH 26.07.08According to Mordor Intelligence, the asia-Pacific AI-powered energy management software market size was valued at USD 0.95 billion in 2025 and is forecast to reach USD 3.10 billion by 2031, advancing at a CAGR of 22.15% during 2026-2031.
This report is Segmented by Component (Software, and Services), Deployment Mode (Cloud-Based, On-Premises, and Hybrid), Application (Energy Consumption and Demand Optimization, Asset Performance and Predictive Maintenance, and More), End User (Commercial Buildings, Industrial Facilities, and More), and Geography. The Market Forecasts are Provided in Terms of Value (USD).
Asia-Pacific AI-Powered Energy Management Software Market Trends and Insights
Rising Need For Real-Time Energy Optimization in Commercial And Industrial Facilities
Commercial and industrial operators across the Asia-Pacific are dealing with tariff structures that penalize peak demand as heavily as total consumption. In India, high-tension distribution tariffs include time-of-day peak rates that run 40-70% above off-peak levels, while demand charges account for 30-40% of total electricity bills. This pricing structure devalues passive monitoring and increases demand for AI platforms that can schedule battery storage, manage solar output, and shift loads in real time. The Asia-Pacific AI-powered energy management software market is benefiting from this trend, as large manufacturing and commercial sites can often adjust energy use without interrupting core operations. Honeywell and Tata Consultancy Services announced a partnership in February 2026 to advance AI-driven autonomous operations for buildings and industries, with India as the initial focus market.
AI Integration with Smart Grids and Distributed Energy Resources
AI integration with smart grids and distributed resources is improving dispatch quality and system visibility across the region. Korea Electric Power Corporation operates a virtual power plant platform that aggregates more than 2.8 GW of distributed resources and uses AI to coordinate batteries, HVAC systems, and industrial loads. China added another layer of support in May 2026 when the National Energy Administration and other agencies issued an action plan with 51 AI and energy application scenarios and a 2030 capability target. Utilities that both deploy and operate these systems gain an advantage because they become vendors, operators, and reference customers simultaneously. This underscores the value of proven orchestration tools in the Asia-Pacific AI-powered energy management software market, especially for utilities that need software that can operate across grid, load, and storage layers.
High Integration Complexity with Legacy OT And IT Systems
A major obstacle in the Asia-Pacific AI-powered energy management software market is the gap between modern software stacks and long-installed operational technology. Many utilities, factories, and large buildings still rely on proprietary protocols and control systems that were never designed for open data exchange. That forces vendors to build site-specific connectors and middleware, which raises cost and extends deployment timelines. The problem also lasts longer than a normal software cycle because energy and industrial assets are often replaced over 15-25 years rather than every few years. As a result, vendors that can handle mixed environments with less customization are more likely to scale across public utilities and heavy industry.
Other drivers and restraints analyzed in the detailed report include:
- Increasing Demand for Automated Demand Response and Peak Load Management
- Expansion of ESG Reporting and Carbon Accounting Workflows
- Data Quality, Interoperability, and Sensor Fragmentation Issues
For complete list of drivers and restraints, kindly check the Table Of Contents.
Segment Analysis
Software held 70.18% of the Asia-Pacific AI-powered energy management software market share in 2025, reflecting the strong preference for platform-led deployments over isolated point tools. This share was supported by subscription models that moved spending into operating budgets and simplified the buying process for many users. Software also remained the main commercial layer because forecasting, optimization, and reporting are now expected to sit on a single interface rather than across separate tools. Within the Asia-Pacific AI-powered energy management software market, this gave vendors with broader platform capability a clear advantage in early and mid-stage deployments.
Services are projected to expand at a 22.23% CAGR during 2026-2031, which shows that deployment support is rising almost as quickly as core software demand. Clients still need system integration, model tuning, data pipeline maintenance, and workflow customization after the initial installation. This keeps services relevant well beyond launch and raises switching costs once a platform is embedded into daily operations. Honeywell's February 2026 partnership with Tata Consultancy Services reflected this direction by pairing technology capability with implementation depth for buildings and industrial sites.
Cloud-based deployment accounted for 61.14% of the market in 2025, supported by expanding digital infrastructure across China, India, Singapore, Japan, and Australia. Cloud models appeal to users who want lower in-house IT requirements, easier updates, and faster rollout across multiple sites. This has been especially relevant for commercial building operators and smaller utilities that do not want to maintain their own full data stack. The Asia-Pacific AI-powered energy management software market continues to favor cloud for scalability, but the pattern is not uniform across all end users.
Hybrid deployment is projected to grow at a 22.34% CAGR from 2026 to 2031, making it the fastest-growing mode in the market. This reflects the needs of utilities and industrial operators that want local control for latency-sensitive functions while still using cloud analytics for broader optimization. Hybrid setups are also easier to accept when data sovereignty policies or operational risk make a full cloud migration difficult. Over time, this creates an opening for vendors that can coordinate edge processing, on-site control, and centralized analytics without forcing customers into a single architecture.
Complete Report Scope:
- By Component
- Software
- Services
- By Deployment Mode
- Cloud-Based
- On-Premises
- Hybrid
- By Application
- Energy Consumption and Demand Optimization
- Asset Performance and Predictive Maintenance
- Smart Grid and Distributed Energy Resource (DER) Management
- Renewable Energy Forecasting and Integration
- Energy Trading, Pricing and Market Intelligence
- By End User
- Utilities
- Commercial Buildings
- Industrial Facilities
- Residential Buildings
- By Geography
- China
- India
- Japan
- South Korea
- Australia and New Zealand
- Rest of Asia-Pacific
List of Companies Covered in this Report:
- Siemens AG
- Schneider Electric SE
- ABB Ltd.
- Honeywell International Inc.
- IBM Corporation
- Johnson Controls International plc
- GE Vernova Inc.
- Rockwell Automation, Inc.
- Eaton Corporation plc
- Microsoft Corporation
- Amazon Web Services, Inc.
- Oracle Corporation
- C3.ai, Inc.
- Bidgely, Inc.
- Hitachi Energy Ltd.
- Innowatts, Inc.
- Enel X S.r.l.
- GridPoint, Inc.
- Envision Digital International
- AutoGrid Systems, Inc.
Additional Benefits:
- The market estimate (ME) sheet in Excel format
- 3 months of analyst support
TABLE OF CONTENTS
1 INTRODUCTION
- 1.1 Study Assumptions and Market Definition
- 1.2 Scope of the Study
2 RESEARCH METHODOLOGY
3 EXECUTIVE SUMMARY
4 MARKET LANDSCAPE
- 4.1 Market Overview
- 4.2 Market Drivers
- 4.2.1 Rising Need for Real-Time Energy Optimization in Commercial and Industrial Facilities
- 4.2.2 AI Integration With Smart Grids and Distributed Energy Resources
- 4.2.3 Increasing Demand for Automated Demand Response and Peak Load Management
- 4.2.4 Expansion of ESG Reporting and Carbon Accounting Workflows
- 4.2.5 Edge AI Adoption for Site-Level Energy Control and Fault Detection
- 4.2.6 Growing Retrofit Demand From Aging Building and Industrial Infrastructure
- 4.3 Market Restraints
- 4.3.1 High Integration Complexity With Legacy OT and IT Systems
- 4.3.2 Data Quality, Interoperability, and Sensor Fragmentation Issues
- 4.3.3 Cybersecurity and Data Sovereignty Concerns for Critical Energy Assets
- 4.3.4 Payback Uncertainty in Small and Mid-Sized Sites With Limited Load Density
- 4.4 Impact of Macroeconomic Factors on The Market
- 4.5 Industry Value-Chain Analysis
- 4.6 Regulatory Landscape
- 4.7 Technological Outlook
- 4.8 Porter's Five Forces Analysis
- 4.8.1 Bargaining Power of Buyers
- 4.8.2 Bargaining Power of Suppliers
- 4.8.3 Threat of New Entrants
- 4.8.4 Threat of Substitutes
- 4.8.5 Intensity of Competitive Rivalry
5 MARKET SIZE AND GROWTH FORECASTS (VALUE)
- 5.1 By Component
- 5.1.1 Software
- 5.1.2 Services
- 5.2 By Deployment Mode
- 5.2.1 Cloud-Based
- 5.2.2 On-Premises
- 5.2.3 Hybrid
- 5.3 By Application
- 5.3.1 Energy Consumption and Demand Optimization
- 5.3.2 Asset Performance and Predictive Maintenance
- 5.3.3 Smart Grid and Distributed Energy Resource (DER) Management
- 5.3.4 Renewable Energy Forecasting and Integration
- 5.3.5 Energy Trading, Pricing and Market Intelligence
- 5.4 By End User
- 5.4.1 Utilities
- 5.4.2 Commercial Buildings
- 5.4.3 Industrial Facilities
- 5.4.4 Residential Buildings
- 5.5 By Geography
- 5.5.1 China
- 5.5.2 India
- 5.5.3 Japan
- 5.5.4 South Korea
- 5.5.5 Australia and New Zealand
- 5.5.6 Rest of Asia-Pacific
6 COMPETITIVE LANDSCAPE
- 6.1 Market Concentration
- 6.2 Strategic Moves
- 6.3 Market Share Analysis
- 6.4 Company Profiles (includes Global Level Overview, Market Level Overview, Core Segments, Financials as available, Strategic Information, Market Rank/Share, Products and Services, Recent Developments)
- 6.4.1 Siemens AG
- 6.4.2 Schneider Electric SE
- 6.4.3 ABB Ltd.
- 6.4.4 Honeywell International Inc.
- 6.4.5 IBM Corporation
- 6.4.6 Johnson Controls International plc
- 6.4.7 GE Vernova Inc.
- 6.4.8 Rockwell Automation, Inc.
- 6.4.9 Eaton Corporation plc
- 6.4.10 Microsoft Corporation
- 6.4.11 Amazon Web Services, Inc.
- 6.4.12 Oracle Corporation
- 6.4.13 C3.ai, Inc.
- 6.4.14 Bidgely, Inc.
- 6.4.15 Hitachi Energy Ltd.
- 6.4.16 Innowatts, Inc.
- 6.4.17 Enel X S.r.l.
- 6.4.18 GridPoint, Inc.
- 6.4.19 Envision Digital International
- 6.4.20 AutoGrid Systems, Inc.
7 MARKET OPPORTUNITIES AND FUTURE OUTLOOK
- 7.1 White-Space and Unmet-Need Assessment