

|
시장보고서
상품코드
2073360
미국의 데이터센터 전력 : 시장 점유율 분석, 업계 동향 및 통계, 성장 예측(2026-2031년)United States Data Center Power - Market Share Analysis, Industry Trends & Statistics, Growth Forecasts (2026 - 2031) |
||||||
 Mordor Intelligence
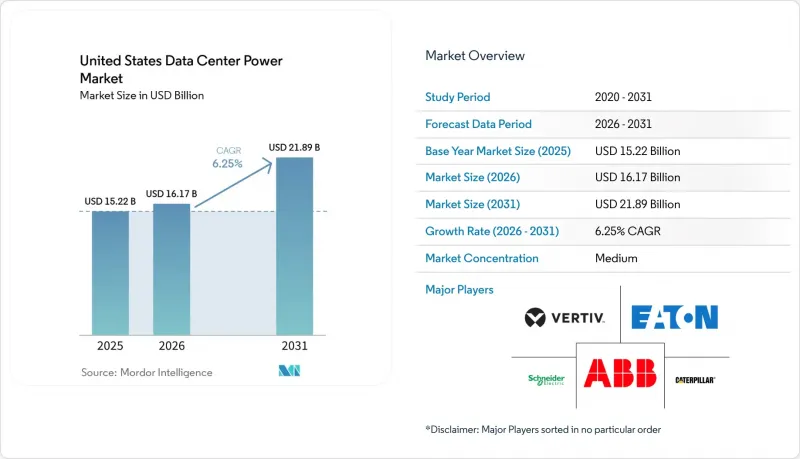
Mordor Intelligence에 의하면, 미국의 데이터센터 전력 시장 규모는 2025년 152억 2,000만 달러로 평가되었습니다. 2026년에는 161억 7,000만 달러로 확대되어 2026년부터 2031년에 걸쳐 CAGR 6.25%로 성장을 지속하여, 2031년에는 218억 9,000만 달러에 이를 것으로 예측됩니다.
본 보고서는 구성 요소(전기 솔루션, 서비스), 데이터센터의 유형(하이퍼스케일러/클라우드 서비스 제공업체, 코로케이션 제공업체 등), 데이터센터의 규모(소규모 데이터센터, 중규모 데이터센터, 대규모 데이터센터 등), 티어 유형(Tier I 및 II, Tier III, Tier IV)별로 분류되어 있습니다. 시장 전망은 금액(달러) 기준으로 제시되어 있습니다.
미국의 데이터센터 전력 시장 동향 및 인사이트
랙 전력 밀도 증가(20 kW/랙 이상이 주류를 이루고 있습니다)
20kW를 초과하는 랙이 미국의 데이터센터 전력 시장 전체의 전력 토폴로지를 재정의하고 있습니다. AI를 중심으로 한 도입 사례에서는 이미 랙당 100kW를 초과하고 있기 때문에 운영자가 전력 공급을 미세하게 조정할 수 있는 정밀한 계측 기능을 갖춘 고전류 대응 데이터센터용 랙 PDU에 대한 수요가 증가하고 있습니다. 직접 투 칩(DTC) 및 침지 냉각 기술의 도입으로 인해, 설계자들은 낮은 전압 강하와 발열 최소화를 목표로 설계된 버스웨이 시스템이나 원격 전원 패널로 전환해야 하는 상황에 직면해 있습니다. 이러한 고밀도 아키텍처는 물리적 설치 면적을 줄여주어, 하이퍼스케일 사업자가 1제곱피트당 연산 성능을 더욱 끌어올릴 수 있게 해줍니다. 지능형 배전과 실시간 열 상태 분석을 결합한 공급업체들이 경쟁 우위를 점하고 있습니다. 밀도가 높아짐에 따라, 전기 엔지니어들은 구리선 손실을 줄이고 향후 AI 가속기를 위한 여유를 확보하기 위해 중전압 전원을 지정하는 경우가 늘어나고 있으며, 이는 현재 진행 중인 구조적 변화를 여실히 보여주고 있습니다.
에너지 효율이 높고 비용이 최적화된 시설로의 신속한 전환
비용 압박과 지속가능성 목표에 따라 사업자들은 PUE 개선과 수명 주기 비용 절감을 추구하고 있으며, 효율성은 미국의 데이터센터 전력 시장의 주요 논의 주제로 계속 자리 잡고 있습니다. 전력 조달 비용이 이익률을 좌우하는 코로케이션 제공업체들은 유휴 용량을 제거하는 모듈식 구조의 적정 규모 전원 블록을 도입하고 있습니다. 콘센트 단위의 모니터링 기능을 갖춘 지능형 PDU는 예측 유지보수 및 사용량 기반 과금 모델을 지원합니다. CFO는 포트폴리오 전체에 걸쳐 15년이라는 장기적인 관점에서 총소유비용(TCO)을 추적하고 있으며, 에너지 및 유지보수 비용 절감 효과를 정량화할 수 있는 공급업체가 경쟁사보다 더 많은 매출을 올리고 있습니다. 환경 친화적 노력은 입찰 기준에 더욱 큰 영향을 미치며, 검증 가능한 탄소 배출 감축 효과를 지닌 장비로의 조달을 가속화하고 있습니다.
변동하는 전력 요금으로 인해 미국의 데이터센터 전력 시장 전반의 이익률이 압박받고 있으며, 특히 피크 시간대에 수요 요금이 급등하는 Tier 1 대도시권에서는 이러한 경향이 두드러집니다. 콜로케이션 계약의 경우, 대개 고객의 요금이 수년에 걸쳐 고정되므로, 도매 전력 비용이 급등할 때 공급업체는 위험에 노출되게 됩니다. 버지니아주 북부에서는 전력 회사가 신규 부하를 제한하는 가운데 혼잡 요금이 문제를 더욱 심각하게 만들고 있어, 개발업자들은 비용이 많이 드는 부지 내 변전소 설치를 어쩔 수 없이 해야 하는 상황에 처해 있습니다. 사업자들은 고정 가격 전력 구매 계약, 피크 시간대의 가격 차이를 차익 거래를 통해 활용하는 부지 내 배터리 저장 시스템을 통해 리스크를 헤지하고 있습니다. 재정적 불확실성으로 인해, 발전 여력이 있고 더 유리한 요금 체계를 갖춘 2차 시장으로의 확장이 진행되고 있습니다. 금융 등급의 통합형 성과 분석을 제공하는 업체는 고객이 다양한 요금 시나리오 하에서 ROI를 비교 분석할 수 있도록 지원함으로써, 변동이 심한 시장 환경 속에서도 구매에 대한 확신을 높여주고 있습니다.
부문별 분석
2025년에는 UPS 시스템이 가장 큰 수익 점유율을 차지하며, 미국 데이터센터 전력 시장의 36.04%를 차지했습니다. 수명이 길고 설치 면적이 작은 리튬 이온 배터리가 현재 신규 도입의 주류를 이루고 있어, 유지보수 방문 횟수를 줄이고 귀중한 여유 공간을 확보하고 있습니다. Galaxy VXL 플랫폼은 폼 팩터의 소형화를 통해 구조적 개조 없이 캐비닛의 고밀도화를 실현하는 방법을 제시하고 있습니다. 지능형 배터리 관리는 사이클 수명을 연장하고, 예측 유지보수 엔진에 활용되는 상태(SOTH)에 대한 인사이트를 제공함으로써, AI 워크로드에 요구되는 가동 시간을 보장합니다. 또한, 시설이 주파수 조정 및 스피닝 리저브 서비스를 제공할 수 있도록 하는 그리드 연계형 펌웨어 덕분에 해당 부문의 매출이 더욱 증가하여, 단순한 비용 센터에서 수익원으로 전환되고 있습니다.
배전 장치(PDU)는 가장 빠르게 성장하고 있는 제품군으로, 2031년까지 연평균 성장률(CAGR) 6.05%를 나타낼 것으로 전망됩니다. 초고밀도 랙에는 콘센트당 100A를 초과하는 정격 전류를 가진 PDU가 필요하며, 온도, 부하, 고조파를 실시간으로 보고하는 분기 수준에서의 계측 기능이 요구됩니다. 소프트웨어 정의 콘센트 전환 기능은 동적 전력 제한을 지원하며, 피더 회로를 연쇄적인 과부하로부터 보호합니다.
코로케이션 제공업체는 규모의 경제를 활용하여 대도시권 전역에서 낮은 지연 시간을 실현함으로써, 2025년 매출의 45.10%를 차지했습니다. 전력의 신뢰성은 핵심적인 차별화 요소로 자리 잡고 있으며, 각 시설은 판매 과정에서 2밀리초 미만의 전환 시간과 1.4 미만의 평균 PUE를 강조하고 있습니다. 그러나 에너지 비용 상승이 이익률을 압박하고 있기 때문에 코로케이션 사업자들은 고효율 UPS 블록을 도입하고, 구역 규정이 허용하는 한도 내에서 인접 건물로 폐열을 재활용해야 하는 상황에 처해 있습니다. 이러한 전략은 스코프 2 배출량 감축 보고를 요구받고 있는 기업 임차인들의 공감을 불러일으키며, 코로케이션의 가치 제안을 강화하고 있습니다.
연평균 성장률(CAGR) 8.05%로 성장을 이어가고 있는 하이퍼스케일 및 클라우드 서비스 제공업체들은 전력 회사의 계획 기간을 재검토하게 만들 정도의 멀티 기가와트급 캠퍼스를 건설하고 있습니다. 메가 시설 설계 지침에 따르면, 16 MW 단위의 빌딩 블록마다 N+1 구성의 배터리 스트링을 설치하고, 48시간의 자율 가동을 보장하는 현장 가스 터빈 또는 연료전지와 결합해야 합니다.
기타 혜택 :
- 엑셀 형식 시장 예측(ME) 시트
- 3개월간의 애널리스트 지원
자주 묻는 질문
목차
제1장 서론
제2장 조사 방법
제3장 주요 요약
제4장 시장 구도
제5장 시장 규모 및 성장 예측
제6장 경쟁 구도
제7장 시장 기회 및 향후 전망
KTH 26.07.07According to Mordor Intelligence, the united states data center power market size is expected to grow from USD 15.22 billion in 2025 to USD 16.17 billion in 2026 and is forecast to reach USD 21.89 billion by 2031 at 6.25% CAGR over 2026-2031.
This report is Segmented by Component (Electrical Solutions, Services), Data Center Type (Hyperscaler/Cloud Service Providers, Colocation Providers, and More), Data Center Size (Small Size Data Centers, Medium Size Data Centers, Large Size Data Centers and More), Tier Type (Tier I and II, Tier III, Tier IV). The Market Forecasts are Provided in Terms of Value (USD)
United States Data Center Power Market Trends and Insights
Growing rack-power density (>= 20 kW/rack becoming mainstream)
Racks surpassing 20 kW are redefining power topologies across the United States data center power market. AI-focused deployments already exceed 100 kW per rack, driving demand for high-amperage data center rack PDUs with granular metering that help operators fine-tune energy delivery. Adoption of direct-to-chip and immersion cooling pushes designers toward busway systems and remote power panels engineered for low voltage drop and minimal heat. These high-density architectures compress physical footprints, enabling hyperscale operators to extract more compute per square foot. Vendors that couple intelligent distribution with real-time thermal insight are gaining an edge. As densities climb, electrical engineers increasingly specify medium-voltage feeds to mitigate copper losses and retain headroom for future AI accelerators, underscoring the structural shift now underway.
Rapid shift to energy-efficient & cost-optimized facilities
Cost pressure and sustainability goals propel operators to chase PUE gains and lifecycle savings, keeping efficiency at the center of the United States data center power market conversation. Colocation providers, where power buys dictate margins, are early adopters of modular, right-sized power blocks that eliminate stranded capacity. Intelligent PDUs with outlet-level monitoring support predictive maintenance and usage-based billing models. Across portfolios, CFOs track total cost of ownership over a 15-year horizon; suppliers that quantify energy and maintenance savings are outselling peers. Green credentials further tip bidding criteria, moving procurement toward equipment with verifiable carbon reductions.
Swinging tariffs tighten margins across the United States data center power market, particularly in Tier 1 metros where demand charges spike during peak conditions. Colocation contracts often lock customer rates for multi-year terms, leaving providers exposed when wholesale power costs surge. In Northern Virginia, congestion fees compound the problem as utilities ration new load, forcing developers into costly on-site substations.Operators hedge with fixed-rate power purchase agreements and onsite battery storage that arbitrages peak differentials. Financial unpredictability steers expansion toward secondary markets boasting surplus generation and friendlier tariff structures. Vendors that offer integrated financial-grade performance analytics help clients benchmark ROI under multiple rate scenarios, bolstering purchase confidence amid volatility.
Other drivers and restraints analyzed in the detailed report include:
- Hyperscale build-out across the FL-VA-TX "data-center corridor"
- Federal & state tax incentives for green power infrastructure
- IT refresh cycles outpacing electrical-plant payback periods
For complete list of drivers and restraints, kindly check the Table Of Contents.
Segment Analysis
UPS systems generated the largest revenue slice in 2025, accounting for 36.04% of the United States data center power market. Lithium-ion chemistries with longer lifespans and smaller footprints now dominate new deployments, cutting maintenance visits and unlocking valuable white space. The Galaxy VXL platform illustrates how form-factor reductions enable higher cabinet densities without structural retrofits. Intelligent battery management enhances cycle life and provides state-of-health insights that feed predictive maintenance engines, securing uptime commitments demanded by AI workloads. Segment revenue is further buoyed by grid-interactive firmware that lets facilities provide frequency-regulation or spinning-reserve services, converting a pure cost center into a profit lever.
Power distribution units (PDUs) are the fastest-growing component line, set to post a 6.05% CAGR through 2031. Ultra-high-density racks require PDUs rated beyond 100 A per whip, with branch-level metering that reports temperature, load, and harmonics in real time. Software-definable outlet switching supports dynamic power capping, protecting feeder circuits from cascading overload.
Colocation providers captured 45.10% of 2025 revenue, leveraging scale economics to deliver low latency across metropolitan footprints. Power reliability acts as a core differentiator; facilities tout sub-2 ms transfer times and sub-1.4 PUE averages during sales cycles. Rising energy costs, however, squeeze profit margins, compelling colos to deploy high-efficiency UPS blocks and reclaim waste heat for adjacent buildings where zoning permits. These strategies resonate with enterprise tenants under pressure to report Scope 2 emissions reductions, reinforcing colo value propositions.
Hyperscale and cloud service providers, expanding at an 8.05% CAGR, build multigigawatt campuses that reorder utility planning horizons. Mega-facility design guides call for N+1 battery strings at building-block increments of 16 MW, coupled with on-site gas turbines or fuel cells that guarantee 48-hour autonomy.
Complete Report Scope:
- By Component
- Electrical Solutions
- UPS Systems
- Generators
- Diesel Generators
- Gas Generators
- Hydrogen Fuel-cell Generators
- Power Distribution Units
- Switchgear
- Transfer Switches
- Remote Power Panels
- Energy-storage Systems
- Service
- Installation and Commissioning
- Maintenance and Support
- Training and Consulting
- Electrical Solutions
- By Data Center Type
- Hyperscaler/Cloud Service Providers
- Colocation Providers
- Enterprise and Edge Data Center
- By Data Center Size
- Small Size Data Centers
- Medium Size Data Centers
- Large Size Data Centers
- Massive Size Data Centers
- Mega Size Data Centers
- By Tier Level
- Tier I and II
- Tier III
- Tier IV
List of Companies Covered in this Report:
- ABB Ltd
- Schneider Electric SE
- Vertiv Holdings Co
- Eaton Corp plc
- Caterpillar Inc
- Cummins Inc
- Generac Power Systems
- Mitsubishi Electric Corp
- Delta Electronics Inc
- Cisco Systems Inc
- Hewlett Packard Enterprise
- Rittal GmbH and Co KG
- Legrand SA
- Leviton Mfg Co Inc
- Cyber Power Systems (USA) Inc
- Piller Power Systems
- Kohler Power Systems
- Bloom Energy Corp
- RESA Power LLC
- Raritan Inc
- Fujitsu Ltd
Additional Benefits:
- The market estimate (ME) sheet in Excel format
- 3 months of analyst support
TABLE OF CONTENTS
1 INTRODUCTION
- 1.1 Study Assumptions and Market Definition
- 1.2 Scope of the Study
2 RESEARCH METHODOLOGY
3 EXECUTIVE SUMMARY
4 MARKET LANDSCAPE
- 4.1 Market Overview
- 4.2 Market Drivers
- 4.2.1 Growing rack-power density (greater than 20 kW/rack becoming mainstream)
- 4.2.2 Rapid shift to energy-efficient and cost-optimized facilities
- 4.2.3 Hyperscale build-out across FL-VA-TX data-center corridor
- 4.2.4 Federal and state tax incentives for green power infrastructure
- 4.2.5 On-site micro-grid / fuel-cell adoption to hedge grid outages
- 4.2.6 Demand-response revenues via grid-interactive UPS fleets
- 4.3 Market Restraints
- 4.3.1 IT refresh cycles outpacing electrical-plant payback periods
- 4.3.2 Rising utility-rate volatility and grid-congestion charges
- 4.3.3 PFAS-related regulatory scrutiny on lithium-ion UPS chemistries
- 4.3.4 Generator permitting delays in Tier 1 metro areas
- 4.4 Supply-Chain Analysis
- 4.5 Regulatory Landscape
- 4.6 Technological Outlook
- 4.7 Porter's Five Forces Analysis
- 4.7.1 Threat of New Entrants
- 4.7.2 Bargaining Power of Buyers
- 4.7.3 Bargaining Power of Suppliers
- 4.7.4 Threat of Substitutes
- 4.7.5 Intensity of Competitive Rivalry
- 4.8 Assesment of Macroeconomic Trends on the Market
5 MARKET SIZE and GROWTH FORECASTS (VALUE)
- 5.1 By Component
- 5.1.1 Electrical Solutions
- 5.1.1.1 UPS Systems
- 5.1.1.2 Generators
- 5.1.1.2.1 Diesel Generators
- 5.1.1.2.2 Gas Generators
- 5.1.1.2.3 Hydrogen Fuel-cell Generators
- 5.1.1.3 Power Distribution Units
- 5.1.1.4 Switchgear
- 5.1.1.5 Transfer Switches
- 5.1.1.6 Remote Power Panels
- 5.1.1.7 Energy-storage Systems
- 5.1.2 Service
- 5.1.2.1 Installation and Commissioning
- 5.1.2.2 Maintenance and Support
- 5.1.2.3 Training and Consulting
- 5.1.1 Electrical Solutions
- 5.2 By Data Center Type
- 5.2.1 Hyperscaler/Cloud Service Providers
- 5.2.2 Colocation Providers
- 5.2.3 Enterprise and Edge Data Center
- 5.3 By Data Center Size
- 5.3.1 Small Size Data Centers
- 5.3.2 Medium Size Data Centers
- 5.3.3 Large Size Data Centers
- 5.3.4 Massive Size Data Centers
- 5.3.5 Mega Size Data Centers
- 5.4 By Tier Level
- 5.4.1 Tier I and II
- 5.4.2 Tier III
- 5.4.3 Tier IV
6 COMPETITIVE LANDSCAPE
- 6.1 Market Concentration
- 6.2 Strategic Moves
- 6.3 Market Share Analysis
- 6.4 Company Profiles (includes Global level Overview, Market level overview, Core Segments, Financials as available, Strategic Information, Market Rank/Share for key companies, Products & Services, and Recent Developments)
- 6.4.1 ABB Ltd
- 6.4.2 Schneider Electric SE
- 6.4.3 Vertiv Holdings Co
- 6.4.4 Eaton Corp plc
- 6.4.5 Caterpillar Inc
- 6.4.6 Cummins Inc
- 6.4.7 Generac Power Systems
- 6.4.8 Mitsubishi Electric Corp
- 6.4.9 Delta Electronics Inc
- 6.4.10 Cisco Systems Inc
- 6.4.11 Hewlett Packard Enterprise
- 6.4.12 Rittal GmbH and Co KG
- 6.4.13 Legrand SA
- 6.4.14 Leviton Mfg Co Inc
- 6.4.15 Cyber Power Systems (USA) Inc
- 6.4.16 Piller Power Systems
- 6.4.17 Kohler Power Systems
- 6.4.18 Bloom Energy Corp
- 6.4.19 RESA Power LLC
- 6.4.20 Raritan Inc
- 6.4.21 Fujitsu Ltd
7 MARKET OPPORTUNITIES and FUTURE OUTLOOK
- 7.1 White-space and Unmet-Need Assessment


