

|
시장보고서
상품코드
2073422
서비스 로봇 : 시장 점유율 분석, 업계 동향 및 통계, 성장 예측(2026-2031년)Service Robotics - Market Share Analysis, Industry Trends & Statistics, Growth Forecasts (2026 - 2031) |
||||||
 Mordor Intelligence
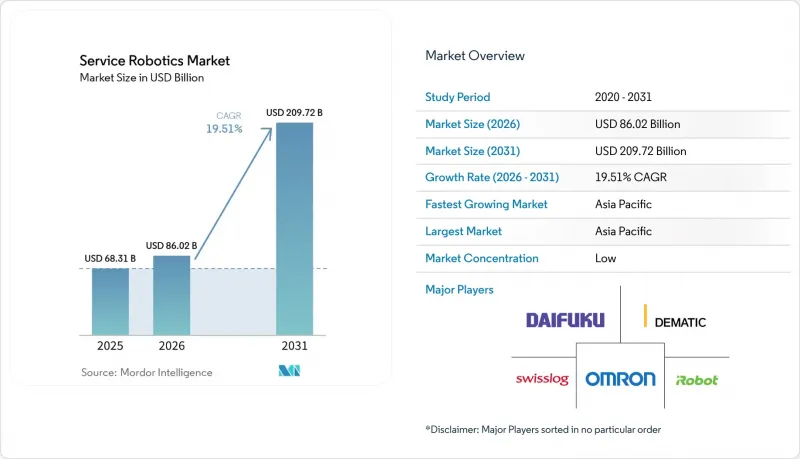
Mordor Intelligence에 의하면, 서비스 로봇 시장 규모는 2025년에 683억 1,000만 달러로 평가되었습니다. 2026년 860억 2,000만 달러에서 2031년까지 2,097억 2,000만 달러에 이를 것으로 예상되며, 예측 기간(2026-2031년) CAGR은 19.51%를 나타낼 전망입니다.
본 보고서는 용도(업무용 및 개인·가정용), 구성 요소(하드웨어, 소프트웨어, 서비스), 운용 환경(지상, 공중/UAV, 기타), 모빌리티(이동형/자율형, 고정형/고정 기반), 최종 사용자 산업(농업, 국방·보안, 호텔·소매, 기타), 지역별로 분류되어 있습니다. 시장 전망은 금액(달러) 기준으로 제시되어 있습니다.
세계의 서비스 로봇 시장 동향 및 인사이트
의료, 물류, 농업 분야의 자동화 수요 증가
2025년에는 “da Vinci" 및 “Hugo" 시스템의 적응증이 확대됨에 따라, 병원의 로봇 수술 건수가 200만 건을 넘어섰고, 수술실 회전 시간이 단축되며 수술 처리 능력이 향상되었습니다. 성수기 전자상거래 거래량 증가에 힘입어 아마존의 로봇 수는 75만 대를 돌파했으며, 피킹 시간을 30초 미만으로 단축하여 생산성의 새로운 기준을 세웠습니다. 농업 분야에서는 실시간 키네마틱 GPS를 탑재한 자율 주행 트랙터 덕분에 가동 시간이 24시간으로 확대되었고, 토지 이용률이 40% 향상되었습니다. 현재 공급업체들은 업계 전반에 걸쳐 센서를 재사용하고 있으며, 이를 통해 규모의 경제가 촉진되어 단가가 하락하는 동시에 도입 주기가 수년에서 수개월로 단축되고 있습니다. 이 세 가지 부문 수요가 합쳐지면서 서비스 로봇 시장의 성장 궤도를 더욱 공고히 하고 있습니다.
심화되는 노동력 부족과 고령화
OECD 회원국에서는 2025년부터 2030년 사이에 1,500만 명의 노동력이 감소할 것으로 예상되며, 창고 작업원과 요양 보호사를 둘러싼 경쟁이 치열해지고 있습니다. 일본에서는 2030년까지 69만 명의 요양 인력 부족이 예상되고 있으며, 현재 돌봄 로봇 비용의 최대 90%를 공공 보조금으로 충당하고 있기 때문에 이동 및 목욕 지원 기기의 판매가 가속화되고 있습니다. 독일의 공적 보험 기관은 차량 1대당 5,000유로(5,650달러)의 보조금을 지급하고 있으며, 이를 통해 대상인 일반 가정 시장을 확대되고 있습니다. 미국의 호텔·관광 업계에서는 190만 건의 인력 부족을 배경으로, 호텔들이 배송 로봇을 도입하여 직원을 수익을 창출하는 고객 서비스에 투입할 수 있게 되었습니다. 따라서 인구 동학적 압력은 서비스 로봇 시장의 지속적인 성장 동력이 되고 있습니다.
높은 설비 투자(CAPEX)와 유지 관리 비용
수술용 로봇의 가격은 여전히 150만-250만 달러에 달하며, 여기에 연간 15만-20만 달러의 유지보수 계약 비용이 추가로 발생하기 때문에 도입은 환자 수가 많은 도시 지역의 병원으로 한정되어 있습니다. 창고에는 20-50대를 도입해야 하며, 시스템 통합 전에 100만-250만 달러의 비용이 소요됩니다. 24개월 만에 투자 회수가 가능할 것으로 예상에도 불구하고, 사업자의 40%가 예산 한도를 가장 큰 장애물로 꼽고 있습니다. 리튬 이온 배터리는 3-4년마다 5,000-8,000달러의 교체 비용이 소요되며, 주요 도시 이외의 지역에서는 여전히 전문 기술자가 부족합니다. 이러한 비용 때문에 가격에 민감한 부문에서의 보급이 더디게 진행되고 있습니다.
부문별 분석
2025년, 업무용 서비스 로봇은 서비스 로봇 시장 점유율의 52.44%를 차지하며, 물류 자동화 및 수술실에 대한 지속적인 투자를 반영했습니다. 자율 주행 로봇이 피킹 및 포장 사이클 타임을 50-70% 단축하고, 수술 시스템이 고수익률의 일회용 소모품을 제공함으로써 수명 주기 가치를 높이기 때문에 물류 플랫폼은 여전히 최대의 수익원입니다. 농업용 필드 로봇은 자율 주행 트랙터가 파종 기간을 연장하고, 드론을 활용한 정찰이 수확량 예측 정확도를 90% 이상으로 끌어올리면서 그 기세를 더해가고 있습니다. 석유 및 가스·통신탑 점검용 장치는 밀폐된 공간에서의 작업 위험을 줄여 보험료 절감에 기여하고 있습니다. 이러한 활용 사례가 어우러져 업무용 수요를 뒷받침하고, 서비스 로봇 시장 전체를 확대시키고 있습니다.
2025년에는 가정용 플랫폼에 대한 소비자의 수용도도 높아지면서 로봇 청소기와 잔디깎이의 출하 대수가 1,500만 대에 달했으나, 그 수익 기반은 업무용 제품에 비해 여전히 작은 상태입니다. 일본과 독일에서는 보험 적용 대상인 고령자 지원 로봇의 판매 대수가 오락용 모델을 웃돌고 있습니다. 이는 1대당 최대 5,650달러의 비용이 보험으로 충당되기 때문입니다. 해체 작업과 콘크리트 마감 작업을 자동화하는 건설용 로봇은 도급업체들이 OSHA(미국 직업안전보건청)의 공기 중 오염 물질에 대한 규제 강화에 직면함에 따라 급속히 성장했습니다. 경비·구조용 로봇과 수중 점검 차량은 다양화되고 있지만 여전히 발전 단계에 있는 소비자용 제품군을 보완하고 있습니다.
2025년 매출액 중 하드웨어가 66.89%를 차지했습니다. 이는 LiDAR 및 비전 칩의 가격 하락으로 인해 비용에 민감한 업계에서의 도입이 확대된 데 기인합니다. 다중 모드 센서 세트와 브러쉬리스 DC 구동 장치를 통해 에너지 효율이 최대 30% 향상되었으며, 한편 리튬인산철 배터리는 열폭주 위험을 줄였습니다. 오픈소스 ROS 2를 중심으로 한 표준화를 통해 통합에 소요되는 리드타임이 수년에서 수개월로 단축되었으며, 공급업체는 맞춤형 펌웨어를 재작성할 필요 없이 납품 규모를 확대할 수 있게 되었습니다. 이러한 발전으로 인해 하드웨어는 여전히 지배적인 위치를 유지하고 있지만, 차별화는 꾸준히 줄어들고 있습니다.
소프트웨어, 차량 관리, 예측 유지보수를 포함한 서비스 스택은 2031년까지 연평균 성장률(CAGR) 20.29%로 확대될 것으로 예상되며, 이는 각 구성 요소 중 가장 높은 성장률입니다. “서비스형 로봇(RaaS)" 번들 덕분에 중소기업은 월 1,500달러부터 시작하는 요금으로 막대한 설비 투자를 피할 수 있게 되었으며, Seegrid사의 신규 계약에서 구독제 이용률은 70%를 넘어섰습니다. 경로 계획 및 배터리 관리를 최적화하는 AI 분석을 통해 처리량이 10-15% 향상되었으며, 소프트웨어는 최대의 차별화 요인으로서의 입지를 확고히 하고 있습니다. 5년간의 수명 주기 동안 서비스 수익은 초기 하드웨어 구매 가격의 3배에 달하는 경우가 많으며, 향후 수익원은 소프트웨어와 클라우드 플랫폼으로 점차 이동하고 있습니다.
지역별 분석
아시아태평양은 2025년 매출의 38.28%를 차지했으며, 2031년까지 연평균 성장률(CAGR) 20.57%로 성장할 것으로 전망되어, 서비스 로봇 시장에서 가장 규모가 크고 성장 속도가 가장 빠른 지역으로 자리매김하고 있습니다. 중국에서는 2025년에 50만 대 이상의 서비스 로봇이 생산되었으며, 현재 정부의 보조금을 통해 의료 및 물류 분야로의 도입이 지원되고 있습니다. 일본의 요양보험은 인증된 고령자 지원 기기의 비용을 최대 90%까지 지원하며, 파나소닉과 소프트뱅크 로보틱스의 국내 생산을 뒷받침하고 있습니다. 한국은 2028년까지 5만 대의 서비스 로봇을 도입하기 위한 1조 원(7억 5,000만 달러) 규모의 프로그램을 시작했습니다. 한편, 인도의 전자상거래 물류 센터에서는 2급 도시에서 수요 증가에 따라 자율 주행 로봇 군단의 실증 실험이 진행되고 있습니다. 호주의 대규모 농장에서는 드론을 이용한 농지 조사와 자율 주행 트랙터가 도입되어 있으며, 이미 3분의 1이 정밀 농업을 도입하고 있습니다.
2025년, 북미는 매출의 약 30%를 차지했습니다. 미국은 수술용 로봇 도입과 창고 자동화 분야에서 선도적인 위치를 차지하고 있으며, 국방부는 2026년도 예산안에서 무인 시스템에 25억 달러의 예산을 요청했습니다. 2025년에는 시야 외 비행(BVLOS)에 관한 FAA의 면제 허가 건수가 1만 2,000건으로 증가하면서, 드론을 활용한 점검 서비스가 활성화되었습니다. 캐나다의 프레리 지역에서는 계절적인 인력 부족 문제를 해결하기 위해 자율형 수확기가 도입되고 있으며, 멕시코의 공장에서는 니어쇼어링이 가속화됨에 따라 협동 로봇이 도입되고 있습니다.
2025년 시점에서 유럽은 시장 가치의 약 25%를 차지했습니다. 독일의 보험사는 돌봄 로봇에 대해 최대 5,000유로를 지급하고 있으며, 자동차 업계에서는 120만 건의 인력 부족을 메우기 위해 이동형 로봇 군을 도입하고 있습니다. 영국의 국민보건서비스(NHS)는 선택적 수술 대기 명단을 단축하기 위해 수술용 로봇에 5억 파운드를 배정하는 한편, 프랑스에서는 포도 가지치기와 과일 수확을 수행하는 농업용 로봇에 보조금을 지급하고 있습니다. 러시아에서는 센서 수입을 제한하는 제재 조치의 영향으로 시장 성장세가 둔화되고 있습니다. 중동 및 아프리카에서는 아랍에미리트와 사우디아라비아의 호텔, 병원, 항만 프로젝트가 수요의 주축을 이루고 있는 반면, 남아프리카의 광산에서는 자율 주행형 운반차가 도입되고 있습니다. 남미에서는 브라질의 사탕수수 및 대두 농장에서 드론과 트랙터의 시범 운영이 진행되고 있지만, 관세와 환율 변동이 도입 확대를 저해하고 있습니다.
기타 혜택 :
- 엑셀 형식 시장 예측(ME) 시트
- 3개월간의 애널리스트 지원
자주 묻는 질문
목차
제1장 서론
제2장 조사 방법
제3장 주요 요약
제4장 시장 구도
제5장 시장 규모 및 성장 예측
제6장 경쟁 구도
제7장 시장 기회 및 향후 전망
KTH 26.07.08According to Mordor Intelligence, the service robotics market size was valued at USD 68.31 billion in 2025 and is estimated to grow from USD 86.02 billion in 2026 to reach USD 209.72 billion by 2031, at a CAGR of 19.51% during the forecast period (2026-2031).
This report is Segmented by Field of Application (Professional, and Personal/Domestic), Component (Hardware, Software, Services), Operating Environment (Ground, Aerial/UAV, and More), Mobility (Mobile/Autonomous, and Stationary/Fixed-Base), End-User Industry (Agriculture, Defense and Security, Hospitality and Retail, and More), and Geography. The Market Forecasts are Provided in Terms of Value (USD).
Global Service Robotics Market Trends and Insights
Growing Demand for Automation in Healthcare, Logistics, and Agriculture
Hospitals performed more than 2 million robotic procedures in 2025 as da Vinci and Hugo systems expanded their indications, shortening operating room turnover and increasing surgical throughput. Peak-season e-commerce volumes pushed Amazon's robot fleet past 750,000 units, trimming pick times below 30 seconds and setting a new productivity benchmark. On farms, autonomous tractors equipped with real-time kinematic GPS extended operating windows to 24 hours, improving land utilization by 40%. Component vendors now reuse sensors across sectors, driving scale economies that depress unit prices and compress deployment cycles from years to months. This tri-sector pull reinforces the service robotics market's growth trajectory.
Rising Labor Shortages and Ageing Population
OECD members will lose 15 million workers between 2025 and 2030, intensifying competition for warehouse and caregiving staff. Japan projects a 690,000-worker elder-care gap by 2030 and now reimburses up to 90% of assistive robot costs, accelerating sales of transfer and bathing devices. Germany's statutory insurers offer EUR 5,000 (USD 5,650) per unit, broadening the addressable household market. In U.S. hospitality, 1.9 million vacancies prompted hotels to deploy delivery robots, freeing staff for revenue-generating guest services. Demographic pressure, therefore, acts as a durable catalyst for the service robotics market.
High CAPEX and Maintenance Costs
Surgical robots still cost USD 1.5-2.5 million, plus USD 150,000-200,000 yearly service contracts, constraining uptake to high-volume urban hospitals. Warehouses need fleets of 20-50 units, implying USD 1-2.5 million outlays before integration. 40% of operators cite budget ceilings as their top barrier, despite 24-month ROI models. Lithium-ion batteries require USD 5,000-8,000 in replacement costs every 3-4 years, and specialized technicians remain scarce outside major hubs. These costs slow diffusion in price-sensitive segments.
Other drivers and restraints analyzed in the detailed report include:
- Rapid AI-Sensor Convergence Lowers Robot TCO
- Robot-as-a-Service (RaaS) Subscriptions Unlock SME Adoption
- Safety-Cybersecurity Compliance Burden
For complete list of drivers and restraints, kindly check the Table Of Contents.
Segment Analysis
Professional service robots captured 52.44% of the service robotics market share in 2025, reflecting sustained investment in logistics automation and surgical suites. Logistics platforms remain the largest revenue pool because autonomous mobile robots cut pick-and-pack cycle times by 50-70%, while surgical systems add high-margin disposables, thereby increasing lifetime value. Field agriculture robots are gaining ground as autonomous tractors extend planting windows and drone scouts push yield-forecast accuracy past 90%. Inspection units for oil, gas, and telecom towers reduce confined-space exposure, keeping insurance premiums in check. Together, these use cases anchor professional demand and expand the overall service robotics market.
Consumer acceptance of domestic platforms also rose in 2025, as robotic vacuums and lawn mowers shipped 15 million units, yet their revenue base remains smaller than that of professional peers. Insurance-backed elder-assist robots outsell entertainment models in Japan and Germany because reimbursement covers up to USD 5,650 per device. Construction robots that automate demolition and concrete finishing grew briskly after contractors faced stricter OSHA limits on airborne contaminants. Security and rescue robots, along with underwater inspection vehicles, round out a diversified yet still emerging personal portfolio.
Hardware represented 66.89% of 2025 revenue, driven by falling lidar and vision-chip prices that widened adoption in budget-sensitive industries. Multi-modal sensor suites and brushless DC drives improved energy efficiency by up to 30%, while lithium-iron-phosphate batteries reduced the risk of thermal runaway. Standardization around open-source ROS 2 trimmed integration lead times from years to months, helping vendors scale deliveries without custom firmware rewrites. These advances keep hardware dominant but steadily less differentiated.
The services stack, including software, fleet management, and predictive maintenance, is projected to expand at a 20.29% CAGR through 2031, the fastest rate across components. Robot-as-a-service bundles let small and medium enterprises avoid large capital outlays with monthly fees starting at USD 1,500, pushing subscription penetration past 70% of Seegrid's new contracts. AI analytics that optimize path-planning and battery scheduling deliver 10-15% throughput gains, cementing software's role as the top differentiator. Over a five-year life, service revenues often triple the original hardware invoice, tilting future profit pools toward code and cloud platforms.
Complete Report Scope:
- By Field of Application
- Professional
- Field Robots
- Professional Cleaning
- Inspection and Maintenance
- Construction and Demolition
- Logistics Systems
- Medical Robots
- Rescue and Security
- Defense Robots
- Underwater Systems
- Powered Human Exoskeletons
- Public-Relation Robots
- Personal / Domestic
- Domestic Task Robots
- Entertainment Robots
- Elderly and Handicap Assistance
- Professional
- By Component
- Hardware
- Sensors
- Actuators
- Controllers and Drives
- Power Systems
- Software
- Operating Systems and Middleware
- AI and Analytics Algorithms
- Services
- Hardware
- By Operating Environment
- Ground
- Aerial / UAV
- Marine / Underwater
- By Mobility
- Mobile / Autonomous
- Stationary / Fixed-Base
- By End-User Industry
- Healthcare and Medical
- Logistics and Warehousing
- Agriculture
- Construction and Demolition
- Defense and Security
- Hospitality and Retail
- Education and Entertainment
- By Geography
- North America
- United States
- Canada
- Mexico
- Europe
- Germany
- United Kingdom
- France
- Russia
- Rest of Europe
- Asia-Pacific
- China
- Japan
- India
- South Korea
- Australia
- Rest of Asia-Pacific
- Middle East and Africa
- Middle East
- Saudi Arabia
- United Arab Emirates
- Rest of Middle East
- Africa
- South Africa
- Egypt
- Rest of Africa
- Middle East
- South America
- Brazil
- Argentina
- Rest of South America
- North America
Geography Analysis
Asia-Pacific captured 38.28% of 2025 revenue and is projected to grow at a 20.57% CAGR through 2031, making it the largest and fastest region for the service robotics market. China produced over 500,000 service robots in 2025, and government subsidies now underwrite installations in healthcare and logistics. Japan's Long-Term Care Insurance covers up to 90% of certified elder-assist devices, stimulating domestic production by Panasonic and SoftBank Robotics. South Korea launched a KRW 1 trillion (USD 750 million) program to seed 50,000 service robot deployments by 2028, while India's e-commerce fulfillment centers experiment with autonomous mobile fleets amid growing demand in tier-2 cities. Australia's broadacre farms adopt drone scouting and autonomous tractors, with one-third already using precision agriculture.
North America held roughly 30% of revenue in 2025. The United States leads surgical robot installations and warehouse automation, and the Department of Defense requested USD 2.5 billion for unmanned systems in its 2026 budget. FAA waivers for beyond-visual-line-of-sight grew to 12,000 in 2025, energizing drone inspection services. Canada's Prairie provinces deploy autonomous harvesters to counter seasonal labor gaps, and Mexican factories integrate collaborative robots as near-shoring accelerates.
Europe accounted for about 25% of the market value in 2025. Germany's insurers reimburse assistive robots up to EUR 5,000, and the automotive sector introduces mobile fleets to offset 1.2 million vacancies. The United Kingdom's NHS earmarked GBP 500 million for surgical robots to cut elective wait lists, while France subsidizes agricultural robots that prune vines and pick fruit. Russia's market growth lags due to sanctions that restrict the import of sensors. The Middle East and Africa see hotel, hospital, and port projects in the United Arab Emirates and Saudi Arabia anchoring demand, whereas South Africa's mines adopt autonomous haulage. In South America, Brazilian sugarcane and soybean farms are piloting drones and tractors, though tariffs and currency swings temper rollouts.
- iRobot Corporation
- Dematic Corp.
- Daifuku Co. Ltd.
- Swisslog Holding AG
- Omron Corporation
- SoftBank Robotics Group Corp.
- Pudu Robotics
- Boston Dynamics Inc.
- DJI Technology Co. Ltd.
- ABB Ltd.
- Seegrid Corporation
- Intuitive Surgical Inc.
- JBT Corporation
- SSI Schaefer AG
- Grenzebach GmbH
- Smith and Nephew plc
- Stryker Corporation
- Knightscope Inc.
- Kollmorgen Corporation
- Brokk AB
- Husqvarna AB
- Construction Robotics LLC
- Ecovacs Robotics
- Neato Robotics
- Transbotics Corporation
- Medtronic plc
- Northrop Grumman Corp.
- BAE Systems plc
- UBTECH Robotics Inc.
- SMP Robotics Systems
- Vision Robotics Corporation
- Naio Technologies SAS
Additional Benefits:
- The market estimate (ME) sheet in Excel format
- 3 months of analyst support
TABLE OF CONTENTS
1 INTRODUCTION
- 1.1 Study Assumptions and Market Definition
- 1.2 Scope of the Study
2 RESEARCH METHODOLOGY
3 EXECUTIVE SUMMARY
4 MARKET LANDSCAPE
- 4.1 Market Overview
- 4.2 Market Drivers
- 4.2.1 Growing Demand for Automation in Healthcare, Logistics and Agriculture
- 4.2.2 Rising Labour Shortages and Ageing Population
- 4.2.3 Rapid AI-Sensor Convergence Lowers Robot TCO
- 4.2.4 Robot-as-a-Service (RaaS) Subscriptions Unlock SME Adoption
- 4.2.5 Eldercare Insurance Reimbursements for Assistive Robots
- 4.2.6 Dark-Store Micro-Fulfilment Boom Needs AMRs
- 4.3 Market Restraints
- 4.3.1 High CAPEX and Maintenance Costs
- 4.3.2 Safety-Cybersecurity Compliance Burden
- 4.3.3 Lithium-Battery Shipping Rules Limit Mobile Robots
- 4.3.4 VC Funding Correction for Consumer-Robotics Start-ups
- 4.4 Industry Value Chain Analysis
- 4.5 Regulatory Landscape
- 4.6 Technological Outlook
- 4.7 Impact of Macroeconomic Factors on the Market
- 4.8 Porter's Five Forces Analysis
- 4.8.1 Bargaining Power of Suppliers
- 4.8.2 Bargaining Power of Consumers
- 4.8.3 Threat of New Entrants
- 4.8.4 Intensity of Competitive Rivalry
- 4.8.5 Threat of Substitutes
5 MARKET SIZE AND GROWTH FORECASTS (VALUE)
- 5.1 By Field of Application
- 5.1.1 Professional
- 5.1.1.1 Field Robots
- 5.1.1.2 Professional Cleaning
- 5.1.1.3 Inspection and Maintenance
- 5.1.1.4 Construction and Demolition
- 5.1.1.5 Logistics Systems
- 5.1.1.6 Medical Robots
- 5.1.1.7 Rescue and Security
- 5.1.1.8 Defense Robots
- 5.1.1.9 Underwater Systems
- 5.1.1.10 Powered Human Exoskeletons
- 5.1.1.11 Public-Relation Robots
- 5.1.2 Personal / Domestic
- 5.1.2.1 Domestic Task Robots
- 5.1.2.2 Entertainment Robots
- 5.1.2.3 Elderly and Handicap Assistance
- 5.1.1 Professional
- 5.2 By Component
- 5.2.1 Hardware
- 5.2.1.1 Sensors
- 5.2.1.2 Actuators
- 5.2.1.3 Controllers and Drives
- 5.2.1.4 Power Systems
- 5.2.2 Software
- 5.2.2.1 Operating Systems and Middleware
- 5.2.2.2 AI and Analytics Algorithms
- 5.2.3 Services
- 5.2.1 Hardware
- 5.3 By Operating Environment
- 5.3.1 Ground
- 5.3.2 Aerial / UAV
- 5.3.3 Marine / Underwater
- 5.4 By Mobility
- 5.4.1 Mobile / Autonomous
- 5.4.2 Stationary / Fixed-Base
- 5.5 By End-User Industry
- 5.5.1 Healthcare and Medical
- 5.5.2 Logistics and Warehousing
- 5.5.3 Agriculture
- 5.5.4 Construction and Demolition
- 5.5.5 Defense and Security
- 5.5.6 Hospitality and Retail
- 5.5.7 Education and Entertainment
- 5.6 By Geography
- 5.6.1 North America
- 5.6.1.1 United States
- 5.6.1.2 Canada
- 5.6.1.3 Mexico
- 5.6.2 Europe
- 5.6.2.1 Germany
- 5.6.2.2 United Kingdom
- 5.6.2.3 France
- 5.6.2.4 Russia
- 5.6.2.5 Rest of Europe
- 5.6.3 Asia-Pacific
- 5.6.3.1 China
- 5.6.3.2 Japan
- 5.6.3.3 India
- 5.6.3.4 South Korea
- 5.6.3.5 Australia
- 5.6.3.6 Rest of Asia-Pacific
- 5.6.4 Middle East and Africa
- 5.6.4.1 Middle East
- 5.6.4.1.1 Saudi Arabia
- 5.6.4.1.2 United Arab Emirates
- 5.6.4.1.3 Rest of Middle East
- 5.6.4.2 Africa
- 5.6.4.2.1 South Africa
- 5.6.4.2.2 Egypt
- 5.6.4.2.3 Rest of Africa
- 5.6.4.1 Middle East
- 5.6.5 South America
- 5.6.5.1 Brazil
- 5.6.5.2 Argentina
- 5.6.5.3 Rest of South America
- 5.6.1 North America
6 COMPETITIVE LANDSCAPE
- 6.1 Market Concentration
- 6.2 Strategic Moves
- 6.3 Market Share Analysis
- 6.4 Company Profiles (includes Global Level Overview, Market Level Overview, Core Segments, Financials as Available, Strategic Information, Market Rank/Share for Key Companies, Products and Services, and Recent Developments)
- 6.4.1 iRobot Corporation
- 6.4.2 Dematic Corp.
- 6.4.3 Daifuku Co. Ltd.
- 6.4.4 Swisslog Holding AG
- 6.4.5 Omron Corporation
- 6.4.6 SoftBank Robotics Group Corp.
- 6.4.7 Pudu Robotics
- 6.4.8 Boston Dynamics Inc.
- 6.4.9 DJI Technology Co. Ltd.
- 6.4.10 ABB Ltd.
- 6.4.11 Seegrid Corporation
- 6.4.12 Intuitive Surgical Inc.
- 6.4.13 JBT Corporation
- 6.4.14 SSI Schaefer AG
- 6.4.15 Grenzebach GmbH
- 6.4.16 Smith and Nephew plc
- 6.4.17 Stryker Corporation
- 6.4.18 Knightscope Inc.
- 6.4.19 Kollmorgen Corporation
- 6.4.20 Brokk AB
- 6.4.21 Husqvarna AB
- 6.4.22 Construction Robotics LLC
- 6.4.23 Ecovacs Robotics
- 6.4.24 Neato Robotics
- 6.4.25 Transbotics Corporation
- 6.4.26 Medtronic plc
- 6.4.27 Northrop Grumman Corp.
- 6.4.28 BAE Systems plc
- 6.4.29 UBTECH Robotics Inc.
- 6.4.30 SMP Robotics Systems
- 6.4.31 Vision Robotics Corporation
- 6.4.32 Naio Technologies SAS
7 MARKET OPPORTUNITIES AND FUTURE OUTLOOK
- 7.1 White-Space and Unmet-Need Assessment


