|
시장보고서
상품코드
2073436
미국의 태양에너지 : 시장 점유율 분석, 업계 동향 및 통계, 성장 예측(2026-2031년)United States Solar Energy - Market Share Analysis, Industry Trends & Statistics, Growth Forecasts (2026 - 2031) |
||||||
 Mordor Intelligence
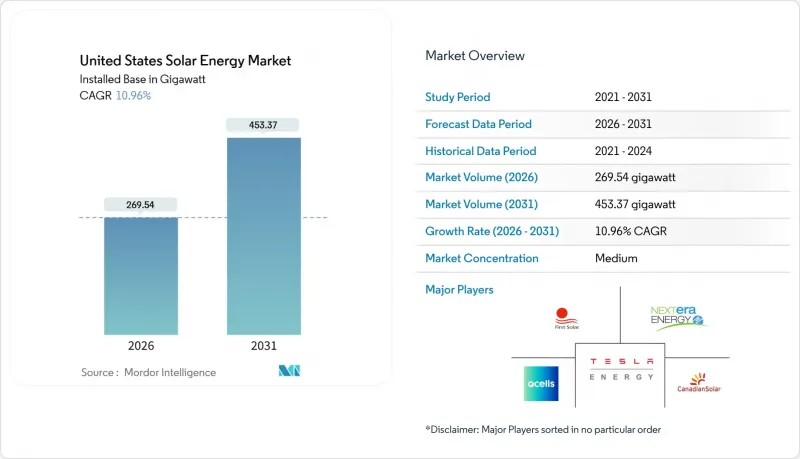
Mordor Intelligence에 의하면, 미국의 태양에너지 시장 규모(설치용량 기반)는 2026년 269.54기가와트에서 2031년까지 453.37기가와트로 확대되어 예측 기간(2026-2031년) CAGR은 10.96%를 나타낼 것으로 전망되고 있습니다.
본 보고서는 기술별(태양광 발전 및 집광형 태양광 발전), 계통 연계 형태별(계통 연계형 및 독립형), 최종 사용자별(유틸리티 규모, 상업 및 산업용, 주거용)로 분류되어 있습니다. 시장 규모 및 전망은 설치 용량(GW) 단위로 표시되어 있습니다.
미국의 태양에너지 시장 동향 및 인사이트
'인플레이션 억제법'의 세제 혜택이 유틸리티 규모의 전력 구매 계약(PPA)을 촉진하고 있습니다.
상한선이 없는 30%의 투자 세액 공제와 2034년까지 연장된 1MWh당 26달러의 생산 세액 공제로 인해, 호황과 불황이 반복되던 조달 주기가 막을 내렸고, 한때 경제성 측면에서 남서부 지역에 뒤처져 있던 오하이오주와 펜실베이니아주에서도 개발업체들이 프로젝트 자금 조달이 가능해졌습니다. 현행 임금 및 국내 조달률에 대한 가산 조치를 결합함으로써, 세제상의 혜택 총액을 프로젝트 비용의 50% 이상으로 높일 수 있게 되었으며, 이러한 변화로 인해 EPA의 ‘굿 네이버 플랜’ 해당 석탄 화력 발전 폐지 지역에 자본이 재분배되도록 되어 있습니다. 기업 구매자들은 2024년에 16.6GW 규모의 태양광 발전 PPA를 체결했으며, IRA에 따른 확실성 덕분에 수익 위험이 완화되었기 때문에 15-20년의 계약 기간에도 문제없이 대응하고 있습니다. 그 결과, 프로젝트 파이프라인의 다각화가 진행되면서 미국의 태양에너지 시장의 행보는 기존의 '썬벨트'주 경계를 넘어 확산되고 있습니다. 그 결과, 장기적인 발전 용량 증가는 연방 정책의 만료 시점보다는 송전망 업그레이드 일정에 더 밀접하게 연동되게 되었습니다.
그리드 에지형 에너지 저장 시스템과의 결합이 프로젝트의 자금 조달 가능성을 높입니다.
2024년, 계통 연계 대기 목록에 등재된 발전 용량의 63%를 태양광과 축전지를 결합한 하이브리드 프로젝트가 차지했습니다. 이는 가속 상각의 이점 외에도, 낮 시간대의 도매 가격이 3배로 치솟는 시간대에 에너지를 저녁 시간대로 전환할 수 있다는 점이 뒷받침하고 있습니다. 캘리포니아주의 NEM 3.0 제도에 따라 단독 태양광 발전 시스템의 투자 회수 기간은 길어졌지만, 10kWh 용량의 축전지를 추가함으로써 주택 소유주의 투자 수익률(ROI)이 회복되고, 가격이 급등하는 해질녘 피크 시간대의 전력망 수요가 안정화됩니다. 텍사스주의 전력 사업자가 추진하는 개발 프로젝트에서는 ERCOT의 수급 긴축 시 가격(2024년 8월 폭염 당시 1MWh당 5,000달러까지 급등)에 대응하기 위해 4시간 가동 가능한 리튬이온 축전 시스템을 상시 설치하고 있습니다. 금융기관들은 현재 에너지 저장 시스템과 결합된 자산을 위험이 낮은 것으로 간주하고 있으며, 이에 따라 신용 스프레드를 최대 30베이시스포인트 축소하고 있습니다. 이러한 신용 면에서의 우위 덕분에 미국 전역의 태양에너지 시장에서 통합형 시스템 시장 침투가 가속화되고 있습니다.
계통 연계 대기열의 병목 현상으로 인해 리드타임이 36개월 이상으로 연장됨
2024년 중반, 2,600GW를 초과하는 발전 및 저장 설비가 미국의 연결 대기 목록에 적체되어 있으며, 그중 95%가 태양광, 풍력 또는 배터리 저장 설비에 의한 것으로, 이는 기존 송전망 용량의 2.4배에 해당합니다. MISO와 PJM에서는 평균 대기 시간이 5년에 달하고 있으며, 이로 인해 보유 비용이 상승하고 프로젝트의 내부수익률(IRR)이 최대 12% 하락하고 있습니다. '오더 2023' 클러스터 조사 개혁에 따라 신규 신청 처리 효율이 높아질 전망이지만, 1,350 GW에 달하는 기존 프로젝트는 여전히 기존 규정의 적용 대상이며, 2028년까지 승인될 가능성은 낮은 상황입니다. 개발업체들은 대기 시간이 짧고 계획 조정이 잘 이루어지고 있는 플로리다주나 캐롤라이나주 등, 수직 통합형 전력 회사가 지배적인 주로의 진출을 점점 더 확대되고 있습니다. 그렇긴 하지만, 장기화되고 있는 지연으로 인해 미국의 태양에너지 시장 전체의 성장 전망은 여전히 둔화되고 있습니다.
부문별 분석
2025년, 태양광 발전은 미국의 태양에너지 시장의 99.35%를 차지했으며, 2031년까지 연평균 성장률(CAGR) 10.98%로 성장할 전망입니다. 퍼스트 솔라(First Solar)사의 테룰화 카드뮴 기술은 설비 용량의 5% 미만에 그치고 있지만, 탄소 발자국이 낮고 국내 생산품으로 인정받고 있어 IRA(인플레이션 억제법)의 가산액을 최대한 활용할 수 있어 급속히 성장하고 있습니다. TOPCon 셀은 모듈 효율을 23%까지 향상시켜 시스템 전체의 비용을 절감하는 동시에, 결정질 실리콘의 우위를 더욱 공고히 하고 있습니다. 현재 양면 수광형 모듈은 유틸리티급 발전소의 60%를 차지하고 있으며, 반사율이 높은 설치 장소에서는 10-20%의 추가 발전량을 가져옵니다. 이 특성은 유틸리티 분야 RFP의 60%에 명시되어 있습니다.
집광형 태양광 발전은 여전히 남서부 지역의 기존 부지에 국한되어 있으며, 리튬 이온 배터리의 3배에 달하는 용융염 축열 비용의 제약으로 인해 연평균 성장률(CAGR)은 고작 2.1%에 그치고 있습니다. 페로브스카이트-실리콘 탠덤 전지는 2024년에 실험실 환경에서 33.9%의 효율을 달성했으나, 내구성 문제에 직면해 있어 2030년 이후에 상용화될 것으로 예측됩니다. 결정질 실리콘이 주류를 이루고 있는 반면, 박막 기술의 부상으로 공급망 리스크가 완화되면서 시장의 회복력이 강화되고 있습니다. 루이지애나주와 오하이오주의 신규 제조 공장이 가동을 시작함에 따라, 박막 관련 미국의 태양에너지 시장 규모는 2031년까지 3배로 증가할 것으로 전망됩니다.
기타 혜택 :
- 엑셀 형식 시장 예측(ME) 시트
- 3개월간의 애널리스트 지원
자주 묻는 질문
목차
제1장 서론
제2장 조사 방법
제3장 주요 요약
제4장 시장 구도
제5장 시장 규모 및 성장 예측
제6장 경쟁 구도
제7장 시장 기회 및 향후 전망
KTH 26.07.07According to Mordor Intelligence, the united states solar energy market size in terms of installed base is expected to grow from 269.54 gigawatt in 2026 to 453.37 gigawatt by 2031, at a CAGR of 10.96% during the forecast period (2026-2031).
This report is Segmented by Technology (Solar Photovoltaic and Concentrated Solar Power), Grid Type (On-Grid and Off-Grid), and End-User (Utility-Scale, Commercial and Industrial, and Residential). The Market Sizes and Forecasts are Provided in Terms of Installed Capacity (GW).
United States Solar Energy Market Trends and Insights
Inflation Reduction Act Tax Incentives Accelerating Utility-Scale PPAs
The uncapped 30% investment tax credit and USD 26 per MWh production tax credit extended through 2034 have ended boom-bust procurement cycles, enabling developers to underwrite projects in Ohio and Pennsylvania that once trailed the Southwest on economics. Stacking prevailing-wage and domestic-content adders can lift total tax benefits above 50% of project cost, a shift redirecting capital toward coal-retirement regions under EPA's Good Neighbor Plan. Corporate buyers contracted 16.6 GW of solar PPAs in 2024 and are comfortable with 15- to 20-year tenors because IRA certainty reduces revenue risk. The resulting pipeline diversification is broadening the United States solar energy market footprint beyond traditional sunbelt states. As a result, long-term capacity growth now aligns more closely with transmission-upgrade schedules than with federal policy sunsets.
Grid-Edge Storage Pairing Enhancing Project Bankability
Hybrid solar-plus-battery projects represented 63% of capacity in interconnection queues during 2024, driven by accelerated depreciation benefits and the ability to shift energy into evening hours when wholesale prices triple midday levels. California's NEM 3.0 regime lengthened standalone-solar payback periods, but adding a 10 kWh battery restores homeowner ROI and stabilizes grid demand during high-priced twilight peaks. Utility developers in Texas routinely attach 4-hour lithium-ion systems to capture ERCOT scarcity pricing, which surged to USD 5,000 per MWh during the August 2024 heatwave. Lenders now view storage-paired assets as lower risk, tightening debt spreads by up to 30 basis points. This credit advantage is accelerating market penetration of integrated systems across the United States solar energy market.
Interconnection Queue Bottlenecks Increasing Lead-Times Beyond 36 Months
More than 2,600 GW of generation and storage sat in U.S. queues by mid-2024, 95% of it solar, wind, or batteries-equal to 2.4 times existing grid capacity. Wait times average five years in MISO and PJM, lifting holding costs and eroding project IRRs by up to 12%. While Order 2023's cluster-study reforms will streamline new applications, 1,350 GW of legacy projects remain under old rules and are unlikely to clear before 2028. Developers increasingly pursue vertically integrated-utility states, such as Florida and the Carolinas, where queues are shorter and planning is coordinated. Nevertheless, prolonged delays continue to dampen the overall growth outlook for the United States solar energy market.
Other drivers and restraints analyzed in the detailed report include:
- Corporate Net-Zero Mandates Spurring C&I Power-Purchase Agreements
- Community-Solar Programs Expanding Access in High-Population States
- Section 201/301 Trade Actions Causing Module-Price Volatility
For complete list of drivers and restraints, kindly check the Table Of Contents.
Segment Analysis
Solar photovoltaics held 99.35% of the United States solar energy market in 2025, expanding at a 10.98% CAGR through 2031. First Solar's cadmium-telluride technology, though under 5% of capacity, grows swiftly because its lower carbon footprint and domestic-content status unlock maximum IRA adders. TOPCon cells boost module efficiencies to 23%, trimming balance-of-system costs and reinforcing crystalline silicon's lead. Bifacial modules now account for 60% of utility plants, delivering 10-20% extra yield on reflective sites, an attribute written into 60% of utility RFPs.
Concentrated solar power remains confined to legacy southwestern sites, rising only 2.1% CAGR, constrained by molten-salt storage costs three times higher than lithium-ion batteries. Perovskite-silicon tandems hit 33.9% lab efficiency in 2024 but face durability hurdles, implying commercial rollout post-2030. While crystalline silicon dominates, thin-film's rise tempers supply-chain risk, reinforcing resilience in the market. The United States solar energy market size tied to thin-film is projected to triple by 2031 as new fabs in Louisiana and Ohio come online.
Complete Report Scope:
- By Technology
- Solar Photovoltaic (PV)
- Concentrated Solar Power (CSP)
- By Grid Type
- On-Grid
- Off-Grid
- By End-User
- Utility-Scale
- Commercial and Industrial (C&I)
- Residential
- By Component (Qualitative Analysis)
- Solar Modules/Panels
- Inverters (String, Central, Micro)
- Mounting and Tracking Systems
- Balance-of-System and Electricals
- Energy Storage and Hybrid Integration
List of Companies Covered in this Report:
- First Solar Inc.
- NextEra Energy Inc.
- SunPower Corporation
- Hanwha Q CELLS USA Corp.
- Canadian Solar Inc.
- JinkoSolar Holding Co. Ltd.
- Tesla Energy
- Sunrun Inc.
- 8minute Solar Energy
- SOLV Energy LLC
- Mortenson Construction
- Rosendin Electric Inc.
- Renewable Energy Systems Americas
- Brookfield Renewable US
- EDF Renewables North America
- Enphase Energy Inc.
- Trina Solar Ltd.
- LONGi Solar
- REC Group (REC Solar Norway AS)
- Array Technologies Inc.
- Nextracker Inc.
Additional Benefits:
- The market estimate (ME) sheet in Excel format
- 3 months of analyst support
TABLE OF CONTENTS
1 Introduction
- 1.1 Study Assumptions & Market Definition
- 1.2 Scope of the Study
2 Research Methodology
3 Executive Summary
4 Market Landscape
- 4.1 Market Overview
- 4.2 Market Drivers
- 4.2.1 Inflation Reduction Act (IRA) Tax Incentives Accelerating Utility-Scale PPAs
- 4.2.2 Grid-Edge Storage Pairing Enhancing Project Bankability
- 4.2.3 Corporate Net-Zero Mandates Spurring C&I Power-Purchase Agreements
- 4.2.4 Community-Solar Programs Expanding Access in High-Population States
- 4.2.5 Domestic Manufacturing Credits Cutting Module Import Risk
- 4.2.6 Agrivoltaics Improving Land-Use Economics in the Midwest
- 4.3 Market Restraints
- 4.3.1 Interconnection Queue Bottlenecks Increasing Lead-Times Beyond 36 Months
- 4.3.2 Section 201/301 Trade Actions Causing Module-Price Volatility
- 4.3.3 Rising Transmission Congestion Curtailing Southwest Utility Projects
- 4.3.4 Skilled-Labor Shortage Inflating EPC Costs by >18 % YoY
- 4.4 Supply-Chain Analysis
- 4.5 Regulatory & Policy Outlook (Federal + State)
- 4.6 Technological Outlook (TOPCon, HJT, Perovskites, Bifacial)
- 4.7 Porter's Five Forces
- 4.7.1 Threat of New Entrants
- 4.7.2 Bargaining Power of Suppliers
- 4.7.3 Bargaining Power of Buyers
- 4.7.4 Threat of Substitutes (Wind, RNG, Long-Duration Storage)
- 4.7.5 Competitive Rivalry
- 4.8 PESTLE Analysis
5 Market Size & Growth Forecasts
- 5.1 By Technology
- 5.1.1 Solar Photovoltaic (PV)
- 5.1.2 Concentrated Solar Power (CSP)
- 5.2 By Grid Type
- 5.2.1 On-Grid
- 5.2.2 Off-Grid
- 5.3 By End-User
- 5.3.1 Utility-Scale
- 5.3.2 Commercial and Industrial (C&I)
- 5.3.3 Residential
- 5.4 By Component (Qualitative Analysis)
- 5.4.1 Solar Modules/Panels
- 5.4.2 Inverters (String, Central, Micro)
- 5.4.3 Mounting and Tracking Systems
- 5.4.4 Balance-of-System and Electricals
- 5.4.5 Energy Storage and Hybrid Integration
6 Competitive Landscape
- 6.1 Market Concentration
- 6.2 Strategic Moves (M&A, Partnerships, PPAs)
- 6.3 Market Share Analysis (Market Rank/Share for key companies)
- 6.4 Company Profiles (includes Global level Overview, Market level overview, Core Segments, Financials as available, Strategic Information, Products & Services, and Recent Developments)
- 6.4.1 First Solar Inc.
- 6.4.2 NextEra Energy Inc.
- 6.4.3 SunPower Corporation
- 6.4.4 Hanwha Q CELLS USA Corp.
- 6.4.5 Canadian Solar Inc.
- 6.4.6 JinkoSolar Holding Co. Ltd.
- 6.4.7 Tesla Energy
- 6.4.8 Sunrun Inc.
- 6.4.9 8minute Solar Energy
- 6.4.10 SOLV Energy LLC
- 6.4.11 Mortenson Construction
- 6.4.12 Rosendin Electric Inc.
- 6.4.13 Renewable Energy Systems Americas
- 6.4.14 Brookfield Renewable US
- 6.4.15 EDF Renewables North America
- 6.4.16 Enphase Energy Inc.
- 6.4.17 Trina Solar Ltd.
- 6.4.18 LONGi Solar
- 6.4.19 REC Group (REC Solar Norway AS)
- 6.4.20 Array Technologies Inc.
- 6.4.21 Nextracker Inc.
7 Market Opportunities & Future Outlook
- 7.1 White-Space & Unmet-Need Assessment