

|
시장보고서
상품코드
2073441
데이터센터 블레이드 서버 : 시장 점유율 분석, 업계 동향 및 통계, 성장 예측(2026-2031년)Data Center Blade Server - Market Share Analysis, Industry Trends & Statistics, Growth Forecasts (2026 - 2031) |
||||||
 Mordor Intelligence
Mordor Intelligence에 의하면, 2026년 데이터센터 블레이드 서버 시장 규모는 196억 1,000만 달러에 달할 것으로 예상됩니다. 2025년 182억 달러에서 확대해, 2031년에는 284억 5,000만 달러에 이를 것으로 예측됩니다.
2026년부터 2031년까지의 연평균 성장률(CAGR)은 7.73%를 나타낼 것으로 전망됩니다.
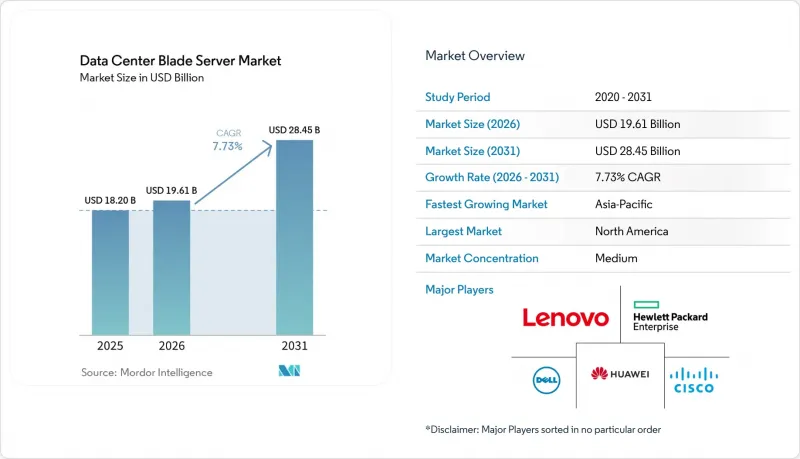
본 보고서에서는 산업을 데이터센터 티어(Tier 1, Tier 2, 기타), 폼 팩터(하프 하이트 블레이드, 풀 하이트 블레이드, 기타), 최종 사용자 산업(은행, 금융서비스 및 보험(BFSI), 제조, 기타), 데이터센터 유형(하이퍼스케일러/클라우드 서비스 제공업체, 기타), 지역(아시아태평양, 유럽, 기타)별로 분류하고 있습니다. 시장 전망은 금액(달러) 기준으로 제시되어 있습니다.
세계의 데이터센터 블레이드 서버 시장 동향 및 인사이트
AI/ML 워크로드를 지원하는 랙 수준의 전력 밀도 급증
AI 추론 및 훈련 클러스터 덕분에 랙의 전력 밀도가 기존 10-15 kW에서 30-50 kW로 확대되고 있습니다. Open Compute Project의 OSAI 사양은 250 kW에서 1 MW 규모의 랙 아키텍처를 목표로 하고 있으며, 블레이드 벤더들에게 고효율 전압 조정기 및 직접 액체 냉각 방식의 통합을 촉진하고 있습니다. Dell의 PowerEdge XE9680L은 섀시 수준의 기류, 콜드 플레이트 루프, AI 전용 가속기가 열적 스로틀링 현상 없이 공존할 수 있음을 입증하고 있습니다. 국제에너지기구(IEA)는 AI 전용 데이터센터의 전력 소비량이 2030년까지 945 TWh에 달할 가능성이 있다고 예측하고 있으며, 이에 따라 전력 효율이 뛰어난 블레이드 설계가 사업자 전략의 핵심으로 자리 잡고 있습니다.
엣지 클라우드의 융합이 마이크로 모듈형 데이터센터 도입을 가속화
5G의 확산과 초저지연 서비스로 인해 컴퓨팅이 네트워크 에지로 이동하고 있으며, 배선과 냉각 시스템이 사전에 구축된 상태로 출하 가능한 마이크로 모듈형 데이터센터에 대한 수요가 발생하고 있습니다. 구글의 모듈형 엣지 시설에 관한 특허는 전력 공급과 열 교환 기능을 통합한, 보안이 강화된 멀티테넌트형 랙 어셈블리의 중요성을 입증하고 있습니다. 통신 사업자들은 6,000억 달러 규모의 설비 투자 계획 중 상당 부분을 이러한 엣지 사이트에 할당하고 있으며, 이에 따라 블레이드 벤더들에게는 제한된 설치 공간에 맞추어 설계된 쿼터 하이트 노드를 공급할 수 있는 좋은 기회가 생기고 있습니다.
실리콘 포토닉스와 800GbE 백플레인으로의 전환에 따른 설비 투자의 급증
포토닉 집적 회로와 800GbE 패브릭으로의 전환을 통해 지연 시간과 대역폭이 개선될 것으로 기대되지만, 새로운 섀시, 미드플레인 커넥터, 리타이머 카드가 필요합니다. 각국의 규제 당국은 효율성 향상을 인정하는 한편, 특히 중견 기업의 경우 초기 도입에 막대한 자본 비용이 소요된다는 점에 주의를 환기하고 있습니다. CXL을 통한 메모리 분산에 관한 조사 결과, 투자 회수에 수년이 소요될 것으로 나타나 통신 사업자들은 단계적으로 업그레이드를 실시할 수밖에 없는 상황에 놓여 있습니다.
부문별 분석
2025년, Tier 3 시설은 데이터센터 블레이드 서버 시장의 42.05%를 차지했습니다. 이는 해당 N+1 중복성 프로파일이 주류 엔터프라이즈 SLA와 부합하기 때문입니다. 티어 4 사이트는 그 수가 적음에도 불구하고, AI 훈련 클러스터의 내결함성 수요에 힘입어 연평균 성장률(CAGR) 11.63%로 성장할 것으로 전망됩니다. 이러한 기세를 바탕으로, 티어 4는 100% 수냉식 섀시와 실리콘 포토닉스 상호 연결 기술을 검증하는 장으로서의 입지를 확고히 하고 있습니다.
일반적으로 엣지 통합 및 지사 워크로드를 처리하는 Tier 1 및 Tier 2 시설의 운영 사업자는 비용 관리를 유지하면서 더 뛰어난 자동화를 실현하기 위해 표준화된 블레이드를 채택하고 있습니다. Infrastructure Masons의 보고서에 따르면, 현재 전력 소비 증가분의 90%는 AI 모델 훈련에서 비롯된 것이며, 이러한 부하는 현재 더 높은 전력 소비량과 랙 밀도를 감당해야 하는 소규모 사이트로도 확산되고 있습니다. 그 결과, 각 벤더들은 저티어 룸에 컨테이너먼트 아일이나 리어 도어형 열교환기를 사후 장착할 수 있는 키트를 상품화하여, 데이터센터 블레이드 서버 시장 전체의 성장세를 유지하고 있습니다.
2025년에는 하프 하이트 블레이드가 매출의 48.02%를 차지했으며, 듀얼 소켓 CPU, 충분한 DIMM 슬롯, 대부분의 가상화 및 데이터베이스 작업을 처리할 수 있는 PCIe 확장 기능을 갖추고 있습니다. 이 제품들은 엔터프라이즈용 코로케이션 랙의 주력 제품으로 자리매김하고 있습니다. 풀 하이트 모델은 인메모리 분석 등, 쿼드 소켓 환경에서 메모리에 의존하는 워크로드를 지속적으로 지원하고 있습니다.
쿼터 하이트 및 마이크로블레이드 노드는 10U 셸프당 16-32개의 컴퓨팅 스레드를 수용할 수 있어 제한된 엣지 설치 공간에 최적이며, 연평균 성장률(CAGR) 13.39%를 기록하며 가장 빠르게 성장하는 부문으로 자리매김하고 있습니다. 현재 각 벤더사는 이러한 소형 스레드에 GPU 가속기를 통합하여, 휴대전화 기지국에서 실시간 추론을 가능하게 하고 있습니다. Open Rack v3 사양과의 호환성 덕분에 동일한 캐비닛 내에서 혼합 구성이 가능해졌으며, 이는 데이터센터 블레이드 서버 시장에서 엣지 구축의 흐름을 뒷받침하고 있습니다.
지역별 분석
2025년, 북미는 데이터센터 블레이드 서버 시장의 41.88%를 차지했습니다. 이는 버지니아주 북부, 텍사스주, 실리콘밸리에 위치한 하이퍼스케일 캠퍼스가 주도한 결과입니다. 로렌스 버클리 국립연구소의 추산에 따르면, 2023년 미국 데이터센터의 전력 소비량은 176 TWh에 달했으며, 시설의 PUE를 낮추기 위해 수냉식 블레이드 서버의 도입이 시급한 과제로 대두되고 있습니다. 캐나다와 멕시코에서는 지역별 주권 클라우드 및 재해 복구 구역을 통해 수요가 서서히 증가하고 있습니다.
아시아태평양은 2026년부터 2031년까지 연평균 성장률(CAGR) 11.92%를 기록하며 가장 빠르게 성장하고 있는 지역입니다. 중국에서는 대규모 AI 클라우드 클러스터가 구축되고 있는 반면, 인도에서는 디지털 경제 목표를 달성하기 위해 2030년까지 설치 용량을 1.35GW에서 5GW로 확대해야 합니다. 싱가포르의 정책 체계에서는 고밀도 블레이드나 열회수 칠러를 도입한 설계에 대해 용량 허가를 우선적으로 부여하고 있습니다. 일본과 호주에서는 해저 케이블 상륙국에 따라 에지 인프라를 확장하고, 컨텐츠 캐싱을 위해 쿼터 하이트 블레이드를 도입하고 있습니다. 유럽에서는 엄격한 효율성 및 데이터 주권 관련 규제 프레임워크 안에서 꾸준한 성장이 나타나고 있습니다. “에코디자인 2019/424"의 개정에 따라, 35°C 이상의 온수 냉각에 대응하는 블레이드 섀시가 권장되며, 지역 열 공급 루프와의 통합이 용이해졌습니다. 중동 및 아프리카에서는 핀테크 및 게임 산업 고객을 위한 클라우드 온램프에 대한 투자가 활발해지고 있습니다. 남미에서는 브라질의 인터넷 교환 허브 주변에 도입이 집중되어 있으며, 통신 사업자들은 계절적 트래픽 급증에 대응하기 위해 컴포저블 블레이드를 도입하고 있습니다. 이러한 지역별 동향은 데이터센터 블레이드 서버 시장의 세계적 중요성을 뒷받침하고 있습니다.
기타 혜택
- 엑셀 형식 시장 예측(ME) 시트
- 3개월간의 애널리스트 지원
자주 묻는 질문
목차
제1장 서론
제2장 조사 방법
제3장 주요 요약
제4장 시장 구도
제5장 시장 규모 및 성장 예측
제6장 경쟁 구도
제7장 시장 기회 및 향후 전망
KTH 26.07.08According to Mordor Intelligence, data center blade server market size in 2026 is estimated at USD 19.61 billion, growing from 2025 value of USD 18.2 billion with 2031 projections showing USD 28.45 billion, growing at 7.73% CAGR over 2026-2031.
This report Segments the Industry Into Type (Tier 1, Tier 2, and More), Form Factor(Half-Height Blades, Full-Height Blades, and More), End-User Verticals (BFSI, Manufacturing, and More), Data Center Type(Hyperscalers/Cloud Service Provider, and More) and Geography (Asia-Pacific, Europe, and More). The Market Forecasts are Provided in Terms of Value (USD).
Global Data Center Blade Server Market Trends and Insights
Surging Rack-Level Power Density Accommodates AI/ML Workloads
AI inference and training clusters now push rack envelopes from 10-15 kW toward 30-50 kW. The Open Compute Project's OSAI specification targets 250 kW to 1 MW rack architectures, encouraging blade vendors to integrate high-efficiency voltage regulators and direct liquid cooling. Dell's PowerEdge XE9680L demonstrates how chassis-level airflow, cold-plate loops, and AI-specific accelerators can coexist without thermal throttling. The International Energy Agency projects that AI-focused data centers could consume 945 TWh by 2030, which keeps power-efficient blade design at the center of operator strategies
Edge-Cloud Convergence Accelerating Deployment in Micro-Modular DCs
5G rollouts and ultra-low-latency services push compute to the network edge, spawning demand for micro-modular data centers that can ship pre-wired and pre-cooled. Google's patent for modular edge facilities confirms the importance of secure, multitenant rack assemblies with integrated power and heat exchange. Telecom operators are allocating a sizeable share of their USD 600 billion CAPEX plan to such edge sites, giving blade vendors an opening to supply quarter-height nodes tailored for constrained footprints
CapEx Spike from Silicon-Photonics and 800 GbE Backplane Migration
Switching to photonic integrated circuits and 800 GbE fabrics unlocks latency and bandwidth gains but demands new chassis, mid-plane connectors and retimer cards. National agencies acknowledge the efficiency upside yet caution that early deployments bear heavy capital costs, particularly for mid-sized enterprises. Research into memory disaggregation over CXL suggests a multi-year payback, forcing operators to stagger upgrades
Other drivers and restraints analyzed in the detailed report include:
- High Server Consolidation Ratios Lower OPEX and Real-Estate Cost
- Liquid-Cooling Ready Chassis Gaining Regulatory Incentives
- Supplier Concentration in Proprietary Chassis Ecosystems
For complete list of drivers and restraints, kindly check the Table Of Contents.
Segment Analysis
Tier 3 facilities owned 42.05% of the Data Center Blade Server market in 2025, as their N+1 redundancy profile aligns with mainstream enterprise SLAs. Tier 4 sites, though smaller in count, are forecast to grow at 11.63% CAGR thanks to fault-tolerance demands from AI training clusters. This momentum positions Tier 4 as the proving ground for 100% liquid-cooled chassis and silicon-photonics interconnects.
Operators of Tier 1 and Tier 2 facilities, typically serving edge aggregation or branch workloads, adopt standardized blades to maintain cost discipline while gaining better automation. The Infrastructure Masons report links 90% of current power growth to AI model training, a load now propagating into even modest sites that must accommodate higher power draw and rack density. As a result, vendors are packaging kits that retrofit lower-tier rooms with containment aisles and rear-door heat exchangers, preserving momentum for the wider Data Center Blade Server market.
Half-height blades delivered 48.02% revenue in 2025, supporting dual-socket CPUs, ample DIMM slots and PCIe expansion for most virtualization and database tasks. They remain the workhorse of enterprise colocation racks. Full-height models continue to serve quad-socket, memory-bound workloads such as in-memory analytics.
Quarter-height and micro-blade nodes are the fastest-growing slice at 13.39% CAGR because they fit 16-32 compute sleds per 10U shelf, ideal for limited edge footprints. Vendors now integrate GPU accelerators into these compact sleds, enabling real-time inference at cell-tower sites. Compatibility with Open Rack v3 specifications allows mixed deployment inside the same cabinet, sustaining the Data Center Blade Server market's edge expansion narrative.
Complete Report Scope:
- By Data-Center Tier
- Tier 1 and 2
- Tier 3
- Tier 4
- By Form Factor
- Half-height Blades
- Full-height Blades
- Quarter-height / Micro-blades
- By Application / Workload
- Virtualisation and Private Cloud
- High-Performance Computing (HPC)
- Artificial Intelligence/Machine Learning and Data Analytics
- Storage-centric
- Edge / IoT Gateways
- By Data Center Type
- Hyperscalers/Cloud Service Provider
- Colocation Facilities
- Enterprise and Edge
- By End-use Industry
- BFSI
- IT and Telecom / CSPs
- Healthcare and Life-Sciences
- Manufacturing and Industry 4.0
- Energy and Utilities
- Government and Defence
- By Geography
- North America
- United States
- Canada
- Mexico
- Europe
- United Kingdom
- Germany
- France
- Italy
- Spain
- Rest of Europe
- Asia-Pacific
- China
- Japan
- India
- Singapore
- Australia
- Malaysia
- Rest of Asia-Pacific
- South America
- Brazil
- Chile
- Argentina
- Rest of South America
- Middle East
- United Arab Emirate
- Saudi Arabia
- Turkey
- Rest of Middle East
- Africa
- South Africa
- Nigeria
- Rest of Africa
- North America
Geography Analysis
North America controlled 41.88% of the Data Center Blade Server market in 2025, fueled by hyperscale campuses in Northern Virginia, Texas and Silicon Valley. The Lawrence Berkeley National Laboratory calculated 176 TWh of US data-center electricity use in 2023, raising urgency for liquid-cooled blades that cut facility PUEs. Canada and Mexico add incremental demand through regional sovereign-cloud and disaster-recovery zones.
Asia-Pacific is the fastest-growing theater at 11.92% CAGR from 2026-2031. China deploys massive AI cloud clusters, while India needs to expand installed capacity from 1.35 GW to 5 GW by 2030 to keep pace with digital-economy targets. Policy frameworks in Singapore award capacity licenses preferentially to designs that include high-density blades and heat-recovery chillers. Japan and Australia extend the edge footprint along subsea cable landing stations, embedding quarter-height blades for content caching. Europe shows steady expansion under strict efficiency and data-sovereignty rules. Ecodesign 2019/424 revisions encourage blade chassis that support warm-water cooling above 35 °C, easing integration with district-heat loops. The Middle East and Africa attract investment for cloud on-ramps serving fintech and gaming customers. South America's installations cluster around Brazil's internet exchange hubs, where operators deploy composable blades to meet seasonal traffic peaks. These regional dynamics reinforce the global relevance of the Data Center Blade Server market.
- Cisco Systems Inc.
- Dell Technologies
- Hewlett Packard Enterprise
- Huawei Technologies Co. Ltd.
- IBM Corporation
- Fujitsu Ltd.
- Lenovo Group Ltd.
- NEC Corporation
- Oracle Corporation
- Super Micro Computer Inc.
- Inspur Group
- Quanta Cloud Technology
- Gigabyte Technology
- Hitachi Ltd.
- AMD (Pensando)
- Nvidia Corp. (Grace Superchip platforms)
- Marvell Technology (DPU-centric blades)
- Broadcom Inc. (Switch-on-Blade)
- Advantech Co. Ltd.
- Silicom Ltd.
- ZTE Corporation
Additional Benefits:
- The market estimate (ME) sheet in Excel format
- 3 months of analyst support
TABLE OF CONTENTS
1 INTRODUCTION
- 1.1 Study Assumptions and Market Definition
- 1.2 Scope of the Study
2 RESEARCH METHODOLOGY
3 EXECUTIVE SUMMARY
4 MARKET LANDSCAPE
- 4.1 Market Overview
- 4.2 Market Drivers
- 4.2.1 Surging rack-level power density accommodates AI/ML workloads
- 4.2.2 Edge-cloud convergence accelerating deployment in micro-modular DCs
- 4.2.3 High server consolidation ratios lower OPEX and real-estate cost
- 4.2.4 Liquid-cooling ready chassis gaining regulatory incentives (EU, Singapore)
- 4.2.5 Growing hyperscaler preference for composable disaggregated blades
- 4.3 Market Restraints
- 4.3.1 CapEx spike from silicon photonics and 800 Gb E backplane migration
- 4.3.2 Supplier concentration in proprietary chassis ecosystems
- 4.3.3 Skill-gap in managing multi-fabric, disaggregated architectures
- 4.3.4 Delayed ORAN/5G monetisation lengthening ROI for telco DCs
- 4.4 Supply-Chain Analysis
- 4.5 Regulatory and Sustainability Landscape
- 4.6 Technological Outlook (PCIe 6.0, CXL 3.0, silicon photonics)
- 4.7 Porter's Five Forces
- 4.7.1 Threat of New Entrants
- 4.7.2 Bargaining Power of Buyers
- 4.7.3 Bargaining Power of Suppliers
- 4.7.4 Threat of Substitutes
- 4.7.5 Intensity of Rivalry
- 4.8 Assessment of the Impact on Macro Economic Trends on the Market
5 MARKET SIZE AND GROWTH FORECASTS (VALUES)
- 5.1 By Data-Center Tier
- 5.1.1 Tier 1 and 2
- 5.1.2 Tier 3
- 5.1.3 Tier 4
- 5.2 By Form Factor
- 5.2.1 Half-height Blades
- 5.2.2 Full-height Blades
- 5.2.3 Quarter-height / Micro-blades
- 5.3 By Application / Workload
- 5.3.1 Virtualisation and Private Cloud
- 5.3.2 High-Performance Computing (HPC)
- 5.3.3 Artificial Intelligence/Machine Learning and Data Analytics
- 5.3.4 Storage-centric
- 5.3.5 Edge / IoT Gateways
- 5.4 By Data Center Type
- 5.4.1 Hyperscalers/Cloud Service Provider
- 5.4.2 Colocation Facilities
- 5.4.3 Enterprise and Edge
- 5.5 By End-use Industry
- 5.5.1 BFSI
- 5.5.2 IT and Telecom / CSPs
- 5.5.3 Healthcare and Life-Sciences
- 5.5.4 Manufacturing and Industry 4.0
- 5.5.5 Energy and Utilities
- 5.5.6 Government and Defence
- 5.6 By Geography
- 5.6.1 North America
- 5.6.1.1 United States
- 5.6.1.2 Canada
- 5.6.1.3 Mexico
- 5.6.2 Europe
- 5.6.2.1 United Kingdom
- 5.6.2.2 Germany
- 5.6.2.3 France
- 5.6.2.4 Italy
- 5.6.2.5 Spain
- 5.6.2.6 Rest of Europe
- 5.6.3 Asia-Pacific
- 5.6.3.1 China
- 5.6.3.2 Japan
- 5.6.3.3 India
- 5.6.3.4 Singapore
- 5.6.3.5 Australia
- 5.6.3.6 Malaysia
- 5.6.3.7 Rest of Asia-Pacific
- 5.6.4 South America
- 5.6.4.1 Brazil
- 5.6.4.2 Chile
- 5.6.4.3 Argentina
- 5.6.4.4 Rest of South America
- 5.6.5 Middle East
- 5.6.5.1 United Arab Emirate
- 5.6.5.2 Saudi Arabia
- 5.6.5.3 Turkey
- 5.6.5.4 Rest of Middle East
- 5.6.6 Africa
- 5.6.6.1 South Africa
- 5.6.6.2 Nigeria
- 5.6.6.3 Rest of Africa
- 5.6.1 North America
6 COMPETITIVE LANDSCAPE
- 6.1 Market Concentration
- 6.2 Strategic Initiatives
- 6.3 Market Share Analysis
- 6.4 Company Profiles (includes Global level Overview, Market level overview, Core Segments, Financials as available, Strategic Information, Market Rank/Share, Products and Services, Recent Developments)
- 6.4.1 Cisco Systems Inc.
- 6.4.2 Dell Technologies
- 6.4.3 Hewlett Packard Enterprise
- 6.4.4 Huawei Technologies Co. Ltd.
- 6.4.5 IBM Corporation
- 6.4.6 Fujitsu Ltd.
- 6.4.7 Lenovo Group Ltd.
- 6.4.8 NEC Corporation
- 6.4.9 Oracle Corporation
- 6.4.10 Super Micro Computer Inc.
- 6.4.11 Inspur Group
- 6.4.12 Quanta Cloud Technology
- 6.4.13 Gigabyte Technology
- 6.4.14 Hitachi Ltd.
- 6.4.15 AMD (Pensando)
- 6.4.16 Nvidia Corp. (Grace Superchip platforms)
- 6.4.17 Marvell Technology (DPU-centric blades)
- 6.4.18 Broadcom Inc. (Switch-on-Blade)
- 6.4.19 Advantech Co. Ltd.
- 6.4.20 Silicom Ltd.
- 6.4.21 ZTE Corporation
7 MARKET OPPORTUNITIES AND FUTURE OUTLOOK
- 7.1 White-space and Unmet-Need Assessment


