
|
시장보고서
상품코드
2073487
생명과학 분석 : 시장 점유율 분석, 업계 동향 및 통계, 성장 예측(2026-2031년)Life Sciences Analytics - Market Share Analysis, Industry Trends & Statistics, Growth Forecasts (2026 - 2031) |
||||||
 Mordor Intelligence
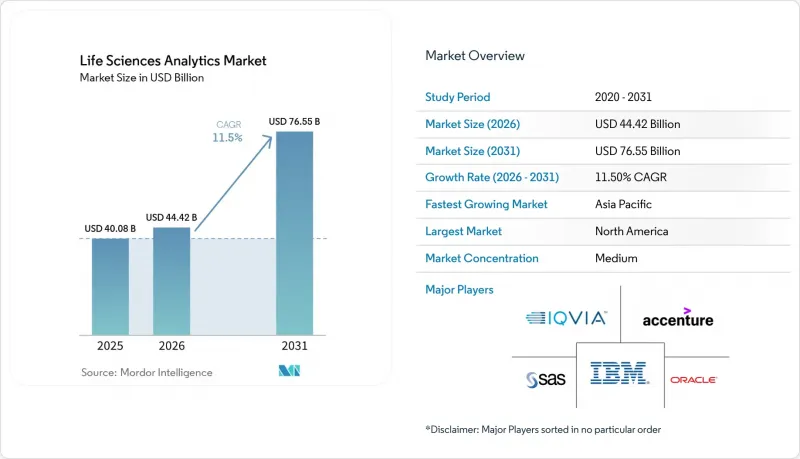
Mordor Intelligence에 의하면, 생명과학 분석 시장 규모는 2025년 400억 8,000만 달러로 평가되었습니다. 2026년에는 444억 2,000만 달러로 확대되어 2026년부터 2031년에 걸쳐 CAGR 11.5%로 성장을 지속하여, 2031년에는 765억 5,000만 달러에 이를 것으로 예측됩니다.
본 보고서는 제품 유형(기술적, 예측적, 처방적 분석), 구성 요소(소프트웨어 플랫폼 및 서비스), 도입 형태(On-Premise 및 클라우드 기반), 용도(연구 개발, 의약품 안전성 모니터링 등), 최종 사용자(제약·바이오기술 기업 등), 지역(북미, 유럽 등)별로 분류되어 있습니다. 시장 전망은 금액(달러) 기준으로 제시되어 있습니다.
세계의 생명과학 분석 시장 동향 및 인사이트
다중 모달 생명과학 데이터 세트의 급격한 증가
시퀀싱, 이미징 및 웨어러블 센서에서 발생하는 데이터 스트림은 현재 18개월마다 두 배로 증가하고 있으며, 이는 On-Premise 처리 능력을 초과하고 있어, 각 후원사는 오믹스 데이터와 전자건강기록(EHR) 피드를 통합하는 클라우드 네이티브 분석 기술을 도입해야 하는 상황에 직면해 있습니다. 미국 국립보건원(NIH)은 그 "All of Us"이 프로그램을 통해 2025년 중반까지 10페타바이트 규모의 참가자 데이터를 축적한 것을 확인했습니다. 건당 1테라바이트의 데이터를 생성하는 단일 세포 RNA 분석은 종양학 분야에서 일상적으로 수행되고 있지만, 이러한 파일을 이미지 아카이브와 연동하는 파이프라인을 유지하고 있는 기업은 극히 일부에 불과합니다. 지속적 혈당 모니터나 이식형 기기가 수 분 이내에 반응하는 적응형 투여 알고리즘을 작동시키기 위해서는 데이터 처리 속도와 관련된 문제도 마찬가지로 심각합니다. 다중 모드 융합 기술을 습득한 기업은 바이오마커 발견까지 걸리는 기간을 수년에서 수 분기 수준으로 단축할 수 있지만, 이에 대응이 늦은 기업은 증거의 다양성이 부족하다는 이유로 규제 당국으로부터 질의를 받게 될 것입니다.
증거에 기반한 의약품 수명주기 관리를 위한 규제 당국의 엄격한 추진
FDA는 단편적인 안전성 검토 대신 지속적인 유익성-위험성 분석을 요구하고 있으며, 이에 따라 청구 데이터, 전자건강기록(EHR) 및 환자 보고 결과(PRO)를 지속적으로 수집해야 합니다. EMA의 조건부 승인 절차에 관한 지침 역시 분기별 유효성 보고를 의무화하고 있습니다(2). 대형 스폰서들은 사내 관찰 연구 거점을 구축하는 한편, 중견 기업들은 센티넬 방식의 감시 기간을 수개월에서 수일로 단축해 주는 업체에 의존하고 있습니다. ICH E9(R1)의 추정량에 관한 규정 역시 통계 담당자에게 분석 시나리오의 사전 정의를 요구하고 있어, 이에 따라 민감도 분석을 자동화하는 처방형 플랫폼에 대한 수요가 증가하고 있습니다.
뿌리 깊은 데이터 사일로화와 상호운용성 기준의 부재
메디케어·메디케이드 서비스 센터(CMS)의 의무화 조치에도 불구하고, 2024년 말 기준으로 HL7 FHIR의 완전한 상호운용성을 실현한 미국 내 병원은 25% 미만에 그치고 있습니다. 분산된 테스트 코드와 맞춤형 커넥터로 인해 프로젝트 기간이 4배로 늘어났고, 총 소유 비용이 증가하고 있습니다. 방대한 종단 데이터를 보유한 학술 기관은 경쟁상의 우려로 인해 데이터 공유에 소극적인 경우가 많으며, 이로 인해 기존 제휴 관계를 맺고 있는 기업의 우위가 더욱 공고해지고 있습니다.
부문별 분석
2025년, 생명과학 분석 시장에서 기술적 분석이 45.23%의 점유율을 차지했습니다. FDA의 모델 기반 개발 권고에 힘입은 처방 분석 시장은 연평균 성장률(CAGR) 13.56%로 성장하고 있으며, 임상시험 설계 과정을 혁신할 준비가 되어 있습니다. 예측 분석은 피험자 등록 및 투여량 결정의 지침이 되는 위험 점수를 제공함으로써, 이 두 가지 분석 기법을 연결합니다. 각 벤더사는 이에 대응하여 이 세 가지 기능을 통합한 제품군을 제공함으로써, 통계 담당자의 업무 흐름의 연속성을 높이고 있습니다.
처방 분석(Prescriptive Analytics) 도입에는 여전히 임상 데이터 사이언스자 부족이라는 과제가 남아 있으며, 이에 대응하여 각 벤더사는 로우코드 인터페이스를 출시하고 있습니다. 예측 분석의 성장은 실제 데이터의 확대에 의존하고 있는 반면, 기술적 분석 도구는 대시보드 인프라의 성숙에 따라 성장이 정체되고 있습니다. IQVIA의 "2024 Orchestrated Analytics" 이는 플랫폼의 융합을 의미하며, 사용자는 단일 세션 내에서 요약형 시각화에서 인실리코를 통한 투여량 최적화로 전환할 수 있게 됩니다.
소프트웨어 플랫폼은 연평균 성장률(CAGR) 13.87%로 성장하고 있으며, 공급업체가 알고리즘을 사전 학습시키고 업계별 맞춤형 템플릿을 통합함으로써 도입 기간을 반년에서 6주로 단축하고 있습니다. 대기업은 유연성을 중시하여 플랫폼을 선택하는 반면, 중견 후원 기업들은 프로토콜 설계나 규제 해석에 있어 외부 전문 지식을 활용하기 위해 계속해서 해당 서비스를 이용하고 있습니다.
세계의 컨설팅 기업들은 전략 수립부터 운영에 이르기까지 종합적인 서비스를 제공하기 위해 전문성이 뛰어난 부티크 기업들을 인수하고 있습니다. 한편, 클라우드 제공업체들은 자연어 인터페이스를 도입하여 통계학자 이외의 사용자층으로 그 범위를 넓히고 있습니다. ISO 13485 품질 규격에 따라 플랫폼 공급업체들은 변경 관리의 엄격화를 위해 투자하도록 권장받고 있으며, 그 결과 소규모 코드 개발 회사 시장 진입 장벽이 높아지고 있습니다.
지역별 분석
2025년, 북미는 생명과학 분석 시장의 41.36%를 차지했습니다. 이는 FDA의 선진적인 임상시험 설계 지침과, 알고리즘 학습을 촉진하는 NIH의 10페타바이트 규모의 ‘"All of Us"데이터셋에 기반을 둔 것입니다. 해당 지역에서는 전자건강기록(EHR)의 보급이 확대되고 있으며, 고성능 컴퓨팅 자원도 풍부하기 때문에 국내 후원 기업들은 멀티모달 분석 도입에 있어 선도적인 위치를 차지하고 있습니다. 또한, 연방 정부의 클라우드 보안 인증도 규제 대상 워크로드의 이전을 가속화하고 있습니다.
아시아태평양은 규제 측면에서의 움직임이 일치하고 있음을 반영하여 12.64%라는 가장 높은 연평균 성장률(CAGR)을 기록하고 있습니다. 중국 국가의약품감독관리국은 2024년, 실세계 증거에 관한 규정을 ICH E9(R1)에 부합하도록 개정하여, 연구 후원사가 아시아의 코호트 데이터를 유럽 및 미국의 연구 데이터와 통합할 수 있도록 했습니다. 인도의 '디지털 헬스 미션'는 2027년까지 EHR의 전국적인 보급을 목표로 하고 있는 반면, 일본의 PMDA는 시판 후 데이터에 관한 제출 양식을 도입하고, 종양학, 대사 질환, 희귀질환 각 프로그램에서 분석 기술의 도입을 촉진하고 있습니다.
유럽에서는 데이터 전송 규제가 강화됨에 따라, 성장세가 완만하기는 하지만 성장 속도는 둔화되고 있습니다. 2024년에 도입된 ‘EU 헬스 데이터 스페이스’는 GDPR(EU 개인정보보호규정)에 더해 추가적인 승인 절차를 도입함에 따라, 클라우드 기반 분석 분야에서 규정 준수 대응에 따른 부담이 커지고 있습니다. 그럼에도 불구하고, 강력한 학술 연구 네트워크, 풍부한 AI 인재, 그리고 '호라이즌·유럽' 해당 자금에 대한 접근을 통해, 해당 플랫폼에 대한 지속적인 투자가 뒷받침되고 있습니다. 중동 및 아프리카는 여전히 발전 단계에 있습니다. 남아프리카공화국의 2024년 국가 리포지토리는 초기 성장세를 보이고 있지만, 고성능 컴퓨팅 인프라의 부족으로 인해 오믹스 관련 워크로드가 제한되고 있습니다.
기타 혜택 :
- 엑셀 형식 시장 예측(ME) 시트
- 3개월간의 애널리스트 지원
자주 묻는 질문
목차
제1장 서론
제2장 조사 방법
제3장 주요 요약
제4장 시장 구도
제5장 시장 규모 및 성장 예측
제6장 경쟁 구도
제7장 시장 기회 및 향후 전망
KTH 26.07.07According to Mordor Intelligence, the life sciences analytics market size is expected to grow from USD 40.08 billion in 2025 to USD 44.42 billion in 2026 and is forecast to reach USD 76.55 billion by 2031 at 11.5% CAGR over 2026-2031.
This report is Segmented by Product Type (Descriptive, Predictive, and Prescriptive Analytics), Component (Software Platforms and Services), Deployment Mode (On-Premise and Cloud-Based), Application (R&D, Pharmacovigilance, and More), End User (Pharma & Biotech, and More), and Geography (North America, Europe, and More). Market Forecasts are Provided in Terms of Value (USD).
Global Life Sciences Analytics Market Trends and Insights
Exponential Growth of Multimodal Life-Science Data Sets
Sequencing, imaging, and wearable-sensor streams now double every 18 months, outpacing on-premise capacity and prompting sponsors to adopt cloud-native analytics that integrate omics and electronic health record feeds. The National Institutes of Health confirmed its All of Us program amassed 10 petabytes of participant data by mid-2025[1]. Single-cell RNA studies, each producing 1 terabyte, are routine in oncology, yet only a minority of firms maintain pipelines to align these files with imaging archives. The velocity challenge is equally daunting because continuous glucose monitors and implantable devices trigger adaptive-dose algorithms that react within minutes. Companies that master multimodal fusion reduce biomarker discovery timelines from years to quarters, whereas laggards face regulatory queries for missing evidence diversity.
Strict Regulatory Push for Evidence-Based Drug Lifecycle Management
The FDA requires ongoing benefit-risk analytics instead of sporadic safety reviews, compelling perpetual ingestion of claims data, EHRs, and patient-reported outcomes. EMA's adaptive-pathways guidance similarly mandates quarterly effectiveness reports[2]. Large sponsors build in-house observatories, while mid-size firms lean on vendors that compress Sentinel-style surveillance from months to days. Estimand rules in ICH E9(R1) also require statisticians to pre-define analytic scenarios, thereby heightening the demand for prescriptive platforms that automate sensitivity analyses.
Persistent Data Silos and Lack of Interoperability Standards
Fewer than 25% of U.S. hospitals achieved full HL7 FHIR interoperability by the end of 2024 despite the Centers for Medicare & Medicaid Services mandates. Fragmented lab codes and custom connectors stretch project timelines fourfold and inflate the total cost of ownership. Academic centers holding rich longitudinal data often resist sharing due to competitive concerns, reinforcing the advantage for firms with existing collaborations.
Other drivers and restraints analyzed in the detailed report include:
- Escalating R&D Cost Pressures Encouraging Analytics-Led Efficiency
- Shift Toward Precision Medicine and Biomarker-Driven Trials
- Heightened Global Data Privacy Regulations Inflating Compliance Burden
For complete list of drivers and restraints, kindly check the Table Of Contents.
Segment Analysis
Descriptive analytics held 45.23% of the Life science analytics market in 2025. Prescriptive Analytics, supported by the FDA's endorsement of model-informed development, is growing at a 13.56% CAGR and is poised to transform trial-design processes. Predictive Analytics bridges the two by delivering risk scores that inform enrollment and dosing. Vendors respond by integrating all three capabilities in unified suites, easing workflow continuity for statisticians.
Prescriptive adoption still faces a scarcity of clinical data scientists, prompting vendors to release low-code interfaces. Predictive growth relies on expanding real-world data, while Descriptive tools plateau as dashboard infrastructure matures. IQVIA's 2024 Orchestrated Analytics illustrates platform convergence, enabling users to transition from summary visualizations to in-silico dose optimization within a single session.
Services controlled 55.32% of spending in 2025 due to the complexity of legacy integration. Software Platforms are advancing at a 13.87% CAGR as vendors pre-train algorithms and embed industry-specific templates, reducing deployment time from half a year to six weeks. Large firms select platforms for flexibility, whereas mid-size sponsors keep services for outsourced expertise in protocol design and regulatory interpretation.
Global consultancies acquire specialist boutiques to deliver strategy-through-operations offerings. Meanwhile, cloud providers roll out natural-language interfaces, broadening user access beyond statisticians. ISO 13485 quality standards prompt platform vendors to invest in change-control rigor, thereby raising barriers to entry for smaller code shops.
Complete Report Scope:
- By Product Type
- Descriptive Analytics
- Predictive Analytics
- Prescriptive Analytics
- By Component
- Software Platforms
- Services
- By Deployment Mode
- On-Premise
- Cloud-Based
- By Application
- Research & Development
- Pharmacovigilance & Safety
- Supply-Chain & Manufacturing QA/QC
- Sales, Marketing & Market Access
- Commercial Real-World Evidence / HEOR
- By End User
- Pharmaceutical & Biotechnology Companies
- Medical Device Companies
- Other End Users
- Geography
- North America
- United States
- Canada
- Mexico
- Europe
- Germany
- United Kingdom
- France
- Italy
- Spain
- Rest of Europe
- Asia-Pacific
- China
- Japan
- India
- South Korea
- Australia
- Rest of Asia-Pacific
- Middle-East and Africa
- GCC
- South Africa
- Rest of Middle East and Africa
- South America
- Brazil
- Argentina
- Rest of South America
- North America
Geography Analysis
North America commanded 41.36% of the Life science analytics market in 2025, powered by the FDA's progressive trial-design guidance and NIH's 10-petabyte All of Us dataset that fuels algorithm training. The region offers mature EHR penetration and abundant high-performance computing, giving domestic sponsors a head start in deploying multimodal analytics. Federal cloud-security authorizations also accelerate the migration of regulated workloads.
Asia-Pacific records the fastest 12.64% CAGR, reflecting synchronized regulatory moves. China's National Medical Products Administration aligned its real-world evidence rules with ICH E9(R1) in 2024, allowing sponsors to pool Asian cohorts with Western studies. India's Digital Health Mission aims for universal EHR coverage by 2027, while Japan's PMDA introduced submission templates for post-market data, spurring analytics adoption across oncology, metabolic, and rare-disease programs.
Europe posts steady but slower growth due to stricter data-transfer rules. The 2024 EU Health Data Space introduces additional approval steps on top of GDPR, increasing compliance efforts for cloud-based analytics. Nevertheless, strong academic research networks, deep AI talent pools, and access to Horizon Europe funding sustain ongoing investments in the platform. The Middle East and Africa remain nascent; South Africa's 2024 national repository signals early momentum, but high-performance computing deficits limit omics workloads.
- Accenture
- Clarivate
- Cognizant
- Dassault Systemes
- Exl Service
- IBM
- IQVIA
- MaxisIT
- Microsoft
- Optum Life Sciences
- Oracle
- SAP
- SAS Institute
- TAKE Solutions Ltd.
- Veeva Systems
- Wipro
Additional Benefits:
- The market estimate (ME) sheet in Excel format
- 3 months of analyst support
TABLE OF CONTENTS
1 Introduction
- 1.1 Study Assumptions & Market Definition
- 1.2 Scope of the Study
2 Research Methodology
3 Executive Summary
4 Market Landscape
- 4.1 Market Overview
- 4.2 Market Drivers
- 4.2.1 Exponential Growth of Multimodal Life-Science Data Sets
- 4.2.2 Strict Regulatory Push for Evidence-Based Drug Lifecycle Management
- 4.2.3 Escalating R&D Cost Pressures Encouraging Analytics-Led Efficiency
- 4.2.4 Shift Toward Precision Medicine and Biomarker-Driven Trials
- 4.2.5 Rapid Adoption of Federated Learning to Enable Cross-Border Data Collaboration
- 4.2.6 Emergence of Real-Time Digital Twins for Adaptive Clinical Operations
- 4.3 Market Restraints
- 4.3.1 Persistent Data Silos and Lack of Interoperability Standards
- 4.3.2 Heightened Global Data Privacy Regulations Inflating Compliance Burden
- 4.3.3 Limited Validation Frameworks for AI Models In Regulated Environments
- 4.3.4 Rising Cloud-Compute Costs Hindering Large-Scale Omics Analytics
- 4.4 Regulatory Outlook
- 4.5 Porter's Five Forces Analysis
- 4.5.1 Threat of New Entrants
- 4.5.2 Bargaining Power of Buyers
- 4.5.3 Bargaining Power of Suppliers
- 4.5.4 Threat of Substitutes
- 4.5.5 Intensity of Competitive Rivalry
5 Market Size & Growth Forecasts (Value, USD)
- 5.1 By Product Type
- 5.1.1 Descriptive Analytics
- 5.1.2 Predictive Analytics
- 5.1.3 Prescriptive Analytics
- 5.2 By Component
- 5.2.1 Software Platforms
- 5.2.2 Services
- 5.3 By Deployment Mode
- 5.3.1 On-Premise
- 5.3.2 Cloud-Based
- 5.4 By Application
- 5.4.1 Research & Development
- 5.4.2 Pharmacovigilance & Safety
- 5.4.3 Supply-Chain & Manufacturing QA/QC
- 5.4.4 Sales, Marketing & Market Access
- 5.4.5 Commercial Real-World Evidence / HEOR
- 5.5 By End User
- 5.5.1 Pharmaceutical & Biotechnology Companies
- 5.5.2 Medical Device Companies
- 5.5.3 Other End Users
- 5.6 Geography
- 5.6.1 North America
- 5.6.1.1 United States
- 5.6.1.2 Canada
- 5.6.1.3 Mexico
- 5.6.2 Europe
- 5.6.2.1 Germany
- 5.6.2.2 United Kingdom
- 5.6.2.3 France
- 5.6.2.4 Italy
- 5.6.2.5 Spain
- 5.6.2.6 Rest of Europe
- 5.6.3 Asia-Pacific
- 5.6.3.1 China
- 5.6.3.2 Japan
- 5.6.3.3 India
- 5.6.3.4 South Korea
- 5.6.3.5 Australia
- 5.6.3.6 Rest of Asia-Pacific
- 5.6.4 Middle-East and Africa
- 5.6.4.1 GCC
- 5.6.4.2 South Africa
- 5.6.4.3 Rest of Middle East and Africa
- 5.6.5 South America
- 5.6.5.1 Brazil
- 5.6.5.2 Argentina
- 5.6.5.3 Rest of South America
- 5.6.1 North America
6 Competitive Landscape
- 6.1 Market Concentration
- 6.2 Market Share Analysis
- 6.3 Company Profiles (Includes Global Level Overview, Market Level Overview, Core Segments, Financials As Available, Strategic Information, Market Rank/Share, Products & Services, Recent Developments)
- 6.3.1 Accenture PLC
- 6.3.2 Clarivate
- 6.3.3 Cognizant Technology Solutions
- 6.3.4 Dassault Systmes
- 6.3.5 ExlService Holdings, Inc.
- 6.3.6 IBM Corporation
- 6.3.7 IQVIA
- 6.3.8 MaxisIT Inc.
- 6.3.9 Microsoft Corporation
- 6.3.10 Optum Life Sciences
- 6.3.11 Oracle Corporation
- 6.3.12 SAP SE
- 6.3.13 SAS Institute Inc.
- 6.3.14 TAKE Solutions Ltd.
- 6.3.15 Veeva Systems Inc.
- 6.3.16 Wipro Limited
7 Market Opportunities & Future Outlook
- 7.1 White-Space & Unmet-Need Assessment