|
시장보고서
상품코드
2073519
스마트폰 : 시장 점유율 분석, 업계 동향 및 통계, 성장 예측(2026-2031년)Smartphones - Market Share Analysis, Industry Trends & Statistics, Growth Forecasts (2026 - 2031) |
||||||
 Mordor Intelligence
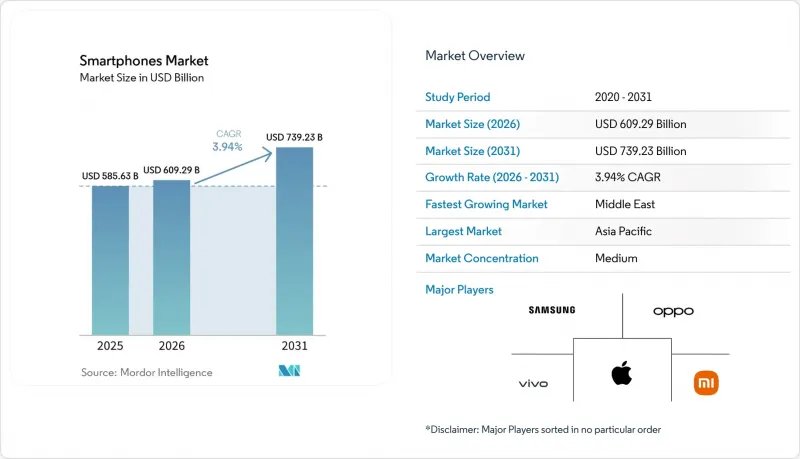
Mordor Intelligence에 의하면, 스마트폰 시장 규모는 2025년 5,856억 3,000만 달러로 평가되었습니다. 2026년에는 6,092억 9,000만 달러로 확대되어 2026년부터 2031년에 걸쳐 CAGR 3.94%로 성장을 지속하여, 2031년에는 7,392억 3,000만 달러에 이를 것으로 예측됩니다.
본 보고서는 운영 체제(Android, iOS 등), 가격대(엔트리 레벨, 미드레인지 등), 기술(5G, 4G/LTE 등), 폼 팩터(바형, 폴더블/플립형 등), 판매 채널(통신사 직영점, 브랜드 직영점 등), 최종 사용자(일반 소비자/개인 등), 지역별로 분류되어 있습니다. 시장 전망은 금액(달러) 및 수량(대) 단위로 제시되어 있습니다.
세계의 스마트폰 시장 동향 및 인사이트
AI를 활용한 업그레이드 주기 가속화가 기기 교체를 촉진
현재 초당 40조 회 이상의 연산 처리가 가능한 단말기 탑재형 생성형 AI는 플래그십 모델 출시의 핵심 기능으로 자리 잡고 있습니다. 애플의 A18 Pro와 퀄컴의 스냅드래곤 8 엘리트는 클라우드 지연 없이 실시간 번역, 이미지 합성, 개인 비서 기능을 구현하는 뉴럴 엔진을 탑재하고 있습니다. 북미와 유럽에서는 이 기능 덕분에 스마트폰 시장의 교체 주기가 단축되었습니다. 2025년 조사 대상 사용자의 38%가 AI를 기기 교체 시 주요 요인으로 꼽았습니다. 프리미엄층 구매자들은 회의 내용에 대한 실시간 요약이나 기기 내 사진 편집 등 일상에서 직접 체감할 수 있는 구체적인 이점을 인식하고 있으며, 이것이 플래그십 모델에 고가를 지불하려는 의지를 뒷받침하고 있습니다. 중국의 각 공급업체들도 신속하게 대응하고 있습니다. MediaTek의 Dimensity 9400은 멀티모달 어시스턴트의 전력 효율을 30% 향상시켰으며, AI를 크로스 플랫폼의 표준 기능으로 채택했습니다. 각 칩 제조업체들이 스마트폰의 열 설계에 최적화되고, 파라미터 수가 점점 더 늘어나는 모델을 추구하는 가운데, 이러한 기술 경쟁은 2029년까지 이어질 전망입니다.
금융, 트레이드인, 장기 소프트웨어 지원이 뒷받침하는 프리미엄화
무이자 할부 계획과 적극적인 트레이드인 혜택 덕분에, 소비자들의 관심은 초기 비용에서 월별 지불 부담 경감으로 옮겨가고 있습니다. 미국의 통신사들은 현재 할부 기간을 36개월로 연장하여, 실질적으로 1,200달러짜리 플래그십 모델을월33달러씩 납부하는 방식으로 제공합니다. 한편, 애플은 2024년에 1,200만 건 이상의 중고 기기 임베디드을 처리했으며, 이를 통해 정가에서 최대 500달러까지 할인을 제공했습니다. Samsung Electronics와 구글이 제공하는 7년간의 업데이트 보증은 총 소유 비용을 더욱 낮춰주며, 프리미엄 모델이 일반적인 모델 변경 주기를 훨씬 넘어가더라도 보안과 최신 기능을 유지할 수 있다는 점을 구매자들에게 안심시켜 주고 있습니다. 이러한 요인들이 복합적으로 작용하여, 거시경제가 침체기에 있더라도 스마트폰 시장의 프리미엄 모델에 대한 수요는 견조하게 유지되고 있으며, 더 높은 평균 판매 가격(ASP) 대역으로의 수익 유입이 촉진되고 있습니다. 신흥 시장에서도 현지 은행과 핀테크 기업들이 할부 결제를 기반으로 한 단말기 대출을 시작하면서, 비슷한 추세가 나타나기 시작하고 있습니다.
메모리 공급 부족이 부품 원가를 끌어올리고 있습니다.
2024년 하반기, 웨이퍼 생산 능력이 고대역폭 서버용 모듈로 전환됨에 따라 DRAM 현물 가격이 약 20% 상승했습니다. Samsung Electronics와 SK하이닉스가 자동차 및 데이터센터 고객을 우선시한 탓에 모바일용 LPDDR 공급 부족이 발생했고, 이에 따라 보급형 안드로이드 제조업체들은 메모리 사양을 축소할 수밖에 없게 되었습니다. 가격에 민감한 시장에서는 10달러의 가격 인상이 구매자들을 4GB 모델이나 피처폰으로 몰아넣어, 판매량 전망치를 하향 조정할 수밖에 없는 상황이 되었습니다. 부품 가격의 급등은 이미 아슬아슬한 수준인 매출 총이익률을 더욱 압박하고 있어, 일부 2선 브랜드들은 신제품 출시를 연기하거나 부속품 수를 줄이는 상황에 내몰리고 있습니다. 새로운 팹이 본격적으로 가동되는 2026년 중반까지는 상황의 개선이 기대되지 않으며, 스마트폰 시장 전체의 저가형 제품 평균 판매 가격(ASP)에 대한 압박은 지속될 것이며, 디지털 격차가 더욱 확대될 가능성이 있습니다.
부문별 분석
2025년, 안드로이드는 스마트폰 시장 점유율 69.21%를 유지했으나, 하모니OS와 카이OS는 연평균 5.29%의 성장률을 기록하며 시장의 분열이 서서히 진행되고 있음을 시사하고 있습니다. 화웨이는 2024년에 7,000만 대 이상의 HarmonyOS 탑재 스마트폰을 출하하며, 구글 서비스에 의존하지 않는 중국 중심의 생태계를 강화했습니다. 초저가 단말기에 탑재된 KaiOS는 누적 활성화 대수가 1억 5,000만 대를 돌파하며, 인터넷을 처음 사용하는 사용자에게 앱 기반의 경험을 제공합니다. 대체 플랫폼인 스마트폰 시장 규모는 현재로서는 여전히 작지만, 그 성장세는 특정 틈새 시장에서 안드로이드의 압도적인 입지에 도전하고 있습니다. EU의 '디지털 시장법' 인도 등의 상호운용성 관련 제안 등, 규제 동향은 제3자 앱 스토어 및 크로스 플랫폼 메시징을 의무화함으로써 경쟁의 공정성을 확보하고 있습니다. 규제 준수 비용이 증가하는 가운데, iOS와 Android 모두 데이터 주권과 뛰어난 저사양 성능을 약속하는 지역 한정 플랫폼이나 특정 용도 전용 플랫폼에 시장 점유율을 서서히 내주게 될 가능성이 있습니다.
한편, 애플의 iOS는 가격 결정력을 강화하고 있습니다. 2024 회계연도의 아이폰 매출액은 2,000억 달러에 달했는데, 이는 초프리미엄층을 지탱하는 ‘"Pro" 모델이 주도한 것입니다. 애플의 칩, OS, 서비스에 걸친 수직 통합은 1,100달러의 평균 판매 가격(ASP)을 정당화할 수 있는 일관된 사용자 경험을 제공하며, iOS를 경쟁사로부터 보호하고 있습니다. 안드로이드 제조업체들이 취할 수 있는 전략적 대응책으로는 보다 신속한 업데이트 제공을 약속하거나, 구글의 보안 인증 기준을 강화하는 것 등이 있습니다. 예측 기간 동안 스마트폰 시장의 플랫폼 다양화는 순수한 기술력보다는 지역별 규제, 앱 스토어의 경제성, 그리고 개발자에 대한 인센티브에 따라 좌우될 것입니다.
800달러를 넘는 초고급 스마트폰 시장은 2031년까지 연평균 6.42%의 성장률을 보일 것으로 예상되며, 이는 다른 모든 가격대를 웃도는 성장률일 것으로 전망됩니다. iPhone 16 Pro Max나 Galaxy S25 Ultra와 같은 플래그십 모델은 티타늄 프레임, 페리스코프 렌즈, 기기 내 AI 등을 탑재하여 지각 가치를 높이고 있습니다. 중고차 임베디드 할인이나 통신사의 할부 결제 덕분에 실질적인 구매 장벽이 낮아져, 이 제품을 동경하는 구매자들을 이 부문으로 끌어들이고 있습니다. 한편, 200달러 미만의 보급형 모델은 부품 원가(BoM) 상승과 재생 제품과의 경쟁에 직면해 있어, 이미 낮은 이익률이 더욱 압박받고 있습니다.
200-499달러 가격대의 중급형 단말기는 5G 연결, 멀티 센서 카메라, 고속 충전 기능을 합리적인 가격에 제공함으로써 2025년 매출의 대부분을 차지했습니다. 각 제조업체는 이 가격대를 발판으로 삼아, 기간 한정 프로모션이나 액세서리 번들 판매를 통해 상위 기종으로의 업셀링을 도모하고 있습니다. 프리미엄(500-799 달러)은 소비자가 '가성비' “카”'플래그십 체험' 이 두 가지 중 하나로 양극화되는 가운데, 축소되고 있는 중산층을 차지하고 있습니다. 미드레인지 스마트폰 시장 규모는 앞으로도 확대될 전망이지만, 매출 구성비는 하드웨어의 단계적 업그레이드를 통해 매우 높은 이익률을 가져다주는 울트라 프리미엄 부문으로 이동해 나갈 것입니다.
지역별 분석
아시아태평양은 중국의 방대한 기존 사용자 기반과 인도의 제조 성장세에 힘입어 2025년 매출의 42.81%를 차지하며 계속해서 주도적인 위치를 유지했습니다. 화웨이의 'Mate 60 Pro'에서 볼 수 있듯이, 중국이 자체 설계 반도체로의 전환을 추진하는 가운데, 프리미엄층 구매자들은 현지 브랜드로 눈을 돌리고 있습니다. 한편, 인도의 ‘"생산 연계형 인센티브(PLI)" 이 제도는 누적 150억 달러 규모의 휴대전화 투자를 유치하여 수출 역량을 확대하는 한편, 세계 평균 판매 가격(ASP)을 낮추고 있습니다.
북미의 단말기 교체 속도는 플래그십 모델의 가격을 숨기는 통신사의 할부 지원에 의존하고 있습니다. 애플은 중고 기기 보상 판매 혜택을 바탕으로 2025년 미국 프리미엄 시장 점유율의 절반 이상을 차지했습니다. 한편, 삼성은 갤럭시 S25의 인센티브 덕분에 사전 예약 주문량을 전년 대비 15% 늘렸습니다. 캐나다와 멕시코에서도 비슷한 추세가 나타나고 있으며, 대도시권의 프리미엄 수요와 경제적으로 취약한 지역의 중저가 제품 보급이 균형을 이루고 있습니다.
유럽 시장은 여전히 세분화되어 있습니다. 독일과 프랑스에서는 데이터 개인정보 보호 기능이 중시되는 반면, 영국에서는 무제한 데이터 통신이 포함된 통신사의 요금제가 주류를 이루고 있습니다. '디지털 시장법(Digital Markets Act)' 이는 앱 스토어의 경제 구조를 일변시킬 뿐만 아니라, 지역 업체와 대체 결제 시스템에 새로운 기회를 가져다줄 가능성이 있습니다.
남미의 성장은 브라질에서의 현지 생산에 달려 있습니다. 해당 국가에서는 레노보 산하의 모토로라가 현지 구매력에 맞춘 중급형 단말기를 통해 시장 점유율 1위를 차지하고 있습니다. 환율 변동이 가격 책정을 복잡하게 만들고 있지만, 주요 도시에서의 5G 서비스가 확대되면서 기기 교체 수요가 촉진되고 있습니다.
중동은 연평균 성장률(CAGR) 10.83%를 기록하며, 예측 성장률 1위를 차지하고 있습니다. 사우디아라비아와 아랍에미리트(UAE)의 높은 가처분 소득과 정부의 디지털화 추진 정책이 맞물려 프리미엄 단말기의 판매를 견인하고 있습니다. 통신 사업자들은 mm파(mmWave)의 도입을 가속화하고 있으며, 플래그십급 스마트폰이 필요한 AR 관광 가이드 및 기업용 IoT 시범 프로젝트를 지원하고 있습니다.
아프리카 시장은 여전히 가격에 대한 민감도가 매우 높으며, 듀얼 SIM 지원 및 장시간 배터리 사용에 최적화된 트랜션(Transsion) 브랜드가 시장을 독점하고 있습니다. 나이지리아와 케냐에서 진행될 5G 주파수 대역 경매는 단계적인 기기 교체를 촉진할 것으로 보이지만, 가격 부담으로 인해 당분간은 보급형 단말기와 리퍼브 단말기가 주류를 이어갈 전망입니다.
기타 혜택 :
- 엑셀 형식 시장 예측(ME) 시트
- 3개월간의 애널리스트 지원
자주 묻는 질문
목차
제1장 서론
제2장 조사 방법
제3장 주요 요약
제4장 시장 구도
제5장 시장 규모 및 성장 예측
제6장 경쟁 구도
제7장 시장 기회 및 향후 전망
KTH 26.07.07According to Mordor Intelligence, the smartphones market size is expected to grow from USD 585.63 billion in 2025 to USD 609.29 billion in 2026 and is forecast to reach USD 739.23 billion by 2031 at 3.94% CAGR over 2026-2031.
This report is Segmented by Operating System (Android, IOS, and More), Price Band (Entry-Level, Mid-Range and More), Technology (5G, 4G/LTE, and More), Form Factor (Bar, Foldable/Flip, and More), Distribution Channel (Operator/Carrier Stores, Brand-Owned Retail, and More), End-User (Consumer/Individual and More) and Geography. The Market Forecasts are Provided in Terms of Value (USD) and Volume (Units).
Global Smartphones Market Trends and Insights
AI-Enabled Upgrade Cycle Accelerates Replacements
On-device generative AI, now capable of more than 40 trillion operations per second, has become a headline feature in flagship launches. Apple's A18 Pro and Qualcomm's Snapdragon 8 Elite showcase neural engines that deliver real-time translation, image synthesis, and personal-assistant tasks without cloud latency. In North America and Europe, this capability shortened replacement cycles in the smartphones market, as 38% of surveyed users in 2025 cited AI as their primary upgrade trigger. Premium buyers perceive tangible day-to-day benefits, such as instant meeting summaries and on-device photo editing, which reinforce a willingness to pay flagship pricing. Chinese vendors are responding quickly: MediaTek's Dimensity 9400 delivers a 30% power-efficiency gain for multimodal assistants, making AI a cross-platform baseline. The arms race is likely to persist through 2029 as chipmakers chase ever-larger parameter models optimized for handset thermals.
Premiumization Sustained by Financing, Trade-Ins, and Extended Software Support
Zero-interest installment plans and aggressive trade-in credits are shifting consumer focus from upfront cost to monthly affordability. U.S. carriers now stretch payments over 36 months, effectively turning a USD 1,200 flagship into a USD 33 obligation, while Apple processed more than 12 million trade-ins in 2024 that shaved up to USD 500 off the sticker price. Seven-year update pledges from Samsung and Google further lower total cost of ownership, reassuring buyers that premium models will stay secure and current well past typical refresh cycles. Together, these mechanisms keep premium demand in the smartphones market resilient even during macro softness and funnel more revenue into higher ASP tiers. Emerging markets are beginning to mirror this behavior as local banks and fintechs roll out installment-based handset loans.
Memory Supply Tightness Lifts BoM Costs
DRAM spot prices climbed roughly 20% in late 2024 as wafer capacity was diverted to high-bandwidth server modules. Samsung and SK Hynix prioritized automotive and data-center customers, leaving mobile LPDDR shortfalls that forced entry-level Android vendors to dial back memory configurations. In price-sensitive markets, a USD 10 increase pushes buyers toward 4 GB variants or even feature phones, eroding volume forecasts. Component inflation also squeezes razor-thin gross margins, prompting some tier-two brands to postpone launches or bundle fewer accessories. Relief is unlikely before mid-2026 when new fabs ramp, keeping pressure on low-end ASPs across the smartphones market and potentially widening the digital divide.
Other drivers and restraints analyzed in the detailed report include:
- Entry-Level 5G Proliferation in Emerging Markets
- Foldable Maturation Expands High-Value Niches
- Used or Refurbished Smartphone Growth Cannibalizes New Device Demand
For complete list of drivers and restraints, kindly check the Table Of Contents.
Segment Analysis
Android retained 69.21% smartphones market share in 2025, yet HarmonyOS and KaiOS are growing at 5.29% annually, signaling gradual fragmentation. Huawei shipped more than 70 million HarmonyOS phones in 2024, fortifying a China-centric ecosystem that operates without Google services. KaiOS, powering ultra-low-cost devices, surpassed 150 million cumulative activations, introducing first-time internet users to app-based experiences. The smartphones market size for alternative platforms remains small today, but their trajectory challenges Android's ubiquity in specific niches. Regulatory shifts, including the EU Digital Markets Act and India's interoperability proposals, level the playing field by mandating third-party app stores and cross-platform messaging. As compliance costs rise, both iOS and Android may concede incremental share to regional or purpose-built platforms that promise data sovereignty or superior low-end performance.
Apple's iOS meanwhile consolidates pricing power: fiscal 2024 iPhone revenue hit USD 200 billion, driven by Pro variants that anchor the ultra-premium tranche. Apple's vertical integration of silicon, operating system, and services delivers a cohesive experience that justifies a USD 1,100 ASP, insulating iOS from price-based competition. For Android vendors, strategic responses include faster update pledges and tighter Google security certifications. Over the forecast, platform diversification in the smartphones market will hinge on localized regulation, app-store economics, and developer incentives rather than pure technological capability.
Ultra-premium smartphones above USD 800 are projected to grow at 6.42% through 2031, outpacing every other tier. Flagships such as iPhone 16 Pro Max and Galaxy S25 Ultra integrate titanium frames, periscope lenses, and on-device AI that elevate perceived value. Trade-in credits and carrier financing reduce the effective purchase hurdle, drawing aspirational buyers into the segment. At the other extreme, entry-level models below USD 200 face BoM inflation and heightened competition from refurbished units, which narrows already thin margins.
Mid-range devices, priced USD 200-499, captured the bulk of 2025 revenue by offering 5G connectivity, multi-sensor cameras, and fast charging at palatable prices. Vendors use this band as a stepping stone, upselling via limited-time promotions or bundling accessories. Premium (USD 500-799) occupies a shrinking middle ground as consumers polarize toward either value or flagship experiences. The smartphones market size for mid-range will still expand, but the revenue mix will tilt toward ultra-premium where incremental hardware upgrades command outsized margins.
Complete Report Scope:
- Overall Market Estimates
- Total Market Value (USD)
- Total Market Volume (Units)
- By Operating System (Value, and Volume)
- Android
- iOS
- Others (HarmonyOS, KaiOS)
- By Price Band (Value, and Volume)
- Entry-Level (Less Than USD 200)
- Mid-Range (USD 200-499)
- Premium (USD 500-799)
- Ultra-Premium (More Than USD 800)
- By Technology (Network Generation) (Value)
- 5G
- 4G or LTE
- 3G and Below
- By Form Factor (Value)
- Bar
- Foldable or Flip
- Rugged or Industrial
- By Distribution Channel (Value)
- Operator or Carrier Stores
- Brand-Owned Retail
- Multi-Brand Physical Retail
- Online Direct-to-Consumer
- By End User (Value)
- Consumer or Individual
- Enterprise or SME
- Public Sector or Government
- By Geography (Value)
- North America
- United States
- Canada
- Mexico
- South America
- Brazil
- Argentina
- Chile
- Colombia
- Rest of South America
- Europe
- Germany
- France
- United Kingdom
- Italy
- Spain
- Russia
- Rest of Europe
- Asia-Pacific
- China
- India
- Japan
- South Korea
- Southeast Asia (Singapore, Thailand, Indonesia, Vietnam, Philippines, Malaysia)
- Australia
- Rest of Asia-Pacific
- Middle East
- Saudi Arabia
- United Arab Emirates
- Rest of the Middle East
- Africa
- South Africa
- Nigeria
- Rest of Africa
- North America
Geography Analysis
Asia Pacific retained leadership with 42.81% of 2025 revenue, driven by China's vast installed base and India's manufacturing momentum. China's shift to domestically designed silicon, exemplified by Huawei's Mate 60 Pro, is steering premium buyers toward local brands, while India's Production-Linked Incentive scheme attracted USD 15 billion in cumulative handset investment, scaling export capacity and lowering global ASPs.
North America's upgrade cadence relies on carrier financing that conceals flagship prices. Apple captured over half of the U.S. premium segment in 2025, aided by trade-in credits, while Samsung boosted pre-orders 15% year-over-year with Galaxy S25 incentives. Canada and Mexico echo similar dynamics, balancing premium demand in metro areas with mid-range uptake in less affluent regions.
Europe's market remains fragmented: Germany and France highlight data-privacy features, whereas the United Kingdom leans on carrier deals that bundle unlimited data. The Digital Markets Act may reshape app-store economics, creating openings for regional players and alternative payment systems.
South America's growth hinges on Brazil's localized production, where Lenovo-owned Motorola commands share through mid-range devices adapted to local spending power. Currency volatility complicates pricing, yet 5G deployments in major cities stimulate replacement demand.
The Middle East leads forecast growth at a 10.83% CAGR. High disposable incomes in Saudi Arabia and the United Arab Emirates, coupled with government digitalization agendas, lift premium device sales. Operators accelerate mmWave rollouts, supporting AR tourism guides and enterprise IoT pilots that require flagship-grade smartphones.
Africa's market remains fiercely price sensitive, dominated by Transsion brands optimized for dual-SIM use and long battery life. 5G spectrum auctions in Nigeria and Kenya will spur gradual upgrades, but affordability constraints keep entry-level and refurbished devices prominent in the near term.
- Apple Inc.
- Samsung Electronics Co. Ltd
- Xiaomi Corporation
- OPPO (incl. OnePlus)
- Vivo Communication Technology Co., Ltd.
- Transsion Holdings Co., Ltd. (TECNO, Infinix, itel)
- Huawei Technologies Co., Ltd
- Honor Device Co., Ltd.
- Google LLC
- Motorola Mobility LLC (Lenovo Group Ltd)
- Realme Chongqing Mobile Telecommunications Corp., Ltd.
- HMD Global Oy (Nokia)
- Sony Corp.
- ASUSTeK Computer Inc.
- ZTE Corp.
- TCL Technology (Group) Co. Ltd (Alcatel)
- Nothing Technology Ltd
- Kyocera Corporation
- Sharp Corporation
- Fairphone B.V.
Additional Benefits:
- The market estimate (ME) sheet in Excel format
- 3 months of analyst support
TABLE OF CONTENTS
1 INTRODUCTION
- 1.1 Study Assumptions and Market Definition
- 1.2 Scope of the Study
2 RESEARCH METHODOLOGY
3 EXECUTIVE SUMMARY
4 MARKET LANDSCAPE
- 4.1 Market Overview
- 4.2 Market Drivers
- 4.2.1 AI-Enabled Upgrade Cycle Accelerates Replacements (On-Device GenAI, Multimodal Assistants)
- 4.2.2 Premiumization Sustained by Financing, Trade-Ins, and Extended Software Support
- 4.2.3 Entry-Level 5G Proliferation in Emerging Markets
- 4.2.4 Foldable Maturation Expands High-Value Niches
- 4.2.5 Carrier-Led Promotions and Device Financing in Mature Markets
- 4.2.6 Regional Manufacturing Localization Incentives (India, Vietnam, Middle East, and Africa) Reduce Costs and Lead Times
- 4.3 Market Restraints
- 4.3.1 Memory Supply Tightness Lifts BoM Costs, Pressuring Low-End Android
- 4.3.2 Used or Refurbished Smartphone Growth Cannibalizes New Device Demand
- 4.3.3 Slower Refresh Cycles from Durability and Incremental Innovation
- 4.3.4 Geopolitics and Tariffs Shifting SKUs, Raising Logistics Complexity
- 4.4 Industry Value Chain Analysis
- 4.5 Macroeconomic Impact Analysis
- 4.6 Regulatory Landscape
- 4.6.1 Spectrum Allocation and Licensing (2G/3G/4G/5G)
- 4.6.2 eSIM Readiness and IoT Device Enablement
- 4.6.3 Device Import Policy and Local Manufacturing or Assembly Rules
- 4.7 Technological Outlook
- 4.7.1 SoC Roadmaps (NPU TOPS, RF Integration, Satellite NTN)
- 4.7.2 Display Stack (LTPO, Micro-Lens OLED, UDR Glass, Anti-Reflective Coatings)
- 4.7.3 Camera or Computational Photography (Periscope, Stacked Sensors, ISP or AI Fusion)
- 4.7.4 Battery or Charging (Silicon Anodes, GaN Fast Charge, BMS Safety)
- 4.7.5 Connectivity (Wi-Fi 7, Bluetooth LE Audio, UWB, 5G-Advanced)
- 4.8 Smartphone Device Lifecycle Analysis
- 4.8.1 Stakeholder Lifecycle Mapping
- 4.8.2 Key Pain-Point Analysis by Stakeholder
- 4.9 Porter's Five Forces Analysis
- 4.9.1 Bargaining Power of Suppliers
- 4.9.2 Bargaining Power of Buyers
- 4.9.3 Threat of New Entrants
- 4.9.4 Threat of Substitutes
- 4.9.5 Intensity of Competitive Rivalry
5 MARKET SIZE AND GROWTH FORECASTS (VALUE AND VOLUME)
- 5.1 Overall Market Estimates
- 5.1.1 Total Market Value (USD)
- 5.1.2 Total Market Volume (Units)
- 5.2 By Operating System (Value, and Volume)
- 5.2.1 Android
- 5.2.2 iOS
- 5.2.3 Others (HarmonyOS, KaiOS)
- 5.3 By Price Band (Value, and Volume)
- 5.3.1 Entry-Level (Less Than USD 200)
- 5.3.2 Mid-Range (USD 200-499)
- 5.3.3 Premium (USD 500-799)
- 5.3.4 Ultra-Premium (More Than USD 800)
- 5.4 By Technology (Network Generation) (Value)
- 5.4.1 5G
- 5.4.2 4G or LTE
- 5.4.3 3G and Below
- 5.5 By Form Factor (Value)
- 5.5.1 Bar
- 5.5.2 Foldable or Flip
- 5.5.3 Rugged or Industrial
- 5.6 By Distribution Channel (Value)
- 5.6.1 Operator or Carrier Stores
- 5.6.2 Brand-Owned Retail
- 5.6.3 Multi-Brand Physical Retail
- 5.6.4 Online Direct-to-Consumer
- 5.7 By End User (Value)
- 5.7.1 Consumer or Individual
- 5.7.2 Enterprise or SME
- 5.7.3 Public Sector or Government
- 5.8 By Geography (Value)
- 5.8.1 North America
- 5.8.1.1 United States
- 5.8.1.2 Canada
- 5.8.1.3 Mexico
- 5.8.2 South America
- 5.8.2.1 Brazil
- 5.8.2.2 Argentina
- 5.8.2.3 Chile
- 5.8.2.4 Colombia
- 5.8.2.5 Rest of South America
- 5.8.3 Europe
- 5.8.3.1 Germany
- 5.8.3.2 France
- 5.8.3.3 United Kingdom
- 5.8.3.4 Italy
- 5.8.3.5 Spain
- 5.8.3.6 Russia
- 5.8.3.7 Rest of Europe
- 5.8.4 Asia-Pacific
- 5.8.4.1 China
- 5.8.4.2 India
- 5.8.4.3 Japan
- 5.8.4.4 South Korea
- 5.8.4.5 Southeast Asia (Singapore, Thailand, Indonesia, Vietnam, Philippines, Malaysia)
- 5.8.4.6 Australia
- 5.8.4.7 Rest of Asia-Pacific
- 5.8.5 Middle East
- 5.8.5.1 Saudi Arabia
- 5.8.5.2 United Arab Emirates
- 5.8.5.3 Rest of the Middle East
- 5.8.6 Africa
- 5.8.6.1 South Africa
- 5.8.6.2 Nigeria
- 5.8.6.3 Rest of Africa
- 5.8.1 North America
6 COMPETITIVE LANDSCAPE
- 6.1 Market Concentration
- 6.2 Strategic Moves (M&A, Partnerships, Local Assembly MoUs)
- 6.3 Market Share Analysis
- 6.4 Company Profiles (includes Global Level Overview, Market Level Overview, Core Segments, Financials as available, Strategic Information, Market Rank/Share, Products and Services, Recent Developments)
- 6.4.1 Apple Inc.
- 6.4.2 Samsung Electronics Co. Ltd
- 6.4.3 Xiaomi Corporation
- 6.4.4 OPPO (incl. OnePlus)
- 6.4.5 Vivo Communication Technology Co., Ltd.
- 6.4.6 Transsion Holdings Co., Ltd. (TECNO, Infinix, itel)
- 6.4.7 Huawei Technologies Co., Ltd
- 6.4.8 Honor Device Co., Ltd.
- 6.4.9 Google LLC
- 6.4.10 Motorola Mobility LLC (Lenovo Group Ltd)
- 6.4.11 Realme Chongqing Mobile Telecommunications Corp., Ltd.
- 6.4.12 HMD Global Oy (Nokia)
- 6.4.13 Sony Corp.
- 6.4.14 ASUSTeK Computer Inc.
- 6.4.15 ZTE Corp.
- 6.4.16 TCL Technology (Group) Co. Ltd (Alcatel)
- 6.4.17 Nothing Technology Ltd
- 6.4.18 Kyocera Corporation
- 6.4.19 Sharp Corporation
- 6.4.20 Fairphone B.V.
7 MARKET OPPORTUNITIES AND FUTURE OUTLOOK
- 7.1 White-Space and Unmet-Need Assessment