|
시장보고서
상품코드
2073546
부유식 LNG 발전소 시장 : 점유율 분석, 업계 동향과 통계, 성장 예측(2026-2031년)Floating LNG Power Plant - Market Share Analysis, Industry Trends & Statistics, Growth Forecasts (2026 - 2031) |
||||||
 Mordor Intelligence
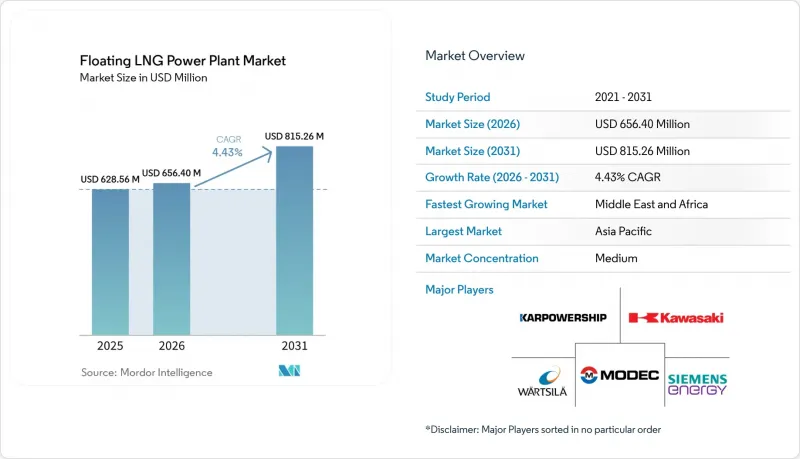
Mordor Intelligence에 의하면, 부유식 LNG 발전소 시장은 2025년 6억 2,856만 달러에서 동년중에 6억 5,640만 달러로 확대되어 2031년까지 8억 1,526만 달러에 이를 것으로 예측되며, 2025년부터 2031년까지 예측 기간에서 CAGR 4.43%를 나타낼 전망입니다.
본 보고서는 유형별(발전 바지선, 발전선), 발전 용량별(50MW 이하 및 그 이상), 용도별(피크 전력 공급, 베이스로드 공급, 비상시·재해 구호), 최종 사용자별(유틸리티·독립발전사업자(IPP), 산업, 상업·데이터센터), 그리고 지역별(북미, 유럽, 아시아태평양, 남미, 중동 및 아프리카)로 분류되어 있습니다. 시장 전망은 금액(달러) 기준으로 제시되어 있습니다.
세계 부유식 LNG 발전소 시장 동향과 인사이트
디젤 연료에 비해 LNG의 가격 경쟁력이 여전히 가장 강력한 상업적 촉진요인으로 작용하고 있습니다.
부유식 LNG 발전소 시장은 여전히 강력한 연료비 경쟁력에 힘입어 성장하고 있습니다. 그 예로, 2026년 UHERO가 보고한 데이터에 따르면, 브렌트 원유 연동 조건 하에서 LNG공급 가격은 1 MMBtu당 17.9달러였던 반면, LSFO(저유황 중유)는 1 MMBtu당 22.2달러였습니다. 인도네시아에서도 유사한 비용 추세가 확인되었으며, 2025년 4월에 발표된 동료 심사를 거친 연구에 따르면, 섬 지역의 발전소에 공급되는 천연가스 가격은 1 MMBtu당 10.4-11.3달러로, 1 MMBtu당 25.5달러인 고속 디젤 연료보다 훨씬 낮아, 천연가스는 55-60%의 비용 우위를 유지하고 있습니다. 이러한 가격 차이가 부유식 LNG 발전소 시장의 프로젝트 활동을 주도하고 있습니다. 예를 들어, PLN EPI는 2025년 3월, 15억 달러 규모의 소규모 LNG 프로그램을 발표했습니다. 이는 총 출력 2,148 MW인 41곳의 도서 발전소를 대상으로 하며, 연간 3억 달러의 디젤 연료비 절감을 목표로 하고 있습니다.
부유식 저장·재기화·발전 선박을 통합한 솔루션은 자산을 분리했을 때보다 더 큰 비용 경쟁력을 제공합니다. Rahmanta 씨 등이 실시한 조사에 따르면, FSRU와 발전 자산을 별도로 조달할 경우, 허브 앤 스포크형 공급망 비용이 가스 공급 가격의 30-40%를 차지할 가능성이 있다고 지적되고 있습니다. 이는 LNG에서 발전까지 이어지는 공급망에서 중간 비용 발생 단계를 제거하는 통합형 선박 솔루션의 장점을 여실히 보여주고 있습니다. 그 결과, 부유식 LNG 발전소 시장은 연료비 절감뿐만 아니라 효율화된 공급 모델로부터도 혜택을 보고 있습니다. 입찰 과정에서 재기화와 발전 과정을 분리하는 조달 전략은 통합 솔루션의 상업적 이점을 과소평가할 위험이 있으며, 단일 플랫폼을 통해 연료 수취, 저장, 재기화, 발전의 모든 과정을 제공할 수 있는 사업자에게 유리하게 작용합니다.
IMO의 CII 및 EEXI가 가스 연료 선박으로의 선단 전환을 가속화하고 있습니다.
부유식 LNG 발전소 시장은 규제 동향과 연료 경제성의 영향을 받고 있습니다. 2025년 4월 IMO MEPC 제83차 회의의 성과로, 2단계 온실가스(GHG) 연료 강도 체계가 도입되었으며, 2008년 기준치에 비해 2028년까지 4-17%, 2035년까지 30-43%의 감축이 요구되고 있습니다. 이러한 틀에서 메탄 슬립률이 0.2% 전후인 고압 디젤 사이클 엔진을 탑재한 LNG선은 슬립률이 현저히 높은 오토식 중속 엔진을 탑재한 선박에 비해 상업적으로 유리한 입장에 있습니다. 이는 이미 시장의 선박 사양에 영향을 미치고 있습니다. 예를 들어, 발츠이라사는 2026년 1월, 자사의 “NextDF” 기술을 통해 4행정 듀얼 연료 엔진의 메탄 누출을 1% 미만으로 줄일 수 있다고 발표했으며, 새로운 설계가 규제 요건을 더욱 잘 충족하게 되었습니다.
비용 측면에서의 압박은 특히 유럽에서 두드러집니다. 해당 지역에서는 2026년부터 EU 배출권 거래 제도(EU ETS)의 적용 범위가 메탄 및 아산화질소까지 확대되었습니다. EU 항구에 기항하는 운항 사업자는 2026년에 2025년 선박 배출량의 70%에 해당하는 배출권을 반환해야 합니다. 이러한 규제 변경으로 인해 부유식 LNG 발전소 시장에서 양극화가 나타나고 있습니다. 선박 용선 사업의 수익성을 유지할 수 있는 새로운 선단은 유리한 입장에 있는 반면, 구형 오토사이클 선박은 2020년대 말까지 대규모 개조나 퇴역 중 하나를 선택해야 하는 중대한 결단을 내려야할 것입니다. 메탄 배출 감축 대책에 조기에 투자하는 선주는 2026년부터 2031년까지의 기간 동안 선박 재용선 기회를 확보할 수 있습니다. 반대로, 이러한 투자를 미루는 선주는 선박 평가액의 하락이나 가격 결정력의 약화에 직면할 가능성이 높을 것입니다.
선박 용선료의 변동이 밸류체인 전반에 자금 조달 리스크를 초래합니다.
부유식 LNG 발전소 시장에서는 용선료가 크게 변동할 경우 자금 조달에 어려움이 발생합니다. 이는 선박의 수익성, 연료비 전가 조건 및 요금 회수가 계약 체결 시점의 용선료 주기와 밀접하게 연관되어 있기 때문입니다. 2022년 이전에는 하루 평균 8만-12만 달러였던 FSRU 용선료는 유럽의 에너지 위기로 인해 하루 18만-20만 달러까지 급등했으나, 2024년 중반까지 개조 선박의 경우 하루 약 13만-15만 달러 수준에서 안정되었습니다. 초안에 인용된 분석에 따르면, LNG 및 선박 용선 시장이 침체된 상황에서 장기 전력 구매 계약(PPA)을 체결하는 것이 어려워지고 있는 것이 시장의 주요 과제로 대두되고 있습니다. 패스스루 조항은 가격 변동 위험을 오프테이커에게 전가하는 반면, 고정 가격 구조는 사업자의 이익률을 압박합니다. 예를 들어, 이 초안에서는 브라질의 사례가 언급되어 있는데, 해당국의 FSRU 8척에 대한 용선 계약은 하루당 100만 달러에 육박하며, 4년간 총 15억 달러로 추정되며, 그 비용은 규제된 요금에 전가되고 있습니다. 2022년부터 2023년 성수기에 용선 계약을 확보한 사업자들은 현재 시장이 침체된 상황에서 저비용 선박들과 경쟁해야 하는 처지에 놓여 있어, 재입찰에서 불리한 입장에 처해 있습니다. 이로 인해 부유식 LNG 발전소에 대한 수요가 사라지는 것은 아니지만, 밸류체인 전반에 걸쳐 자금 조달, 차입금 재조달 및 요금 승인 관련 과제가 증가하고 있습니다.
부문별 분석
2025년에는 부유식 LNG 발전소 시장 점유율의 59.6%를 파워버지가 차지했으나, 파워십은 2031년까지 연평균 성장률(CAGR) 5.1%로 성장할 것으로 전망됩니다. 파워바가 시장을 독점하고 있는 이유는 그 구조 설계가 더 단순하기 때문입니다. 이를 통해 선체 비용이 절감되고, 터빈, 열회수 시스템, 제어 장비를 위한 추가 갑판 공간이 확보됩니다. 이러한 설계상의 장점 덕분에 일반적으로 동급의 발전선과 비교했을 때 총 자본 지출(CAPEX)을 15-20% 절감할 수 있으므로, 가격에 민감한 입찰에서 바지선은 비용 대비 효율이 높은 선택지가 되고 있습니다. 부유식 LNG 발전소 시장에서 바지의 낮은 건설 비용은 기동성이 그다지 중요하지 않고, 설치 효율과 안정적인 출력이 우선시되는 베이스로드 계약과 잘 부합합니다.
발전선은 계약 체결 후 몇 주 이내에 재배치가 가능한 자체 항해 능력을 갖추고 있어 시장 점유율을 급성장하고 있습니다. 이러한 특징은 긴급 입찰이나 단기간에 진행되는 용량 경매에서 특히 유리합니다. 예를 들어, ST 엔지니어링이 2025년 10월에 체결한 “에스트렐라 델 마르 IV” 계약은 선상에 리튬 이온 배터리 저장 시스템을 탑재한 145MW 규모의 부유식 복합 사이클 발전소로, 기동성과 하이브리드 발전 능력의 통합이 진행되고 있음을 여실히 보여주고 있습니다. 이러한 유연성 덕분에 선박은 기본 부하 및 피크 지원 역할을 전환할 수 있게 되었으며, 부유식 LNG 발전소 시장에서 가스를 전력으로 변환하는 핵심 기능을 유지하면서 수익 기회를 확대되고 있습니다. 예측 기간 동안 발전 바지가 주류 형태로 자리매김할 것으로 예상되지만, 정부가 신속한 대응, 계약의 유연성, 그리고 최소한의 토목 인프라 요건을 바탕으로 국경을 넘어 발전 용량을 재배치할 수 있는 능력을 우선시하는 시나리오에서는 발전선이 더욱 주목받을 전망입니다.
51-200 MW 범위는 2025년 부유식 LNG 발전소 시장 규모의 49.3%를 차지하고 있으며, 이는 섬 지역의 송전망, 외딴 지역의 산업용 부하 및 소규모 도시 시스템에 적합함을 보여줍니다. 이 출력 범위에서는 부유식 플랫폼에 복합 사이클 가스 터빈 구성을 도입할 수 있으며, 단순 사이클 오픈 프레임 시스템의 순효율이 35-42%인 데 비해 50-55%의 순효율을 달성할 수 있습니다. 이 범위는 관리하기 쉬운 선박 크기와 향상된 연료 효율 간의 균형을 제공하기 때문에 대형 단일 선박 설비를 도입할 여지가 없는 경우나 안정적인 출력이 필요한 용도에서 중요한 부문으로 자리 잡고 있습니다.
401 MW 이상의 부문은 2031년까지 연평균 성장률(CAGR)이 5.9%에 달하고, 가장 빠르게 성장하는 부문이 될 것으로 전망됩니다. 이러한 성장은 여러 설비에 따른 조정 위험을 최소화하기 위해 단일 선박 솔루션을 우선시하는 전력 회사들에 의해 주도되고 있습니다. 이러한 추세는 남아시아와 아프리카에서 특히 두드러지며, 이들 지역에서는 대규모 전력 회사의 조달 과정에서 모듈식 증설보다 대형 부유식 발전소가 점점 더 선호되고 있습니다. 2026년 5월까지 카포십사의 선단은 45척으로 8,500 MW를 넘어섰으며, 대규모 확장의 상업적 실현 가능성을 입증했습니다. 한편, 50MW 이하 구간은 비상시 백업이나 소규모 도서 지역에서의 이용에 있어 여전히 중요한 역할을 수행하고 있으며, 201-400MW 구간은 광업, 해상 유전 공급 및 외딴 지역의 산업용 전력 수요를 계속해서 충족시키고 있습니다. 이러한 분야에서는 연료 물류 및 송전망의 수용 능력 측면에서 중형 선박이 유리하기 때문입니다.
지역별 분석
2025년, 아시아태평양은 부유식 LNG 발전소 시장 점유율의 36.1%를 차지하며, 현재 수요 측면에서 가장 규모가 큰 지역 거점으로 자리매김하고 있습니다. 이 지역은 인도네시아, 말레이시아, 일본, 한국 등 여러 국가에서 나타나는 섬 지역의 전기화 수요, 해안 지역의 고밀도 부하 센터, 그리고 성숙한 LNG 공급망이 맞물려 혜택을 보고 있습니다. 인도네시아는 여전히 주요 시장이며, PLN EPI는 2025년 3월, 41곳의 도서 발전소를 지원하기 위해 15억 달러 규모의 소규모 LNG 프로그램을 시작했습니다. 심사 완료된 분석에 따르면, 통합형 FSRPP 구조를 채택함으로써 자산이 분리되어 있을 경우 가스 공급 가격의 30-40%를 차지할 가능성이 있는 공급망 단계를 제거하여 비용을 절감할 수 있는 것으로 밝혀졌습니다. 또한, 베트남 하이퐁 FSRU 프로젝트나 JERA가 제안한 하와이 FSRU 연계 프로그램에서 볼 수 있듯이, 이 지역은 기존 시장을 넘어 확장되고 있으며, 아시아태평양의 전문 지식이 인접한 섬 전력 회랑으로 수출되고 있음이 드러나고 있습니다.
중동 및 아프리카는 2031년까지 연평균 성장률(CAGR) 4.6%를 기록하며 성장할 것으로 예상되며, 부유식 LNG 발전소 시장에서 가장 빠르게 성장하는 지역이 될 전망입니다. 이러한 성장은 2050년까지 아프리카 전역의 천연가스 수요가 60% 증가할 것이라는 아프리카 에너지 협회의 예측에 의해 뒷받침되고 있습니다. 세네갈의 다카르 프로젝트는 이러한 추세를 상징하는 사례로, 육상 가스 인프라 없이도 국내 수요의 최대 25%를 충당할 수 있는 335 MW 규모의 통합형 LNG 발전 시스템을 갖추고 있습니다. 이집트는 부유식 가스 허브로서의 역할을 더욱 공고히 하고 있으며, Hoegh Evi사가 운영하는 ‘Hoegh Gandria”호의 10년간 용선 계약에 따라, 2026년 4분기부터 스메드 항에서 피크 시 재기화 용량이 최대 1,000 mmscfd 증가할 것으로 예측됩니다. 마찬가지로, 2026년 5월 요르단이 아카바에 새로운 FSRU를 임대하기로 결정한 것은 이 지역의 가스 공급망 안보에 있어 표준적인 구성 요소로서 부유식 재기화 시설에 대한 의존도가 높아지고 있음을 여실히 보여주고 있습니다.
유럽과 북미·남미는 규모 면에서는 현재 아직 소규모 시장이지만, 부유식 LNG 발전소 시장에 있어 전략적으로 중요한 위치를 계속 차지하고 있습니다. 이 지역들에서는 예비 전력 수요, 가스 공급 안정성에 대한 우려, 그리고 대규모 조달 사업이 복합적으로 작용하고 있습니다. 브라질에서는 2026년 예비 발전 용량 입찰을 통해 약 8.5GW 규모의 LNG 화력 발전 용량이 계약되었으며, 여러 주에 걸쳐 신설되거나 확장된 FSRU 인프라를 지원하기 위해 약 480억 브라질 레알(96억 달러) 규모의 투자가 유치되었습니다. 남미와 북미에서는 멕시코 유카탄 반도에의 도입 사례와 JERA사의 하와이 제안이, 육상 인프라가 가동되기 전에 조정 가능한 전력이 필요한 개척 지역과 규제 대상 지역 모두에서 기회를 부각시키고 있습니다. 유럽에서는 공급 안정성이 여전히 최우선 과제로 남아 있으며, 2026년 초에는 콩고의 LNG 생산량이 연간 300만 톤에 달할 것으로 전망됩니다. 이로써 러시아산 가스에 대한 의존도를 낮추려는 전력 사업자들에게 새로운 부유식 공급원이 확보되게 됩니다.
기타 혜택:
- 엑셀 형식 시장 예측(ME) 시트
- 3개월간의 애널리스트 지원
자주 묻는 질문
목차
제1장 서론
제2장 조사 방법
제3장 주요 요약
제4장 시장 구도
제5장 시장 규모와 성장 예측
제6장 경쟁 구도
제7장 시장 기회와 향후 전망
JHS 26.07.09According to Mordor Intelligence, the floating LNG power vessel market is expected to grow from USD 628.56 million in 2025 to USD 656.40 million in the same year and is projected to reach USD 815.26 million by 2031, registering a CAGR of 4.43% during the forecast period of 2025-2031.
This report is Segmented by Type (Power Barge, Power Ship), Power Capacity (<= 50 MW and More), Application (Peak Power Supply, Base-Load Supply, Emergency/Disaster Relief), End-User (Utilities & IPPs, Industrial, Commercial & Data-Centres), and Geography (North America, Europe, Asia-Pacific, South America, and Middle East and Africa). The Market Forecasts are Provided in Terms of Value (USD).
Global Floating LNG Power Plant Market Trends and Insights
LNG Price Advantage Over Diesel Remains the Sharpest Commercial Driver
The floating LNG power vessel market continues to rely on a strong fuel-cost advantage, as evidenced in 2026 when UHERO reported delivered LNG prices at USD 17.9 per MMBtu compared to LSFO at USD 22.2 per MMBtu under Brent-linked conditions. A similar cost dynamic was observed in Indonesia, where peer-reviewed research published in April 2025 indicated natural gas delivered to island plants at USD 10.4-11.3 per MMBtu, significantly lower than high-speed diesel at USD 25.5 per MMBtu, maintaining a 55-60% cost advantage for natural gas. This price differential is driving project activity in the floating LNG power vessel market. For instance, PLN EPI announced a USD 1.5 billion small-scale LNG program in March 2025, targeting 41 island plants with a combined capacity of 2,148 MW and aiming for annual diesel savings of USD 300 million.
Integrated floating storage, regasification, and power vessels offer an additional cost advantage over separated assets. Research by Rahmanta and co-authors highlighted that hub-and-spoke supply-chain costs can account for 30-40% of the delivered gas price when FSRU and generation assets are procured separately. This underscores the benefits of a bundled vessel solution, which eliminates an intermediate cost node in the LNG-to-power supply chain. Consequently, the floating LNG power vessel market benefits not only from lower fuel costs but also from a streamlined delivery model. Procurement strategies that separate regasification and generation in tenders risk undervaluing the commercial benefits of an integrated solution, favoring operators capable of delivering fuel intake, storage, regasification, and power generation through a single platform.
IMO CII And EEXI Are Accelerating Fleet Transition Toward Gas-Fired Vessels
The floating LNG power vessel market is influenced by regulatory developments and fuel economics. The April 2025 IMO MEPC 83 outcome introduced a two-tier GHG fuel-intensity framework, requiring reductions of 4-17% by 2028 and 30-43% by 2035 compared to 2008 baselines. Within this framework, LNG vessels equipped with high-pressure diesel-cycle engines, which have a methane slip near 0.2%, are commercially better positioned than Otto medium-speed alternatives with significantly higher slip rates. This has already impacted vessel specifications in the market. For instance, Wartsila announced in January 2026 that its NextDF technology can reduce methane slip in four-stroke dual-fuel engines to below 1%, aligning newer designs more closely with compliance requirements.
Cost pressures are particularly pronounced in Europe, where the EU ETS expanded its scope to include methane and nitrous oxide starting in 2026. Operators calling at EU ports must surrender allowances for 70% of their 2025 vessel emissions in 2026. This regulatory shift is creating a divide within the floating LNG power vessel market. Newer fleets capable of maintaining charter economics are better positioned, while older Otto-cycle assets face significant retrofit or retirement decisions by the end of the decade. Vessel owners who invest early in methane-abatement measures can safeguard rechartering opportunities during the 2026-2031 period. Conversely, those who delay such investments are likely to encounter reduced vessel valuations and diminished pricing power.
Charter Rate Volatility Creates Financing Risk Across The Value Chain
The floating LNG power vessel market experiences financing challenges when charter pricing fluctuates significantly, as vessel economics, fuel pass-through terms, and tariff recovery are closely tied to the rate cycle at the time of contract signing. FSRU charter rates, which averaged USD 80,000-120,000 per day before 2022, surged to USD 180,000-200,000 per day following the European energy crisis and stabilized at approximately USD 130,000-150,000 per day for converted vessels by mid-2024, according to the analysis referenced in the draft. A key issue for the market is the difficulty in structuring long-term Power Purchase Agreements (PPAs) in a declining LNG and charter market. Pass-through clauses transfer volatility to off-takers, while fixed-price structures reduce operator margins. For instance, the draft highlights Brazil, where charter contracts for eight FSRUs were estimated at nearly USD 1 million per day, amounting to USD 1.5 billion over four years, with costs passed through regulated tariffs. Operators who secured charters during the 2022-2023 peak now face disadvantages in rebidding, competing against lower-cost vessels in a softer market. While this does not eliminate demand for floating LNG power vessels, it increases challenges related to financing, refinancing, and tariff approvals throughout the value chain.
Other drivers and restraints analyzed in the detailed report include:
- African Gas-To-Power Tenders Are a Structural Demand Catalyst
- AI-Driven Load-Balancing Software Is Redefining Barge Operational Economics
- Methane-Slip Regulation Is Narrowing The Operational Life Of Older Dual-Fuel Fleets
For complete list of drivers and restraints, kindly check the Table Of Contents.
Segment Analysis
Power barges accounted for 59.6% of the floating LNG power vessel market share in 2025, while power ships are projected to grow at a compound annual growth rate (CAGR) of 5.1% through 2031. The dominance of power barges is attributed to their simpler structural design, which reduces hull costs and provides additional deck space for turbines, heat recovery systems, and control equipment. This design advantage typically lowers total capital expenditure (CAPEX) by 15-20% compared to similar power ships, making barges a cost-effective option in price-sensitive tenders. In the floating LNG power vessel market, the lower construction costs of barges align well with base-load contracts where mobility is less critical, and installation efficiency and stable output are prioritized.
Power ships are gaining market share more rapidly due to their self-propulsion capabilities, which enable redeployment within weeks of a contract award. This feature is particularly advantageous in emergency tenders and short-notice capacity auctions. For instance, ST Engineering's October 2025 contract for Estrella del Mar IV, a 145 MW floating combined-cycle plant equipped with onboard lithium-ion battery storage, highlights the increasing integration of mobility with hybrid dispatch capabilities. This flexibility allows vessels to transition between base-load and peak support roles, expanding revenue opportunities while maintaining their core gas-to-power function within the floating LNG power vessel market. While power barges are expected to remain the dominant format over the forecast period, power ships are poised to gain traction in scenarios where governments prioritize rapid response times, contract flexibility, and the ability to relocate capacity across borders with minimal civil infrastructure requirements.
The 51-200 MW range represented 49.3% of the floating LNG power vessel market size in 2025, highlighting its suitability for island grids, remote industrial loads, and smaller urban systems. At this capacity, combined-cycle gas turbine configurations become feasible on floating platforms, achieving net efficiency levels of 50-55%, compared to 35-42% for simple-cycle open-frame systems. This range offers a balance between manageable vessel size and improved fuel efficiency, making it a key segment for applications requiring steady output without the capacity to accommodate large single-vessel installations.
The >= 401 MW category is projected to be the fastest-growing segment, with a compound annual growth rate (CAGR) of 5.9% through 2031. This growth is driven by utilities prioritizing single-vessel solutions to minimize coordination risks associated with multiple units. This trend is particularly evident in South Asia and Africa, where large-scale utility procurement increasingly favors larger floating plants over modular additions. By May 2026, Karpowership's fleet had surpassed 8,500 MW across 45 vessels, demonstrating the commercial viability of large-scale deployments. Meanwhile, the <= 50 MW range remains significant for emergency backup and small-island applications, while the 201-400 MW range continues to serve mining operations, offshore oil-field supply, and remote industrial power needs, where mid-sized vessels are advantageous due to fuel logistics and grid absorption considerations.
Complete Report Scope:
- By Type
- Power Barge
- Power Ship
- By Power Capacity
- less than 50 MW
- 51 - 200 MW
- 201 - 400 MW
- more than 401 MW
- By Application
- Peak Power Supply
- Base-Load Supply
- Emergency / Disaster Relief
- By End-user
- Utilities & IPPs
- Industrial (Mining, O&G, Desalination)
- Commercial & Data-Centres
- By Geography
- North America
- United States
- Canada
- Mexico
- Europe
- United Kingdom
- Germany
- France
- Spain
- Nordic Countries
- Russia
- Rest of Europe
- Asia-Pacific
- China
- India
- Japan
- South Korea
- Malaysia
- Thailand
- Indonesia
- Vietnam
- Australia
- Rest of Asia-Pacific
- South America
- Brazil
- Argentina
- Colombia
- Rest of South America
- Middle East and Africa
- United Arab Emirates
- Saudi Arabia
- South Africa
- Egypt
- Rest of Middle East and Africa
- North America
Geography Analysis
Asia-Pacific accounted for 36.1% of the floating LNG power vessel market share in 2025, making it the largest regional base for current demand. The region benefits from a combination of island electrification needs, dense coastal load centers, and a mature LNG supply chain across countries such as Indonesia, Malaysia, Japan, and South Korea. Indonesia remains a key market, with PLN EPI launching a USD 1.5 billion small-scale LNG program in March 2025 to support 41 island plants. A peer-reviewed analysis highlighted that integrated FSRPP structures reduce costs by eliminating a supply-chain link that can account for 30-40% of the delivered gas price when assets are separated. Additionally, the region is expanding beyond established markets, as evidenced by the Haiphong FSRU project in Vietnam and JERA's proposed Hawaii FSRU-linked program, demonstrating that Asia-Pacific expertise is being exported to adjacent island-power corridors.
The Middle East and Africa are projected to grow at a 4.6% CAGR through 2031, making it the fastest-expanding region in the floating LNG power vessel market. This growth is supported by the African Energy Chamber's projection that natural gas demand across Africa will increase by 60% by 2050. Senegal's Dakar project exemplifies this trend with a 335 MW integrated LNG-to-power system capable of meeting up to 25% of national demand without requiring onshore gas infrastructure. Egypt is further solidifying its role as a floating gas hub, with Hoegh Evi's 10-year charter for the Hoegh Gandria expected to add up to 1,000 mmscfd of peak regasification capacity at Port of Sumed starting in Q4 2026. Similarly, Jordan's decision in May 2026 to lease a new FSRU for Aqaba underscores the growing reliance on floating regasification as a standard component of grid gas supply security in the region.
While Europe and the Americas currently represent smaller markets in terms of scale, they remain strategically significant for the floating LNG power vessel market. These regions combine reserve-power needs, gas-security concerns, and selective large-capacity procurement. In Brazil, the 2026 reserve capacity auction contracted nearly 8.5 GW of LNG-fired thermal capacity, attracting an estimated BRL 48 billion (USD 9.6 billion) in investment to support new or expanded FSRU infrastructure across multiple states. In the Americas, Mexico's Yucatan deployment and JERA's Hawaii proposal highlight opportunities in both frontier and regulated systems where dispatchable power is required before onshore infrastructure becomes operational. In Europe, supply security remains a priority, with Congo LNG output reaching 3 million tonnes per year in early 2026, providing an additional floating supply source for utilities aiming to reduce reliance on Russian gas.
- Bumi Armada Berhad
- CMHI Haimen
- Damen Shipyards Group
- GE Vernova Inc.
- Golar Power
- Hanwha Ocean Co., Ltd.
- Karpowership
- Kawasaki Heavy Industries, Ltd.
- Seatrium Limited
- MAN Energy Solutions
- Mitsubishi Heavy Industries, Ltd.
- MODEC, Inc.
- Power Barge Corporation
- Samsung Heavy Industries Co., Ltd.
- Siemens Energy AG
- Tri-Yard Power Solutions
- TSUNEISHI Shipbuilding
- VARD
- Wartsila Oyj Abp
- Shanghai Zhenhua Heavy Industries Co., Ltd.
Additional Benefits:
- The market estimate (ME) sheet in Excel format
- 3 months of analyst support
TABLE OF CONTENTS
1 Introduction
- 1.1 Study Assumptions & Market Definition
- 1.2 Scope of the Study
2 Research Methodology
3 Executive Summary
4 Market Landscape
- 4.1 Market Overview
- 4.2 Market Drivers
- 4.2.1 Mainstream LNG-price advantage vs. diesel in island grids
- 4.2.2 IMO CII & EEXI pushing gas-fired marine assets
- 4.2.3 African gas-to-power tenders favour redeployable vessels
- 4.2.4 AI-driven load-balancing software unlocks hybrid barges
- 4.2.5 Ageing steam-turbine LNG carriers ripe for power-plant conversion
- 4.2.6 Modular cryogenic BOP packages cut barge CAPEX 25 %
- 4.3 Market Restraints
- 4.3.1 LNG shipping over-capacity keeps charter rates volatile
- 4.3.2 High methane-slip regulations threaten dual-fuel engines
- 4.3.3 Insurance premiums for cyclone-prone moorings
- 4.3.4 Limited berth availability at congested coal terminals
- 4.4 Supply-Chain Analysis
- 4.5 Regulatory Landscape
- 4.6 Technological Outlook
- 4.7 Porter's Five Forces Analysis
- 4.7.1 Threat of New Entrants
- 4.7.2 Bargaining Power of Buyers
- 4.7.3 Bargaining Power of Suppliers
- 4.7.4 Threat of Substitutes
- 4.7.5 Competitive Rivalry
5 Market Size & Growth Forecasts
- 5.1 By Type
- 5.1.1 Power Barge
- 5.1.2 Power Ship
- 5.2 By Power Capacity
- 5.2.1 less than 50 MW
- 5.2.2 51 - 200 MW
- 5.2.3 201 - 400 MW
- 5.2.4 more than 401 MW
- 5.3 By Application
- 5.3.1 Peak Power Supply
- 5.3.2 Base-Load Supply
- 5.3.3 Emergency / Disaster Relief
- 5.4 By End-user
- 5.4.1 Utilities & IPPs
- 5.4.2 Industrial (Mining, O&G, Desalination)
- 5.4.3 Commercial & Data-Centres
- 5.5 By Geography
- 5.5.1 North America
- 5.5.1.1 United States
- 5.5.1.2 Canada
- 5.5.1.3 Mexico
- 5.5.2 Europe
- 5.5.2.1 United Kingdom
- 5.5.2.2 Germany
- 5.5.2.3 France
- 5.5.2.4 Spain
- 5.5.2.5 Nordic Countries
- 5.5.2.6 Russia
- 5.5.2.7 Rest of Europe
- 5.5.3 Asia-Pacific
- 5.5.3.1 China
- 5.5.3.2 India
- 5.5.3.3 Japan
- 5.5.3.4 South Korea
- 5.5.3.5 Malaysia
- 5.5.3.6 Thailand
- 5.5.3.7 Indonesia
- 5.5.3.8 Vietnam
- 5.5.3.9 Australia
- 5.5.3.10 Rest of Asia-Pacific
- 5.5.4 South America
- 5.5.4.1 Brazil
- 5.5.4.2 Argentina
- 5.5.4.3 Colombia
- 5.5.4.4 Rest of South America
- 5.5.5 Middle East and Africa
- 5.5.5.1 United Arab Emirates
- 5.5.5.2 Saudi Arabia
- 5.5.5.3 South Africa
- 5.5.5.4 Egypt
- 5.5.5.5 Rest of Middle East and Africa
- 5.5.1 North America
6 Competitive Landscape
- 6.1 Market Concentration
- 6.2 Strategic Moves
- 6.3 Market Share Analysis
- 6.4 Company Profiles (includes Global level Overview, Market level overview, Core Segments, Financials as available, Strategic Information, Market Rank/Share for key companies, Products & Services, and Recent Developments)
- 6.4.1 Bumi Armada Berhad
- 6.4.2 CMHI Haimen
- 6.4.3 Damen Shipyards Group
- 6.4.4 GE Vernova Inc.
- 6.4.5 Golar Power
- 6.4.6 Hanwha Ocean Co., Ltd.
- 6.4.7 Karpowership
- 6.4.8 Kawasaki Heavy Industries, Ltd.
- 6.4.9 Seatrium Limited
- 6.4.10 MAN Energy Solutions
- 6.4.11 Mitsubishi Heavy Industries, Ltd.
- 6.4.12 MODEC, Inc.
- 6.4.13 Power Barge Corporation
- 6.4.14 Samsung Heavy Industries Co., Ltd.
- 6.4.15 Siemens Energy AG
- 6.4.16 Tri-Yard Power Solutions
- 6.4.17 TSUNEISHI Shipbuilding
- 6.4.18 VARD
- 6.4.19 Wartsila Oyj Abp
- 6.4.20 Shanghai Zhenhua Heavy Industries Co., Ltd.
7 Market Opportunities & Future Outlook
- 7.1 White-space & Unmet-Need Assessment