

|
시장보고서
상품코드
2073624
미국의 전기 버스 시장 : 점유율 분석, 업계 동향과 통계, 성장 예측(2026-2031년)United States Electric Bus - Market Share Analysis, Industry Trends & Statistics, Growth Forecasts (2026 - 2031) |
||||||
 Mordor Intelligence
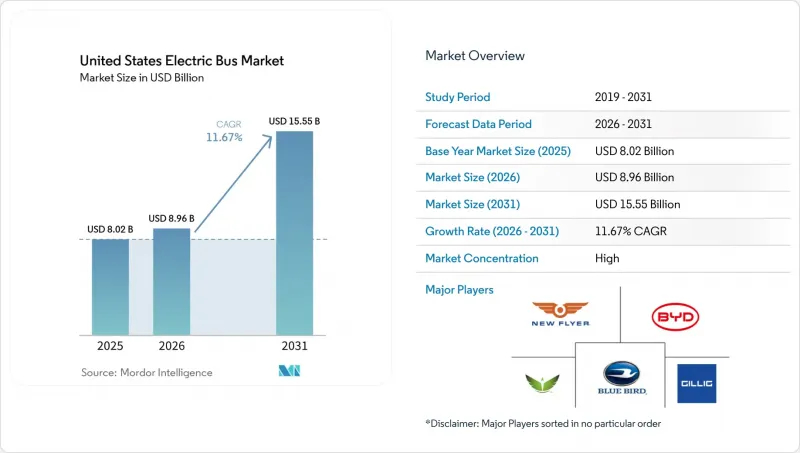
Mordor Intelligence에 의하면, 미국 전기 버스 시장 규모는 2025년에 80억 2,000만 달러로 평가되었고 2026년 89억 6,000만 달러에서 2031년까지 155억 5,000만 달러로 확대되어 동기 중 CAGR은 11.67%를 나타낼 전망입니다.
본 보고서는 추진 방식(배터리식 전기 버스 등), 용도(도시·대중교통 등), 배터리 화학 조성(LFP 등), 전장(9미터 미만 등), 모터 구조(PMSM 등), 모터 출력(100kW 미만 등), 주행 거리(100킬로미터 미만 등), 최종 용도(공공·민간), 주별로 분류되어 있습니다. 시장 전망은 가치(단위) 및 수량(단위)의 관점에서 제시되어 있습니다.
미국 전기 버스 시장 동향과 인사이트
연방 및 주 차원의 제로 배출 의무화
캘리포니아주의 “혁신적인 친환경 대중교통(Innovative Clean Transit)” 규정에 따라 대규모 기관은 2029년 초부터 제로 배출 버스만을 조달해야 할 의무가 있으며, 이로 인해 기존의 교체 주기가 단축되어 공급업체 입장에서 수요 전망이 명확해졌습니다. 이에 따라 차량 관리 담당자는 인프라 설계를 가속화하여, 전력 설비 업그레이드, 충전기 선정 및 직원 교육이 모두 차량 입찰과 병행하여 진행될 수 있도록 하고 있습니다. 뉴욕주, 워싱턴주, 매사추세츠주도 유사한 규제 모델을 채택하고 있어, 제조업체들은 일회성 로트 생산이 아닌 수년에 걸친 생산 계획을 수립할 자신감을 얻고 있습니다. 대부분의 규제가 국산 부품 사용을 우선시하고 있기 때문에 배터리 팩, 모터, 와이어 하네스를 현지에서 생산하는 제조업체는 “바이 아메리카” 인증 취득을 위한 로드맵이 더욱 명확해집니다. 이러한 규제들이 맞물리면서 전미적인 조달 붐이 일고 있으며, 미국 전기 버스 시장의 성장세가 확고해지고 있습니다.
연방 대중교통 전기화 자금
EPA의 “깨끗한 스쿨버스”리베이트나 FTA의 “저배출·무배출”보조금은 특히 보증 능력이 부족한 기관에서 정책의 의도를 공식 발주서로 전환시키고 있습니다. 보조금 심사에서는 즉시 착공이 가능한 인프라가 우대되는 경향이 있기 때문에 입찰자들은 자산의 유휴화를 피하기 위해 버스 납품과 충전기 가동을 동시에 진행하는 경우가 많습니다. 공급업체가 차량, 차고 설계 및 장기 유지보수를 단일 계약으로 통합하는 사례가 늘어나고 있으며, 이를 통해 기관의 감독 업무가 간소화되는 동시에 부품의 안정적인 공급이 보장됩니다. 연방 정부의 지속적인 예산 배분 전망 또한 대출 기관에 안도감을 주며, 나머지 자본 지출에 대해 경쟁력 있는 금리를 가능하게 하고 있습니다. 이러한 재정적 수단들이 결합되어, 과거에는 조기 도입을 주저하게 만들었던 리스크 프리미엄을 낮추고 있습니다.
차고지 계통 연계 지연
도시 지역의 전력 회사에서 계통 연계 대기 시간은 종종 차고지 자체의 건설 기간보다 길기 때문에 당국은 버스를 단계적으로 인도하거나 임시 충전 설비를 임대할 수밖에 없습니다. 프로젝트 매니저는 설비의 유휴화를 방지하기 위해 시의 인허가, 전력회사의 설계, 도급업체의 일정을 외과 수술 수준의 정밀도로 조정해야 합니다. 유틸리티 부문의 인력 부족은 추가적인 불확실성을 야기하고 있으며, 특히 동일 지역 내의 여러 차고가 동시에 현대화 작업을 진행할 때 이러한 현상이 두드러집니다. 일부 지자체에서는 피크 수요를 완화하기 위해 현장형 축전지를 설치함으로써 지연 위험을 줄이고 있지만, 그 대신 자본 집약도가 높아지게 됩니다. 전력회사의 처리 절차가 신속해질 때까지, 계통 연계는 많은 도입 계획에서 여전히 병목 현상이 되는 요소입니다.
부문별 분석
2025년, 미국 전기 버스 시장 점유율에서 배터리 방식이 72.16%를 차지했으나, 캘리포니아주 이외의 지역으로도 수소 충전소가 확대됨에 따라 연료전지 방식은 연평균 성장률(CAGR) 24.24%로 성장할 것으로 전망됩니다. 사우스 코스트 에어 베이슨 지역에서의 초기 도입 실적을 통해, 장시간 충전 대기 없이 300마일의 운행 주기가 가능함이 입증되었으며, 산악 지대나 한랭 지역에서의 운행에 적합합니다. 각 기관은 배터리 구동 차량이 도시 지역 수요 대부분을 충족시키고 있음을 인식하고 있지만, 연료전지차의 주행 거리와 10분 충전 시간은 디젤 차량의 운행 패턴과 유사하여 운전자의 일정 관리를 용이하게 하고 있습니다. 각 제조업체들은 “바이 아메리카” 규정을 충족하기 위해 스택 조립을 현지화하고 있지만, 광범위한 보급을 실현하기 위해서는 그린 수소 공급 비용을 더욱 낮춰야 합니다.
혼합 차량 도입을 시범적으로 추진하고 있는 교통 당국은 예측 가능한 도심 순환 노선에는 배터리 버스를, 급행 노선이나 지형적으로 험한 노선에는 연료전지 버스를 배정하는 데 운영상의 가치를 발견하고 있습니다. 전국 수소 허브 프로그램을 통해 80억 달러가 생산 및 물류 분야에 투입됨에 따라, 이 기술이 디젤 차량과 동등한 경쟁력을 갖추기까지의 과정은 개선되고 있으나, 인프라 구축 일정에 따라 수요 증가는 예측 기간 후반으로 미뤄질 전망입니다. 공통된 저장 및 안전 기준의 통합으로 인해 인허가 절차상의 마찰이 완화됨에 따라, 수소는 미국 전기 버스 시장에서 시장 점유율을 확대하기 위한 현실적인 수단이 되고 있습니다.
2025년 매출의 62.75%는 지속적인 보조금 유입과 명확한 입법 목표의 혜택을 받은 도시 및 대중교통 차량이 차지했습니다. 한편, 도시 간 및 지역 노선은 연평균 성장률(CAGR) 16.02%로 성장을 지속하고, 있습니다. 이는 배터리의 에너지 밀도 덕분에 현재 300-450km 주행이 가능해졌으며, 전력 회사들이 도로변의 메가와트급 충전 시설에 공동 출자하고 있기 때문입니다. 새크라멘토-리노 구간 및 댈러스-휴스턴 구간에서 진행된 초기 회랑 구축은 30분의 충전 시간이 운전자의 휴식 시간과 일치함으로써 운행 일정의 유연성을 입증하고 있습니다. 학군은 EPA의 리베이트를 신속하게 활용하고 있지만, 소유 형태의 분산화로 인해 공중보건 측면에서 강력한 설득력을 가지고 있음에도 불구하고 전국적인 규모 확대는 더딘 임베디드니다.
공항이나 기업 캠퍼스에서는 스코프 1 배출 감축 공약을 달성하기 위해 제로 배출 셔틀버스가 도입되어 있으며, 지자체의 정책 목표를 뒷받침하는 눈에 띄는 모범 사례로서의 역할을 하고 있습니다. 장거리 버스 사업자들은 겨울철 주행 거리와 재판매 가치가 안정될 때까지 신중한 태도를 유지하고 있지만, 대용량 배터리를 탑재한 버스를 활용한 시범 프로그램을 통해 고급 관광 노선에서 경제성을 달성할 수 있음이 시사되고 있습니다. 이러한 다양한 이용 사례들이 복합적으로 어우러져 미결 주문량을 뒷받침하고 있으며, 각 OEM 업체들이 미국 전기 버스 시장의 모든 규모에 걸쳐 플랫폼 투자 비용을 상각하는 데 도움이 되고 있습니다.
리튬철인산염 배터리는 니켈계 배터리에 비해 열적 안정성과 비용 면에서 우위를 점하고 있어, 2025년 미국 전기 버스 시장에서 59.21%의 점유율을 유지했습니다. 리튬 티타네이트 배터리의 연평균 성장률(CAGR) 18.78%는 10분 급속 충전 기능과, 야외 야간 주차 시 영하의 환경에서도 견고한 성능을 중시하는 미네소타주, 일리노이주 및 뉴욕주 북부의 각 기관에 의한 것입니다. 니켈·망간·코발트 배터리는 에너지 밀도가 비용을 상회하는 장거리 코치에 국한된 상태입니다.
나트륨 이온 전지 및 전고체 전지의 시범 사업은 미국 에너지부(DOE)의 지원금에 힘입어 계속되고 있으나, 2028년까지는 양산 규모에 영향을 미치지 않을 것으로 보입니다. 밸류체인의 현지화를 위한 노력의 일환으로 중서부 지역에 새로운 LFP(인산철 리튬) 배터리 공장이 가동을 시작했으며, 이를 통해 관세 위험이 완화되고 보조금 수혜 자격도 강화되고 있습니다. 한편, 미국 환경보호청(EPA)이 마련 중인 폐배터리 처리 정책은 ‘세컨드 라이프’로서 고정형 에너지 저장 장치로의 활용을 촉진하고 있으며, 과거 예산에 민감했던 지자체들의 조달을 가로막았던 잔존 가치에 대한 위험을 줄이고 있습니다.
기타 혜택:
- 엑셀 형식 시장 예측(ME) 시트
- 3개월간의 애널리스트 지원
자주 묻는 질문
목차
제1장 서론
제2장 조사 방법
제3장 주요 요약
제4장 시장 배경과 구조적 요인
제5장 시장 구도
제6장 시장 규모와 성장 예측
제7장 경쟁 구도
제8장 시장 기회와 향후 전망
제9장 CEO가 직면하는 중요 전략적 과제
JHS 26.07.07According to Mordor Intelligence, the united states electric bus market size was valued at USD 8.02 billion in 2025 and is projected to grow from USD 8.96 billion in 2026 to USD 15.55 billion by 2031, registering a CAGR of 11.67% over the same period.
This report is Segmented by Propulsion (Battery Electric and More), Application (City / Transit and More), Battery Chemistry (LFP and More), Length (Below 9 M and More), Motor Architecture (PMSM and More), Motor Power (Below 100 KW and More), Range (Below 100 Km and More), End Use (Public and Private), and State. The Market Forecasts are Provided in Terms of Value (Units) and Volume (Units).
United States Electric Bus Market Trends and Insights
Federal and State Zero-Emission Mandates
California's Innovative Clean Transit rule obliges large agencies to procure only zero-emission buses from the beginning of 2029, compressing traditional replacement cycles and raising demand visibility for suppliers. Fleet managers respond by accelerating infrastructure design so that utility upgrades, charger selection, and workforce training all proceed in parallel with vehicle tenders. New York, Washington, and Massachusetts mirror the regulatory template, giving manufacturers confidence to plan multiyear production slots instead of one-off batches. Because most rules favor domestic content, builders who localize battery packs, motors, and wiring harnesses enjoy clearer paths through Buy America certification. The cumulative effect of those mandates is a nationwide procurement wave that locks in the United States electric bus market's growth trajectory.
Federal Transit Electrification Funding
EPA Clean School Bus rebates and FTA Low-No grants convert policy intent into signed purchase orders, particularly for agencies that lack bonding capacity. Grant scoring tends to reward shovel-ready infrastructure, so bidders often align bus deliveries with charger commissioning to avoid stranded assets. Suppliers increasingly bundle vehicles, depot design, and long-term maintenance in a single contract, simplifying agency oversight while guaranteeing parts availability. The promise of continued federal appropriations also reassures lenders, enabling competitive interest rates on any remaining capital outlay. Together, those financial levers reduce the risk premium that once discouraged early movers.
Depot Grid-Connection Delays
Interconnection queues at urban utilities often exceed the construction timeline for the depot itself, forcing agencies to stage bus deliveries or lease temporary charging assets. Project managers must coordinate city permitting, utility engineering, and contractor schedules with near-surgical precision to avoid idle equipment. Staffing constraints at public-works departments add further uncertainty, especially when multiple depots in the same region pursue upgrades simultaneously. Some agencies mitigate delay risk by installing on-site battery storage that buffers peak demand, yet doing so raises capital intensity. Until utility processes speed up, grid access remains a gating item for many rollouts.
Other drivers and restraints analyzed in the detailed report include:
- Declining Battery-Pack Prices
- TCO Parity for City Routes by 2026
- Sparse High-Power Charging Network
For complete list of drivers and restraints, kindly check the Table Of Contents.
Segment Analysis
Battery-electric buses retained a 72.16% United States electric bus market share in 2025, yet fuel-cell variants are forecast to grow at a 24.24% CAGR as hydrogen stations extend beyond California. Early deployments in the South Coast Air Basin validate 300-mile duty cycles without lengthy charge dwell, appealing to mountainous or cold-weather operations. Agencies recognize that battery units cover most urban needs, but fuel-cell range and 10-minute refueling closely replicate diesel patterns, easing driver scheduling. Manufacturers localize stack assembly to meet Buy America rules, although green-hydrogen supply costs must still fall to unlock broad adoption.
Transit authorities experimenting with blended fleets see operational value in assigning battery buses to predictable urban loops and reserving fuel-cell units for express or terrain-intensive routes. As the national hydrogen-hub program channels USD 8 billion into production and logistics, the technology's path to parity improves, but infrastructure timelines push material volume to the latter half of the forecast period. Integration of common storage and safety codes reduces permitting friction, making hydrogen a realistic lever for segment expansion in the United States electric bus market.
City and transit fleets accounted for 62.75% of 2025 revenue, benefiting from continuous grant flows and clear legislative targets. Yet intercity and regional routes post a 16.02% CAGR because battery densities now support 300-450 km operations, and utilities co-fund roadside megawatt charging. Initial corridor build-outs between Sacramento-Reno and Dallas-Houston demonstrate timetable resilience when 30-minute top-ups align with driver breaks. School districts rapidly absorb EPA rebates, but fragmented ownership slows national scaling despite strong public health narratives.
Airports and corporate campuses deploy zero-emission shuttles to meet Scope 1 reduction pledges, serving as visible showcases that reinforce municipal policy ambitions. Coach operators remain cautious until winter-range performance and resale values stabilize, yet pilot programs with extended-pack buses suggest achievable economics on premium tourist routes. The diverse use-case mosaic sustains order backlogs, helping OEMs amortize platform investments across the United States electric bus market size spectrum.
Lithium-iron-phosphate batteries maintained a 59.21% United States electric bus market share in 2025, owing to thermal stability and cost advantages over nickel chemistries. Lithium-titanate's 18.78% CAGR comes from agencies in Minnesota, Illinois, and upstate New York that prize 10-minute charge capability and robust sub-zero performance for overnight outdoor parking. Nickel-manganese-cobalt remains constrained to long-range coaches where energy density outweighs cost.
Sodium-ion and solid-state pilots continue under DOE grants, but will not affect volume before 2028. Supply-chain localization efforts bring new LFP cell plants online in the Midwest, mitigating tariff exposure and strengthening grant eligibility. Meanwhile, battery-end-of-life policies under development by the EPA encourage second-life stationary storage, lowering residual-value risk that once stymied procurements in budget-sensitive municipalities.
Complete Report Scope:
- By Propulsion
- Battery Electric Bus (BEB)
- Plug-in Hybrid Electric Bus (PHEB)
- Fuel Cell Electric Bus (FCEB)
- By Application
- City/Transit
- Intercity/Regional
- Coach/Tourist
- School Bus
- Airport
- Others
- By Battery Chemistry
- Lithium Iron Phosphate (LFP)
- NMC/NCA
- Lithium Titanate (LTO)
- Others (Sodium-ion, pilots)
- By Length
- Below 9 m
- 9 to 14 m
- 14 to 18 m
- Above 18 m
- By Motor Architecture
- Permanent Magnet Synchronous Motor (PMSM)
- Induction/Asynchronous AC
- Switched Reluctance Motor (SRM)
- Others
- By Motor Power
- Below 100 kW
- 100 to 150 kW
- 151 to 200 kW
- 201 to 250 kW
- 251 to 320 kW
- Above 320 kW
- By Range
- Below 100 km
- 100 to 200 km
- 201 to 300 km
- 300 to 450 km
- Above 450 km
- By End Use
- Public
- Private
- By State
- Alabama
- Alaska
- Arizona
- Arkansas
- California
- Colorado
- Connecticut
- Delaware
- Florida
- Georgia
- Hawaii
- Idaho
- Illinois
- Indiana
- Iowa
- Kansas
- Kentucky
- Louisiana
- Maine
- Maryland
- Massachusetts
- Michigan
- Minnesota
- Mississippi
- Missouri
- Montana
- Nebraska
- Nevada
- New Hampshire
- New Jersey
- New Mexico
- New York
- North Carolina
- North Dakota
- Ohio
- Oklahoma
- Oregon
- Pennsylvania
- Rhode Island
- South Carolina
- South Dakota
- Tennessee
- Texas
- Utah
- Vermont
- Virginia
- Washington
- West Virginia
- Wisconsin
- Wyoming
List of Companies Covered in this Report:
- New Flyer of America
- BYD Auto Co. Ltd.
- GILLIG LLC
- Blue Bird Corporation
- Lion Electric Co.
- Daimler Truck Holding AG (Thomas Built)
- REV Group Inc. (ENC)
- Volvo Group (Nova Bus)
- GreenPower Motor Co. Inc.
- Phoenix Motorcars
- Vicinity Motor Corp.
- Cummins Inc. (Battery & Fuel-Cell)
- Van Hool NV
- TEMSA Skoda USA
- Alexander Dennis Ltd.
- Complete Coach Works (CCW)
Additional Benefits:
- The market estimate (ME) sheet in Excel format
- 3 months of analyst support
TABLE OF CONTENTS
1 Introduction
- 1.1 Study Assumptions and Market Definition
- 1.2 Scope of the Study
- 1.3 Glossary of Key Terms
2 Research Methodology
3 Executive Summary
4 Market Context and Structural Factors
- 4.1 Urbanization, Population and Transit Demand
- 4.2 Public Transport Share and Mode Shift
- 4.3 Diesel vs Electricity/Hydrogen Price Spread
- 4.4 Vehicle and Infrastructure CAPEX / OPEX
- 4.5 Financing Models
- 4.6 Bus Specs and Vehicle Standards
- 4.7 Charging Stations and Charging Topology
- 4.8 Hydrogen Stations Serving Buses
- 4.9 Subsidy/Incentive Value
- 4.10 OEM Line-up and Model Pipeline
- 4.11 Regulatory Framework
- 4.12 Vehicle Homologation and Safety
- 4.13 Procurement and Contracting Rules
- 4.14 Fiscal and Industrial Policy (Incentives, Duties, Localization, EPR)
5 Market Landscape
- 5.1 Market Overview
- 5.2 Market Drivers
- 5.2.1 Federal and State Zero-Emission Mandates
- 5.2.2 Federal Transit Electrification Funding
- 5.2.3 Declining Battery-Pack Prices
- 5.2.4 TCO Parity for City Routes by 2026
- 5.2.5 School-Fleet Health-Driven Adoption
- 5.2.6 Carbon-Credit Revenue Streams
- 5.3 Market Restraints
- 5.3.1 Depot Grid-Connection Delays
- 5.3.2 Sparse High-Power Charging Network
- 5.3.3 High Upfront FCEB Cost
- 5.3.4 Limited Hydrogen Corridors
- 5.4 Value/Supply-Chain Analysis
- 5.5 Technological Outlook
- 5.6 Porter's Five Forces
- 5.6.1 Threat of New Entrants
- 5.6.2 Bargaining Power of Suppliers
- 5.6.3 Bargaining Power of Buyers
- 5.6.4 Threat of Substitutes
- 5.6.5 Competitive Rivalry
6 Market Size and Growth Forecasts (Value (USD) and Volume (Units))
- 6.1 By Propulsion
- 6.1.1 Battery Electric Bus (BEB)
- 6.1.2 Plug-in Hybrid Electric Bus (PHEB)
- 6.1.3 Fuel Cell Electric Bus (FCEB)
- 6.2 By Application
- 6.2.1 City/Transit
- 6.2.2 Intercity/Regional
- 6.2.3 Coach/Tourist
- 6.2.4 School Bus
- 6.2.5 Airport
- 6.2.6 Others
- 6.3 By Battery Chemistry
- 6.3.1 Lithium Iron Phosphate (LFP)
- 6.3.2 NMC/NCA
- 6.3.3 Lithium Titanate (LTO)
- 6.3.4 Others (Sodium-ion, pilots)
- 6.4 By Length
- 6.4.1 Below 9 m
- 6.4.2 9 to 14 m
- 6.4.3 14 to 18 m
- 6.4.4 Above 18 m
- 6.5 By Motor Architecture
- 6.5.1 Permanent Magnet Synchronous Motor (PMSM)
- 6.5.2 Induction/Asynchronous AC
- 6.5.3 Switched Reluctance Motor (SRM)
- 6.5.4 Others
- 6.6 By Motor Power
- 6.6.1 Below 100 kW
- 6.6.2 100 to 150 kW
- 6.6.3 151 to 200 kW
- 6.6.4 201 to 250 kW
- 6.6.5 251 to 320 kW
- 6.6.6 Above 320 kW
- 6.7 By Range
- 6.7.1 Below 100 km
- 6.7.2 100 to 200 km
- 6.7.3 201 to 300 km
- 6.7.4 300 to 450 km
- 6.7.5 Above 450 km
- 6.8 By End Use
- 6.8.1 Public
- 6.8.2 Private
- 6.9 By State
- 6.9.1 Alabama
- 6.9.2 Alaska
- 6.9.3 Arizona
- 6.9.4 Arkansas
- 6.9.5 California
- 6.9.6 Colorado
- 6.9.7 Connecticut
- 6.9.8 Delaware
- 6.9.9 Florida
- 6.9.10 Georgia
- 6.9.11 Hawaii
- 6.9.12 Idaho
- 6.9.13 Illinois
- 6.9.14 Indiana
- 6.9.15 Iowa
- 6.9.16 Kansas
- 6.9.17 Kentucky
- 6.9.18 Louisiana
- 6.9.19 Maine
- 6.9.20 Maryland
- 6.9.21 Massachusetts
- 6.9.22 Michigan
- 6.9.23 Minnesota
- 6.9.24 Mississippi
- 6.9.25 Missouri
- 6.9.26 Montana
- 6.9.27 Nebraska
- 6.9.28 Nevada
- 6.9.29 New Hampshire
- 6.9.30 New Jersey
- 6.9.31 New Mexico
- 6.9.32 New York
- 6.9.33 North Carolina
- 6.9.34 North Dakota
- 6.9.35 Ohio
- 6.9.36 Oklahoma
- 6.9.37 Oregon
- 6.9.38 Pennsylvania
- 6.9.39 Rhode Island
- 6.9.40 South Carolina
- 6.9.41 South Dakota
- 6.9.42 Tennessee
- 6.9.43 Texas
- 6.9.44 Utah
- 6.9.45 Vermont
- 6.9.46 Virginia
- 6.9.47 Washington
- 6.9.48 West Virginia
- 6.9.49 Wisconsin
- 6.9.50 Wyoming
7 Competitive Landscape
- 7.1 Market Concentration
- 7.2 Strategic Moves
- 7.3 Market Share Analysis
- 7.4 Company Profiles (includes Global level Overview, Market level overview, Core Segments, Financials, Strategic Information, Market Rank/Share, Products and Services, Recent Developments)
- 7.4.1 New Flyer of America
- 7.4.2 BYD Auto Co. Ltd.
- 7.4.3 GILLIG LLC
- 7.4.4 Blue Bird Corporation
- 7.4.5 Lion Electric Co.
- 7.4.6 Daimler Truck Holding AG (Thomas Built)
- 7.4.7 REV Group Inc. (ENC)
- 7.4.8 Volvo Group (Nova Bus)
- 7.4.9 GreenPower Motor Co. Inc.
- 7.4.10 Phoenix Motorcars
- 7.4.11 Vicinity Motor Corp.
- 7.4.12 Cummins Inc. (Battery & Fuel-Cell)
- 7.4.13 Van Hool NV
- 7.4.14 TEMSA Skoda USA
- 7.4.15 Alexander Dennis Ltd.
- 7.4.16 Complete Coach Works (CCW)
8 Market Opportunities and Future Outlook
- 8.1 White-Space and Unmet-Need Assessment


