|
시장보고서
상품코드
2073649
그린 물류 시장 : 점유율 분석, 업계 동향과 통계, 성장 예측(2026-2031년)Green Logistics - Market Share Analysis, Industry Trends & Statistics, Growth Forecasts (2026 - 2031) |
||||||
 Mordor Intelligence
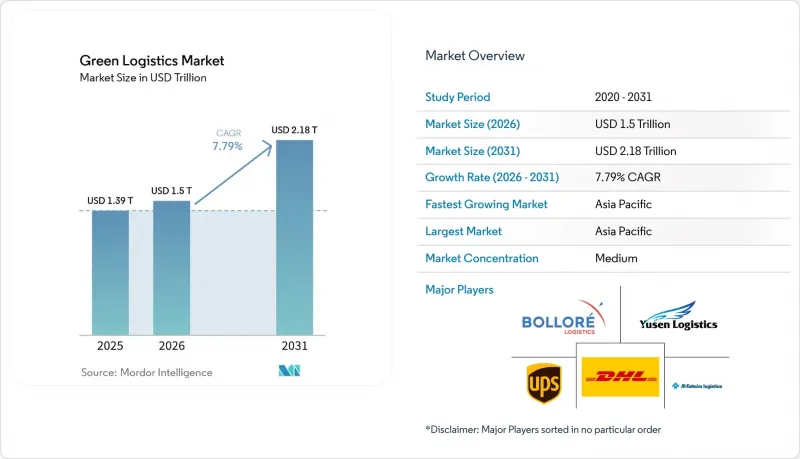
Mordor Intelligence에 의하면, 그린 물류 시장 규모는 2025년에 1조 3,900억 달러로 평가되었고 2026년 1조 5,000억 달러에서 2031년까지 2조 1,800억 달러에 이를 것으로 예측되며, 예측 기간(2026-2031년) CAGR은 7.79%를 나타낼 전망입니다.
본 보고서에서는 업계를 최종 사용자별(소매 및 전자상거래, 제조·산업, 자동차, 의료 및 제약, 식품 및 음료 등), 서비스 유형별(창고·보관, 운송, 부가가치 서비스), 그리고 지역별(북미, 남미, 아시아태평양, 유럽, 중동 및 아프리카)로 분류하고 있습니다. 시장 전망은 금액(달러) 기준으로 제시되어 있습니다.
세계 그린 물류 시장 동향과 인사이트
공급망 전반에 걸쳐 탄소 중립 의무화가 더욱 엄격해지고 있습니다.
EU의 “기업 지속가능성 보고 지침”와 캘리포니아주의 “선진 청정 트럭 규제” 등의 공개 의무로 인해 화주들은 입찰에 탄소 배출 기준을 반영할 수밖에 없게 되었으며, 인증된 저탄소 서비스에 대한 수요가 가속화되고 있습니다. DHL은 이미 2030년까지 지속 가능한 항공 연료(SAF) 혼합 비율을 30%로 높이는 것을 목표로 하고 있으며, UPS는 2050년까지 모든 차량의 탄소 중립화를 계획하고 있습니다. 현재 조달 담당자들은 물류 예산의 최대 3%를 규정 준수 관련 탈탄소화 프로젝트에 배정하고 있으며, 배출량 실적이 계약 수주의 차별화 요인으로 작용하고 있습니다. 감사에 대응할 수 있는 데이터를 제시할 수 있는 공급업체는 특히 EU와 미국 간 무역 노선에서 노선 계약 확보에 있어 선점 우위를 누리고 있습니다. 신뢰할 수 있는 로드맵을 제시하지 못하는 운송업체는 빠르면 2027년에 우선 공급업체 목록에서 제외될 위험이 있습니다.
전자상거래의 급속한 성장이 저탄소 라스트 마일 솔루션을 가속화하고 있습니다.
소포 처리량이 급증함에 따라 배출량이 인구 밀집 도시 지역에 집중되고 있으며, 지자체에서는 제로 배출 구역 및 정체 요금 제도를 도입하고 있습니다. AI를 활용한 전기 밴의 경로 최적화를 통해 유럽의 대도시에서는 배송 시간이 15-20% 단축되는 동시에, CO2 배출량을 최대 40%까지 줄이는 데 성공했습니다. 마스(Mars) 등 소매업체들은 Einride사와 공동으로 300대의 클래스 8 전기 트럭 도입 자금을 조달하고 있으며, 2030년까지 연간 2만 톤의 배출량 감축을 목표로 하고 있습니다. 소비자들의 할증 요금에 대한 지불 의향은 여전히 저조하지만, 규제상의 인센티브와 브랜드의 노력 덕분에 “친환경 배송”는 그린 물류 시장에서 표준적인 선택지로 자리 잡고 있습니다.
제로 배출 차량 및 인프라에 대한 막대한 초기 투자
배터리식 전기 트럭의 구매 비용은 대당 7만-11만 3,000달러 수준이지만, 전용 전기 도로 프로젝트의 경우 메가와트급 충전기의 비용이 1킬로미터당 310만 달러를 초과하기도 합니다. 소규모 운송업체는 자금 조달이 어려우며, 잔존 가치에 대한 불확실성이 여전히 재판매를 기반으로 한 자금 조달 모델을 저해하고 있습니다. 운영 비용 절감 효과는 시간이 지남에 따라 누적되지만, 단기적인 현금 흐름의 부족으로 인해 녹색 금융 제도가 제대로 갖춰지지 않은 신흥국에서 대규모 도입이 저해되고 있습니다.
부문별 분석
2025년 기준으로, 제조 및 산업 분야의 화주들은 그린 물류 시장의 26.20%를 차지하고 있으며, 이는 수십 년에 걸친 규정 준수 문화와 배출량 감사를 간소화하는 예측 가능한 운송 패턴이 반영된 결과입니다. 이러한 기업들에 정착된 공급업체 평가 시스템을 통해 화물 예산은 자산 기반의 탈탄소화 로드맵을 갖춘 공급업체에 배분되며, 시장 점유율 우위가 더욱 공고해지고 있습니다. 에너지 집약형 공장에서는 수년에 걸쳐 탄소 배출 감축을 약속하는 재생 가능 전력과 전기 트럭을 결합한 통합 패키지에 대한 협상이 점점 더 늘어나고 있습니다. 소매 및 전자상거래 분야는 현재 규모는 작지만, 도시 지역의 마이크로 풀필먼트 센터와 대도시권 내 제로 배출 배송 시간대 의무화 조치의 뒷받침을 받아 연평균 성장률(CAGR) 17.35%로 성장하고 있습니다. 반품량 증가와 사업자가 “무료”배송 비용을 내부화해 나감에 따라, 전자상거래 화물의 그린 물류 시장 규모는 급격히 확대될 전망입니다. 한편, 각 자동차 제조업체들은 차량 1대당 물류 배출량을 40% 감축하기 위해 전기차 전용 운송 차량의 시범 도입을 추진하고 있습니다. 또한, 헬스케어 관련 기업들은 탄소 집약도를 높이지 않으면서 콜드체인의 무결성을 확보하기 위해 지속 가능한 항공 연료(SAF) 회랑에 공동 투자하고 있습니다.
전기자동차의 보급률, 표준화된 팔레트, 디지털화된 선하증권 시스템 덕분에 제조업체는 “제조부터 공장 출하까지”의 탄소 발자국을 시각화할 수 있어 지속적인 최적화가 가능해집니다. 반면, 전자상거래 사업자들은 AI를 활용해 택배 보관함, 자전거 택배, 다크 스토어 네트워크를 통합적으로 운영함으로써 배송 실패를 방지하고 있습니다. 이 두 모델은 배출량 추적을 경쟁력 있는 조달 변수로 전환하는 데이터 중심의 성과 대시보드를 통해 통합되어 있으며, 다양한 최종 사용자가 그린 물류 시장의 성장을 어떻게 가속화하고 있는지를 보여줍니다.
지역별 분석
APAC 지역은 2025년에 매출 점유율 36.65%를 기록하며 그린 물류 시장을 주도하고 있으며, 2031년까지 연평균 성장률(CAGR) 8.62%로 가장 빠르게 성장하고 있습니다. 중국에서는 전국 규모의 그린 화물 운송 회랑과 클래스 8 전기 트럭에 대한 보조금 덕분에 차량 교체 속도가 빨라지고 있습니다. 한편, 인도는 새로 조성된 산업단지를 활용하여 건설 초기부터 옥상 태양광 발전 시설과 전기차 충전 설비를 도입하고 있습니다. 일본은 화물 철도의 현대화를 지속하고 모달 시프트 프로그램을 확대함으로써 고속도로의 교통 체증을 완화하고 물류 분야의 이산화탄소 배출량을 줄이고 있습니다. 동남아시아 국가들은 기술 이전을 활용하고, 배터리 교체 및 마이크로그리드 솔루션을 항만 확장 사업에 통합함으로써 기존 인프라를 비약적으로 발전시키고 있습니다.
북미는 여전히 지역별 기여도 2위를 유지하고 있으며, 2040년까지 트럭 판매량의 100%를 무공해 차량(ZEV)으로 전환하겠다는 미국의 연방 목표와, 클래스 7·8 전기 트럭의 구매 비용을 대폭 절감해 주는 세액 공제 혜택에 힘입고 있습니다. 캘리포니아주의 “첨단 청정 트럭 규정(Advanced Clean Truck rule)”는 이미 자동차 제조업체들에게 단계적으로 인상되는 ZEV 판매 할당량 달성을 의무화하고 있으며, I-5 및 I-10 회랑 전역에 충전 허브를 조기에 구축하도록 추진하고 있습니다. 캐나다에서는 2024년 6월에 시행될 그린워싱 방지법에 따라 오해를 불러일으키는 환경 주장에 대해 최대 1,000만 캐나다 달러의 벌금이 부과될 예정이며, 운송 사업자들은 감사에 대응할 수 있는 정보 공개를 요구받고 있습니다. 한편, 멕시코에서는 남북 무역 루트에 대한 배출 기준을 통일하는 ‘그린 보더” 프로그램을 추진하고 있습니다.
유럽은 탄소 가격 책정, eHighway 시범 사업, 2030년까지 대형 트럭의 CO2 배출량을 43% 감축해야 하는 의무화 조치 등 세계에서 가장 정교한 정책 조합을 갖추고 있어, 무공해 화물 운송이 규제적 확실성을 확보하고 있습니다. 스웨덴의 전기 도로 구간은 2025년에 50km 이상으로 확대될 예정이며, 그 운영 실적 데이터가 독일의 전국 확대에 대한 지침이 되고 있습니다. 물류 기업들은 사업 지속을 위한 조건으로 저탄소 차량을 도입하고 있습니다. CEVA가 전기 트럭 23대를 추가로 도입함으로써 연간 3만 8,300톤의 CO2 배출을 감축하고 있으며, 통합된 충전 네트워크가 가동 시간을 확보해 주고 있습니다. 동유럽의 운송 노선은 인프라 측면에서 뒤처져 있지만, ‘그린 회랑’에 배정된 EU 결속 기금의 지원을 받고 있어, 금세기 말까지 통합이 진행될 전망입니다.
중동 및 아프리카는 아직 발전의 초기 단계에 있지만, 급속히 변화하고 있습니다. UAE의 ‘넷 제로 2050 전략”는 제벨 알리에서 태양광 발전을 활용한 물류 단지를 지원하고 있으며, 사우디아라비아는 그린 수소 시범 사업을 리야드-제다 회랑에서의 화물 운송 시험과 연계하고 있습니다. 남아프리카공화국의 탄소세는 운송업체들이 바이오디젤 혼합 연료로 전환하도록 장려하고 있지만, 전력망의 신뢰성과 관련된 문제가 차량의 광범위한 전기화를 지연시키고 있습니다. 전반적으로 지역별 상황이 다양하기 때문에 지역별 정책 인센티브, 인프라 구축 현황, 산업 기반이 도입 속도를 좌우하지만, 각 지역에서는 현재 그린 물류 시장에서 되돌릴 수 없는 기세를 보여주는 핵심 프로젝트가 전개되고 있습니다.
기타 혜택:
- 엑셀 형식 시장 예측(ME) 시트
- 3개월간의 애널리스트 지원
자주 묻는 질문
목차
제1장 서론
제2장 조사 방법
제3장 주요 요약
제4장 시장 구도
제5장 시장 규모와 성장 예측
제6장 경쟁 구도
제7장 시장 기회와 향후 전망
JHS 26.07.07According to Mordor Intelligence, the green logistics market size was valued at USD 1.39 trillion in 2025 and estimated to grow from USD 1.5 trillion in 2026 to reach USD 2.18 trillion by 2031, at a CAGR of 7.79% during the forecast period (2026-2031).
This report Segments the Industry Into by End User (Retail and E-Commerce, Manufacturing & Industrial, Automotive, Healthcare & Pharmaceuticals, Food & Beverages, and More), by Service Type (Warehousing & Storage, Transportation, and Value-Added Services), and by Geography (North America, South America, Asia-Pacific, Europe, and Middle East & Africa). The Market Forecasts are Provided in Terms of Value (USD).
Global Green Logistics Market Trends and Insights
Net-zero mandates tightening across supply chains
Mandatory disclosure rules such as the EU Corporate Sustainability Reporting Directive and California's Advanced Clean Truck regulation are forcing shippers to embed carbon criteria into bids, accelerating demand for certified low-emission services. DHL already targets 30% sustainable aviation fuel (SAF) blending by 2030, while UPS plans fleet-wide carbon neutrality by 2050. Procurement leaders now allocate up to 3% of logistics budgets to compliance-linked decarbonization projects, turning emissions performance into a contract-winning differentiator. Providers showing audit-ready data enjoy first-mover advantages in lane awards, especially on EU-US trade flows. Absent credible roadmaps, carriers risk exclusion from preferred supplier lists as early as 2027.
E-commerce boom accelerating low-carbon last-mile solutions
Spiking parcel volumes concentrate emissions in dense urban nodes, where municipalities deploy zero-emission zones and congestion pricing. AI-guided routing of electric vans has cut delivery times by 15-20% while lowering CO2 by as much as 40% in large European capitals. Retailers such as Mars are co-funding 300 electric Class 8 trucks with Einride, targeting 20,000 t annual reductions by 2030. Although consumer willingness to pay premiums remains muted, regulatory incentives and brand commitments are pushing "green delivery" toward default status in the green logistics market.
High upfront capex for zero-emission fleets & infrastructure
Purchase premiums on battery-electric trucks range from USD 70,000-113,000 per unit, while megawatt chargers can exceed USD 3.1 million per kilometer on dedicated electric-road projects. Smaller carriers struggle to secure financing, and uncertainty over residual values still dampens resale-based funding models. Although operating savings accumulate over time, near-term cash-flow strain hinders scale adoption in emerging economies lacking green credit facilities.
Other drivers and restraints analyzed in the detailed report include:
- Rapid cost declines in battery-electric & fuel-cell trucks
- AI-enabled route & load optimization, cutting emissions
- Limited charging & green-fuel infrastructure outside Tier-1 routes
For complete list of drivers and restraints, kindly check the Table Of Contents.
Segment Analysis
Manufacturing & industrial shippers accounted for 26.20% of the green logistics market in 2025, reflecting decades-long compliance cultures and predictable shipping patterns that simplify emissions auditing. Their embedded supplier scorecards channel freight budgets toward providers with asset-based decarbonization roadmaps, reinforcing share dominance. Energy-intensive plants increasingly negotiate integrated renewable power and electric truck packages that lock in multiyear carbon reductions. Retail & e-commerce, though smaller today, is advancing at an 17.35% CAGR, propelled by urban micro-fulfilment centers and mandated zero-emission delivery windows in metropolitan zones. The green logistics market size for e-commerce shipments is set to climb sharply as returns volumes swell and merchants internalize the cost of "free" delivery. Automotive OEMs, meanwhile, trial electric car carriers to cut distribution emissions by 40% per unit, while healthcare brands co-invest in SAF corridors to safeguard cold-chain integrity without raising carbon intensity.
Electric-vehicle density, standardized pallets, and digitized bill-of-lading systems grant manufacturers visibility into cradle-to-gate footprints, enabling continuous optimization. In contrast, e-commerce operators leverage AI to orchestrate parcel lockers, bike couriers, and dark-store networks that eliminate failed delivery attempts. Both archetypes converge on data-centric performance dashboards that convert emissions tracking into a competitive procurement variable, illustrating how diverse end users amplify growth in the green logistics market.
Complete Report Scope:
- By End User (Value, USD Bn)
- Retail & E-commerce
- Manufacturing & Industrial
- Automotive
- Healthcare & Pharmaceuticals
- Food & Beverages
- Chemicals & Hazardous Materials
- Others
- By Service Type (Value)
- Warehousing and Storage
- Transportation
- Road
- Rail
- Sea and Inland Waterways
- Air
- Value-Added Services (Packaging, Kitting, Labelling)
- Geography (Value)
- North America
- United States
- Canada
- Mexico
- South America
- Brazil
- Peru
- Chile
- Argentina
- Rest of South America
- Asia-Pacific
- India
- China
- Japan
- Australia
- South Korea
- South East Asia (Singapore, Malaysia, Thailand, Indonesia, Vietnam, and Philippines)
- Rest of Asia-Pacific
- Europe
- United Kingdom
- Germany
- France
- Spain
- Italy
- BENELUX (Belgium, Netherlands, and Luxembourg)
- NORDICS (Denmark, Finland, Iceland, Norway, and Sweden)
- Rest of Europe
- Middle East And Africa
- United Arab of Emirates
- Saudi Arabia
- South Africa
- Nigeria
- Rest of Middle East And Africa
- North America
Geography Analysis
APAC led the green logistics market with a 36.65% revenue share in 2025 and is growing fastest at 8.62% CAGR through 2031. China's nationwide green-freight corridors and subsidies for electric Class 8 trucks accelerate fleet turnover, while India leverages new-build industrial parks to embed rooftop PV and EV charging from inception . Japan continues to modernize freight rail, expanding its modal shift program to lower highway congestion and cut logistics CO2. Southeast Asian nations capitalize on technology transfer, integrating battery swapping and microgrid solutions into port expansions to leapfrog legacy infrastructure.
North America remains the second-largest regional contributor, buoyed by the US federal target for 100% zero-emission truck sales by 2040 and tax credits that slash acquisition costs on Class 7-8 electrics. California's Advanced Clean Truck rule already compels OEMs to meet escalating ZEV sales quotas, driving early deployment of charging hubs across I-5 and I-10 corridors. Canada's anti-greenwashing legislation, effective June 2024, imposes fines up to CAD 10 million for misleading environmental claims, pushing carriers toward audit-ready disclosures, while Mexico promotes green-border programs that synchronize emissions standards on North-South trade routes.
Europe enjoys the world's most sophisticated policy mix-carbon pricing, eHighway pilots, and 43% CO2 cut mandates for heavy trucks by 2030-making zero-emission freight a regulatory certainty. Sweden's electric road classes expanded to over 50 km in 2025, generating performance data that informs Germany's national rollout. Logistics firms deploy low-carbon fleets as a licence-to-operate; CEVA's addition of 23 electric trucks curbs 38,300 t of CO2 annually, while integrated charging networks protect uptime. Eastern European lanes, though lagging infrastructure, attract EU cohesion funds earmarked for green corridors, promising convergence by the end of the decade.
The Middle East and Africa are nascent but rapidly mobilizing. The UAE's Net Zero 2050 Strategy backs solar-powered logistics parks at Jebel Ali, and Saudi Arabia links green hydrogen pilots to freight trials on the Riyadh-Jeddah corridor. South Africa's carbon tax nudges carriers toward biodiesel blends, yet grid reliability challenges slow widespread fleet electrification. Overall, regional heterogeneity ensures that localized policy incentives, infrastructure readiness, and industrial baselines dictate adoption speed, but each geography now features anchor projects that signal irreversible momentum in the green logistics market.
- DHL Group
- United Parcel Service (UPS)
- FedEx Corporation
- GEODIS
- Hellmann Worldwide Logistics
- Kuehne + Nagel International AG
- Nippon Express
- CEVA Logistics
- XPO Logistics
- DSV A/S
- Yusen Logistics Co., Ltd.
- Bollore Logistics
- Al-Futtaim Logistics
- Mahindra Logistics Ltd.
- Americold Logistics
- GXO Logistics
- C.H. Robinson Worldwide, Inc.
- Lineage Logistics
- JD Logistics
- Ryder System, Inc.
Additional Benefits:
- The market estimate (ME) sheet in Excel format
- 3 months of analyst support
TABLE OF CONTENTS
1 Introduction
- 1.1 Study Assumptions & Market Definition
- 1.2 Scope of the Study
2 Research Methodology
3 Executive Summary
4 Market Landscape
- 4.1 Market Overview
- 4.2 Market Drivers
- 4.2.1 Net-zero mandates tightening across global supply chains
- 4.2.2 E-commerce boom accelerating demand for low-carbon last-mile solutions
- 4.2.3 Rapid cost declines in battery-electric & fuel-cell trucks
- 4.2.4 AI-enabled route & load optimisation cutting emissions
- 4.2.5 Roll-out of electric road systems on heavy-freight corridors
- 4.2.6 Emerging "Green-as-a-Service" contractual models monetising carbon savings
- 4.3 Market Restraints
- 4.3.1 High upfront capex for zero-emission fleets & infrastructure
- 4.3.2 Fragmented global standards for carbon reporting & green fuels
- 4.3.3 Limited charging & green-fuel infrastructure outside Tier-1 routes
- 4.3.4 Rising litigation/penalties linked to ESG-greenwashing claims
- 4.4 Value / Supply-Chain Analysis
- 4.5 Regulatory Landscape
- 4.6 Technological Outlook
- 4.7 Porter's Five Forces
- 4.7.1 Threat of New Entrants
- 4.7.2 Bargaining Power of Buyers
- 4.7.3 Bargaining Power of Suppliers
- 4.7.4 Threat of Substitutes
- 4.7.5 Intensity of Competitive Rivalry
5 Market Size & Growth Forecasts
- 5.1 By End User (Value, USD Bn)
- 5.1.1 Retail & E-commerce
- 5.1.2 Manufacturing & Industrial
- 5.1.3 Automotive
- 5.1.4 Healthcare & Pharmaceuticals
- 5.1.5 Food & Beverages
- 5.1.6 Chemicals & Hazardous Materials
- 5.1.7 Others
- 5.2 By Service Type (Value)
- 5.2.1 Warehousing and Storage
- 5.2.2 Transportation
- 5.2.2.1 Road
- 5.2.2.2 Rail
- 5.2.2.3 Sea and Inland Waterways
- 5.2.2.4 Air
- 5.2.3 Value-Added Services (Packaging, Kitting, Labelling)
- 5.3 Geography (Value)
- 5.3.1 North America
- 5.3.1.1 United States
- 5.3.1.2 Canada
- 5.3.1.3 Mexico
- 5.3.2 South America
- 5.3.2.1 Brazil
- 5.3.2.2 Peru
- 5.3.2.3 Chile
- 5.3.2.4 Argentina
- 5.3.2.5 Rest of South America
- 5.3.3 Asia-Pacific
- 5.3.3.1 India
- 5.3.3.2 China
- 5.3.3.3 Japan
- 5.3.3.4 Australia
- 5.3.3.5 South Korea
- 5.3.3.6 South East Asia (Singapore, Malaysia, Thailand, Indonesia, Vietnam, and Philippines)
- 5.3.3.7 Rest of Asia-Pacific
- 5.3.4 Europe
- 5.3.4.1 United Kingdom
- 5.3.4.2 Germany
- 5.3.4.3 France
- 5.3.4.4 Spain
- 5.3.4.5 Italy
- 5.3.4.6 BENELUX (Belgium, Netherlands, and Luxembourg)
- 5.3.4.7 NORDICS (Denmark, Finland, Iceland, Norway, and Sweden)
- 5.3.4.8 Rest of Europe
- 5.3.5 Middle East And Africa
- 5.3.5.1 United Arab of Emirates
- 5.3.5.2 Saudi Arabia
- 5.3.5.3 South Africa
- 5.3.5.4 Nigeria
- 5.3.5.5 Rest of Middle East And Africa
- 5.3.1 North America
6 Competitive Landscape
- 6.1 Market Concentration
- 6.2 Strategic Moves
- 6.3 Market Share Analysis
- 6.4 Company Profiles (includes Global level Overview, Market level overview, Core Segments, Financials as available, Strategic Information, Market Rank/Share for key companies, Products & Services, and Recent Developments)
- 6.4.1 DHL Group
- 6.4.2 United Parcel Service (UPS)
- 6.4.3 FedEx Corporation
- 6.4.4 GEODIS
- 6.4.5 Hellmann Worldwide Logistics
- 6.4.6 Kuehne + Nagel International AG
- 6.4.7 Nippon Express
- 6.4.8 CEVA Logistics
- 6.4.9 XPO Logistics
- 6.4.10 DSV A/S
- 6.4.11 Yusen Logistics Co., Ltd.
- 6.4.12 Bollore Logistics
- 6.4.13 Al-Futtaim Logistics
- 6.4.14 Mahindra Logistics Ltd.
- 6.4.15 Americold Logistics
- 6.4.16 GXO Logistics
- 6.4.17 C.H. Robinson Worldwide, Inc.
- 6.4.18 Lineage Logistics
- 6.4.19 JD Logistics
- 6.4.20 Ryder System, Inc.
7 Market Opportunities & Future Outlook
- 7.1 White-space & Unmet-Need Assessment