

|
시장보고서
상품코드
2097244
천연자원 업계 시험, 검사, 인증 : 시장 점유율 분석, 업계 동향과 통계, 성장 예측(2026-2031년)Testing, Inspection, and Certification for the Natural Resources Industry - Market Share Analysis, Industry Trends & Statistics, Growth Forecasts (2026 - 2031) |
||||||
 Mordor Intelligence
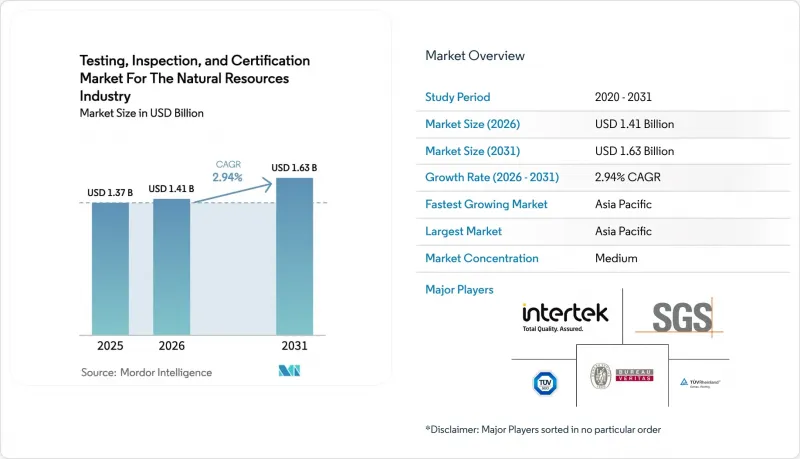
Mordor Intelligence에 의하면, 천연자원 업계 시험, 검사, 인증 시장 규모는 2025년 13억 7,000만 달러에서 2026년에는 14억 1,000만 달러로 확대되고, 2026-2031년 CAGR 2.94%로 성장을 지속하여 2031년까지 16억 3,000만 달러에 이를 것으로 예측됩니다.
본 보고서는 서비스 유형별(시험 서비스, 검사 서비스, 인증 서비스), 조달 형태별(사내 수행 및 외부 위탁), 지역별(북미, 남미, 유럽, 아시아태평양, 중동 및 아프리카)로 분류되어 있습니다. 시장 전망은 금액(달러) 기준으로 제시되어 있습니다.
전 세계 천연자원 산업을 위한 시험, 검사, 인증 동향 및 인사이트
제3자에 의한 규정 준수 시험을 의무화하는 엄격한 환경 규제
세계 감독 체계는 사업자의 자체 신고에서 배출량, 지하수질, 폐기물 관리, 토양에 미치는 영향을 포괄하는 의무적인 독립 검증으로 전환되고 있습니다. 미국 환경보호청(EPA)의 2024년 PFAS 국가 1차 음용수 규제에는 석유 및 가스정 주변에 대한 광범위한 시료 채취 의무가 추가되어, 인증 시험소에 새로운 수익원이 창출되고 있습니다. 이와 병행하여, 유럽연합(EU)의 산업 배출 지침 변경에 따라 제3자 기관의 교정을 받은 지속적인 배출량 모니터링이 의무화되었습니다. 캘리포니아주와 텍사스주 등 미국 각 주에서는 광학식 가스 이미징을 활용한 분기별 메탄 누출 검사가 의무화되어 있으며, 탄소 가격 제도를 채택한 각국에서는 검증된 온실가스 측정이 규정되어 있습니다. 따라서 천연자원 산업을 대상으로 하는 시험, 검사, 인증(TIC) 분야는 규제의 세분화로 인해 경험이 풍부한 공급업체에게 유리한 지역별 틈새 시장이 형성됨에 따라, 대량의 시험 업무와 현장 감사의 혜택을 누리고 있습니다.
에너지 및 광물 자원에 대한 전 세계적 수요 증가가 탐사 활동을 견인
아시아태평양 전체의 에너지 소비량이 연평균 4%의 지속적인 증가세를 보이고 있어 새로운 LNG, 파이프라인, 광업 프로젝트를 뒷받침하고 있으며, 각 프로젝트마다 철저한 지질학적 조사, 환경 조사 및 자산 건전성 조사가 요구되고 있습니다. 재생에너지 설비 자체도 리튬, 코발트, 니켈 채굴에 의존하고 있어, 환경 영향 평가 및 전문적인 분석 시험에 대한 수요가 증가하고 있습니다. 중국의 ‘일대일로’를 통한 자금 지원은 중앙아시아의 석유·광업 사업에 자본을 유입시키고 있으며, 이러한 사업들은 다자간 대출 기준을 준수함을 입증해야 하므로 국제적인 검증 요건이 도입되고 있습니다. 일본, 호주, 인도에서 부상하고 있는 수소 경제는 전해조, 저장 탱크, 수송 파이프라인에 대해 완전히 새로운 인증 수요를 창출하고 있습니다. 탐사 예산이 증가함에 따라 천연자원 산업을 위한 시험, 검사, 인증(TIC) 서비스는 점점 더 복잡해지는 프로젝트 설계 사양에 맞춘 고도의 실험실 분석, 구조 검사, 인증 감사를 제공함으로써 확대되고 있습니다.
원자재 가격 변동이 TIC 예산의 주기적인 삭감을 초래
원유 및 비철금속의 벤치마크 가격 변동으로 인해 현금 흐름이 악화되면, 사업자는 비핵심 지출을 대폭 삭감하게 되며, 재량적 검증 프로그램이 삭감 대상이 됩니다. 세계은행의 데이터에 따르면, 2020년 이후 가격 변동 폭은 40% 증가했으며, 경기 침체기에는 평균 15-25%의 지출 삭감이 이루어지고 있는 것으로 나타났습니다. 연방준비제도이사회(FRB)의 조사에 따르면, TIC 비용은 종종 간접비로 취급되기 때문에 예산이 축소될 때 불균형적으로 삭감되기 쉽다는 점이 지적되고 있습니다. 그 결과, 서비스 제공업체는 최대 40%의 수익 감소를 겪게 되어, 새로운 시험소 건설이나 검사원 연수와 같은 장기적인 투자가 저해되고 있습니다. 따라서 천연자원 산업을 대상으로 하는 시험·검사·인증(TIC) 사업은 수익 주기를 안정화하기 위해 상품 및 지역을 아우르는 사업 다각화가 필요하지만, 소규모 지역 기업의 경우 급격한 경기 침체를 극복할 수 있는 자본적 내성이 부족할 가능성이 있습니다.
부문 분석
2025년에는 시험 서비스가 매출의 53.25%를 차지했습니다. 이는 탄화수소 스트림, 중요 광물 광석 및 신흥 오염 물질에 대한 필수적인 실험실 분석을 반영한 것입니다. 이러한 우위가 지속되는 이유는 환경 규제 당국이 정량적 검증을 의무화하고 있으며, 이 업무는 추적 가능한 표준 물질과 문서화된 불확실성을 사용하여 인증을 받은 실험실만이 수행할 수 있기 때문입니다. PFAS, 미세 플라스틱, 미량 금속에 관한 프로토콜의 발전으로 분석 항목이 확대되고 있으며, 천연 자원 산업을 위한 시험, 검사, 인증이라는 광범위한 분야에서 하위 부문의 두 자릿수 성장이 지속되고 있습니다.
인증 서비스는 규모는 작지만, 기관 투자자 및 금융 기관이 ESG 지표에 대한 제3자 인증을 요구하는 가운데 3.55%라는 가장 높은 연평균 성장률(CAGR)을 기록하고 있습니다. 온실가스 인벤토리 및 탄소 크레딧 정량화에 관한 새로운 ISO 14064 표준으로 인해 독립적인 인증서에 대한 수요가 높아지고 있는 한편, 배터리 재료 공급망에서는 지속적인 보관 이력 검증이 요구되고 있습니다. 검사 서비스는 파이프라인, 저장 탱크, 중장비의 구조적 건전성 점검에서 여전히 핵심적인 역할을 수행하고 있지만, 육안에 의한 정기 점검의 상당 부분이 드론이나 센서 플랫폼으로 전환됨에 따라 그 성장세는 둔화되고 있습니다. 그럼에도 불구하고 치명적인 고장 위험이 있는 경우에는 디지털 대체 수단에만 의존할 수 없으며, 검사가 여전히 중요한 역할을 담당하고 있기 때문에 천연자원 산업을 위한 시험, 검사, 인증 분야 내 수요는 안정적입니다.
지역별 분석
아시아태평양의 38.55% 점유율은 중국의 LNG 수입 터미널부터 인도네시아의 니켈 광산에 이르기까지 막대한 에너지 및 인프라 투자를 뒷받침하고 있습니다. 이 지역의 연평균 성장률(CAGR) 3.78%는 재료 시험 수요를 증가시키는 재생에너지의 확대와, 제3자 감사를 의무화하는 현지 환경 규제의 강화에 의해 주도되고 있습니다. 2050년까지 재생에너지에 의한 전력 공급 비율을 70%로 끌어올리겠다는 중국의 로드맵만으로도 매년 수천 건의 검증 프로젝트가 창출되고 있습니다. 호주, 필리핀, 베트남에서는 전 세계 구매자들에게 지속 가능한 조달임을 증명해야 하는 구리, 리튬, 희토류 개발이 진행 중이며, 이는 시장에 더욱 탄력을 더하고 있습니다. 일본과 한국의 수소 경제 추진은 새로운 전해조 및 저장 기술에 대한 인증 수요를 촉진하고 있으며, 천연자원 산업을 대상으로 하는 시험·검사·인증(TIC) 사업 범위를 신흥 청정 에너지 거점으로 확대시키고 있습니다.
북미에서는 성숙한 셰일가스·셰일오일 개발 지역에서 환경보호청(EPA)의 규정에 따라 수압 파쇄액 분석, 생산수 처리 검증, 메탄 배출량 모니터링이 요구되고 있으며, 이로 인해 업무량이 대폭 증가하고 있습니다. '인플레이션 억제법'의 국내 조달 요건에 따라 배터리용 금속 채굴 프로젝트가 가속화되고 있으며, 이는 분석 시험 및 ESG 감사 수요로 이어지고 있습니다. 캐나다의 오일샌드 및 북극권 해양 유전 개발 프로젝트에서는 한랭지용 재료 시험 및 원격 검사가 요구되고 있는 반면, 멕시코 업스트림 부문의 자유화로 인해 미국석유협회(API) 기준에 부합하는 해양 안전 검증 기회가 생겨나고 있습니다. 원자재 가격 변동으로 인해 탐사 예산이 때때로 압박을 받는 반면, 해당 지역의 견고한 규제 감독 체제 덕분에 제3자 서비스에 대한 기본적인 수요가 유지되고 있어 천연자원 산업을 위한 시험, 검사, 인증 사업에 안정적인 수익을 가져다주고 있습니다.
유럽의 엄격한 지속가능성 프레임워크는 재생에너지 부품 시험, 탄소 포집 프로젝트 검증, 재활용 공정 인증을 중심으로 한 독자적인 서비스 구성을 형성하고 있습니다. '기업 지속가능성 보고 지침(CSRD)'에 따라 수천 개 기업에 대해 상세한 제3자 데이터 보증이 의무화됨에 따라, 인증을 통한 수익원이 확대되고 있습니다. 노르웨이의 해상 풍력 발전소 및 CO₂ 저장 시설은 해양 지반 시험 및 해저 파이프라인 검사에 대한 수요를 촉진하고 있습니다. 독일의 산업 탈탄소화 기금은 수소 인프라 구축을 촉진하고 있으며, 이를 위해서는 전해조의 효율, 저장 설비의 무결성, 그리고 파이프라인 자재의 적합성 검증이 필요합니다. 한편, 동유럽 국가들은 EU 규정을 준수하는 규제를 도입하고 있어, 국경을 넘는 에너지 및 광물 유통을 지원하는 공인 TIC 시험소에 대한 수요가 증가하고 있습니다. 이러한 동향들이 맞물리면서, 유럽은 천연자원 산업을 위한 시험, 검사, 인증(TIC) 분야에서 고부가가치이면서도 기술적으로 높은 수준이 요구되는 시장으로서의 입지를 확고히 하고 있습니다.
기타 혜택:
- 엑셀 형식 시장 예측(ME) 시트
- 3개월간의 애널리스트 지원
자주 묻는 질문
목차
제1장 서론
제2장 조사 방법
제3장 주요 요약
제4장 시장 구도
제5장 시장 규모와 성장 예측
제6장 경쟁 구도
제7장 시장 기회와 향후 전망
KTH 26.08.06According to Mordor Intelligence, the testing, inspection, and certification market size for the natural resources industry is expected to grow from USD 1.37 billion in 2025 to USD 1.41 billion in 2026 and is forecast to reach USD 1.63 billion by 2031 at 2.94% CAGR over 2026-2031.
This report is Segmented by Service Type (Testing Services, Inspection Services, and Certification Services), Sourcing Type (In-House and Outsourced), and Geography (North America, South America, Europe, Asia-Pacific, and the Middle East and Africa). The Market Forecasts are Provided in Terms of Value (USD).
Global Testing, Inspection, and Certification for the Natural Resources Industry Trends and Insights
Stringent Environmental Regulations Mandating Third-Party Compliance Testing
Global oversight is pivoting from operator self-reporting to mandatory independent verification that covers emissions, groundwater quality, waste management, and soil impacts. The U.S. Environmental Protection Agency's 2024 PFAS National Primary Drinking Water Regulation added extensive sampling obligations near oil and gas wells, creating new revenue streams for accredited laboratories. Parallel changes to the European Union Industrial Emissions Directive require continuous emissions monitoring calibrated by third parties. U.S. states such as California and Texas demand quarterly methane-leak inspections using optical gas imaging, while nations adopting carbon-pricing regimes stipulate verified greenhouse-gas measurement. The Testing, Inspection, and Certification for the Natural Resources Industry, therefore, benefits from large volumes of laboratory work and on-site audits as regulatory fragmentation generates localized niches that favor seasoned providers.
Rising Global Demand for Energy and Minerals Driving Exploration Activities
A sustained annual 4% growth in energy consumption across Asia-Pacific is spurring fresh LNG, pipeline, and mining projects, each requiring exhaustive geological, environmental, and asset-integrity examinations. Renewable-energy installations themselves depend on lithium, cobalt, and nickel extraction, intensifying demand for environmental impact assessments and specialized assay testing. China's Belt and Road financing funnels capital into Central Asian oil and mining ventures that must demonstrate compliance with multilateral lending standards, thereby importing international verification requirements. Emerging hydrogen economies in Japan, Australia, and India introduce brand-new certification needs for electrolyzers, storage tanks, and transport pipelines. As exploration budgets climb, the Testing, Inspection, and Certification for the Natural Resources Industry expands through the provision of sophisticated laboratory analytics, structural inspections, and certification audits tailored to ever more complex project-design specifications.
Commodity-Price Volatility Causing Cyclical TIC Budget Cuts
Swings in crude oil and base-metal benchmarks lead operators to slash non-core expenditures when cash flows tighten, putting discretionary verification programs in the firing line. World Bank data show post-2020 price variance up 40%, mirrored by average 15-25% spending cuts during downturns. Federal Reserve studies note TIC costs are often treated as overhead, letting them fall disproportionately when budgets shrink. Service providers consequently endure revenue lulls of up to 40%, hindering long-term investment in new laboratories and inspector training. The Testing, Inspection, and Certification for the Natural Resources Industry must therefore diversify across commodities and geographies to smooth revenue cycles, yet smaller regional firms may lack the capital resilience to ride out sharp contractions.
Other drivers and restraints analyzed in the detailed report include:
- Increasing Complexity of Commodity Supply Chains Necessitating Traceability Audits
- Growing Adoption of Digital Oilfields and Smart Mining Requiring Real-Time Inspection Services
- Shortage of Certified Inspectors for Remote Resource Sites
For complete list of drivers and restraints, kindly check the Table Of Contents.
Segment Analysis
Testing services generated 53.25% of revenue in 2025, reflecting indispensable laboratory analysis of hydrocarbon streams, critical mineral ores, and emerging contaminants. That dominance persists because environmental regulators enforce quantitative verification, a task that only accredited laboratories can execute with traceable standards and documented uncertainty. Evolving protocols for PFAS, microplastics, and trace metals are widening the analytical menu and sustaining double-digit sub-segment growth inside the broader Testing, Inspection, and Certification for the Natural Resources Industry.
Certification services, though smaller, register the fastest 3.55% CAGR as institutional investors and lenders demand third-party attestation of ESG metrics. New ISO 14064 standards for greenhouse-gas inventory and carbon-credit quantification are elevating demand for independent certificates, while battery-material supply chains require continuous chain-of-custody validation. Inspection services remain the stalwart for structural integrity checks on pipelines, storage tanks, and heavy equipment, yet their growth lags as more visual routines migrate to drone and sensor platforms. Even so, inspection retains a critical role when catastrophic failure risks preclude relying solely on digital surrogates, ensuring stable demand within the Testing, Inspection, and Certification for the Natural Resources Industry.
Complete Report Scope:
- By Service Type
- Testing Services
- Inspection Services
- Certification Services
- By Sourcing Type
- In-house
- Outsourced
- By Geography
- North America
- United States
- Canada
- Mexico
- South America
- Brazil
- Argentina
- Rest of South America
- Europe
- Germany
- United Kingdom
- France
- Italy
- Spain
- Russia
- Rest of Europe
- Asia-Pacific
- China
- Japan
- India
- South Korea
- South-East Asia
- Rest of Asia-Pacific
- Middle East and Africa
- Middle East
- Saudi Arabia
- United Arab Emirates
- Turkey
- Rest of Middle East
- Africa
- South Africa
- Nigeria
- Rest of Africa
- Middle East
- North America
Geography Analysis
Asia-Pacific's 38.55% share underscores vast energy and infrastructure spending, from LNG import terminals in China to nickel mines in Indonesia. The region's 3.78% CAGR is powered by renewable-energy build-outs that increase demand for materials testing and by tightening local environmental laws that prescribe third-party audits. China's roadmap to 70% renewable electricity by 2050 alone spawns thousands of verification projects annually. Australia, the Philippines, and Vietnam add further momentum with copper, lithium, and rare-earth developments that must prove sustainable sourcing to global buyers. Japan and South Korea's hydrogen-economy ambitions drive certification requests for new electrolyzer and storage technologies, expanding the Testing, Inspection, and Certification for the Natural Resources Industry footprint into emerging clean-energy hubs.
North America contributes substantial volume through mature shale plays that require hydraulic-fracturing-fluid analysis, produced-water treatment validation, and methane-emissions monitoring under Environmental Protection Agency rules. Domestic-content requirements in the Inflation Reduction Act accelerate mining projects for battery metals, translating into assay testing and ESG audits. Canada's oil-sands and Arctic offshore prospects demand cold-weather materials testing and remote inspection, while Mexico's upstream liberalization opens offshore safety-verification opportunities aligned with American Petroleum Institute standards. Although commodity price volatility periodically dents exploration budgets, the region's robust regulatory oversight maintains a baseline need for third-party services, securing stable revenue for the Testing, Inspection, and Certification for the Natural Resources Industry.
Europe's stringent sustainability framework shapes a distinctive service mix centered on renewable-energy-component testing, carbon-capture project validation, and recycling-process certification. The Corporate Sustainability Reporting Directive compels granular third-party data assurance for thousands of companies, expanding certification revenue pools. Norway's offshore wind fields and CO2 storage sites foster demand for marine geotechnical testing and subsea pipeline inspection. Germany's industrial decarbonization funds catalyze hydrogen infrastructure build-outs that require verifying electrolyzer efficiency, storage integrity, and pipeline material compatibility. Meanwhile, Eastern European states adopt EU-aligned regulations, boosting demand for accredited TIC laboratories to support cross-border energy and mineral flows. Collectively, these dynamics anchor Europe as a high-value but technically demanding arena within the Testing, Inspection, and Certification for the Natural Resources Industry.
- SGS SA
- Bureau Veritas SA
- Intertek Group plc
- ALS Limited
- TUV SUD AG
- TUV Rheinland Group
- DEKRA SE
- Applus Services SA
- DNV AS
- Eurofins Scientific SE
- Element Materials Technology Group
- RINA SpA
- Kiwa NV
- UL Solutions Inc.
- Core Laboratories NV
- Petrofac Limited (TIC division)
- Fugro NV
- SGE Lab Asia Pte Ltd
- Inspectorate International Ltd
- Moody International Ltd
- Petrolab Engineering Ltd
- CCIC (China Certification and Inspection Group)
- SGEPL India Private Ltd
- Geosyntec Consultants Inc.
- Control Union Certifications BV
Additional Benefits:
- The market estimate (ME) sheet in Excel format
- 3 months of analyst support
TABLE OF CONTENTS
1 INTRODUCTION
- 1.1 Study Assumptions and Market Definition
- 1.2 Scope of the Study
2 RESEARCH METHODOLOGY
3 EXECUTIVE SUMMARY
4 MARKET LANDSCAPE
- 4.1 Market Overview
- 4.2 Market Drivers
- 4.2.1 Stringent environmental regulations mandating third-party compliance testing
- 4.2.2 Rising global demand for energy and minerals driving exploration activities
- 4.2.3 Increasing complexity of commodity supply chains necessitating traceability audits
- 4.2.4 Growing adoption of digital oilfields and smart mining requiring real-time inspection services
- 4.2.5 Rapid expansion of critical minerals value chain (lithium, nickel, cobalt) spurring specialized assay testing
- 4.2.6 ESG-driven investment pressure for independent sustainability certification
- 4.3 Market Restraints
- 4.3.1 Commodity-price volatility causing cyclical TIC budget cuts
- 4.3.2 Shortage of certified inspectors for remote resource sites
- 4.3.3 In-house sensor and analytics adoption reducing external testing demand
- 4.3.4 Geopolitical sanctions restricting TIC access in resource-rich regions
- 4.4 Industry Value Chain Analysis
- 4.5 Impact of Macroeconomic Factors
- 4.6 Regulatory Landscape
- 4.7 Technological Outlook
- 4.8 Porter's Five Forces Analysis Analysis
- 4.8.1 Threat of New Entrants
- 4.8.2 Bargaining Power of Suppliers
- 4.8.3 Bargaining Power of Buyers
- 4.8.4 Threat of Substitutes
- 4.8.5 Industry Rivalry
5 MARKET SIZE AND GROWTH FORECASTS (VALUE)
- 5.1 By Service Type
- 5.1.1 Testing Services
- 5.1.2 Inspection Services
- 5.1.3 Certification Services
- 5.2 By Sourcing Type
- 5.2.1 In-house
- 5.2.2 Outsourced
- 5.3 By Geography
- 5.3.1 North America
- 5.3.1.1 United States
- 5.3.1.2 Canada
- 5.3.1.3 Mexico
- 5.3.2 South America
- 5.3.2.1 Brazil
- 5.3.2.2 Argentina
- 5.3.2.3 Rest of South America
- 5.3.3 Europe
- 5.3.3.1 Germany
- 5.3.3.2 United Kingdom
- 5.3.3.3 France
- 5.3.3.4 Italy
- 5.3.3.5 Spain
- 5.3.3.6 Russia
- 5.3.3.7 Rest of Europe
- 5.3.4 Asia-Pacific
- 5.3.4.1 China
- 5.3.4.2 Japan
- 5.3.4.3 India
- 5.3.4.4 South Korea
- 5.3.4.5 South-East Asia
- 5.3.4.6 Rest of Asia-Pacific
- 5.3.5 Middle East and Africa
- 5.3.5.1 Middle East
- 5.3.5.1.1 Saudi Arabia
- 5.3.5.1.2 United Arab Emirates
- 5.3.5.1.3 Turkey
- 5.3.5.1.4 Rest of Middle East
- 5.3.5.2 Africa
- 5.3.5.2.1 South Africa
- 5.3.5.2.2 Nigeria
- 5.3.5.2.3 Rest of Africa
- 5.3.5.1 Middle East
- 5.3.1 North America
6 COMPETITIVE LANDSCAPE
- 6.1 Market Concentration
- 6.2 Strategic Moves
- 6.3 Market Share Analysis
- 6.4 Company Profiles {(includes Global level Overview, Market level overview, Core Segments, Financials as available, Strategic Information, Market Rank/Share for key companies, Products and Services, and Recent Developments)}
- 6.4.1 SGS SA
- 6.4.2 Bureau Veritas SA
- 6.4.3 Intertek Group plc
- 6.4.4 ALS Limited
- 6.4.5 TUV SUD AG
- 6.4.6 TUV Rheinland Group
- 6.4.7 DEKRA SE
- 6.4.8 Applus Services SA
- 6.4.9 DNV AS
- 6.4.10 Eurofins Scientific SE
- 6.4.11 Element Materials Technology Group
- 6.4.12 RINA SpA
- 6.4.13 Kiwa NV
- 6.4.14 UL Solutions Inc.
- 6.4.15 Core Laboratories NV
- 6.4.16 Petrofac Limited (TIC division)
- 6.4.17 Fugro NV
- 6.4.18 SGE Lab Asia Pte Ltd
- 6.4.19 Inspectorate International Ltd
- 6.4.20 Moody International Ltd
- 6.4.21 Petrolab Engineering Ltd
- 6.4.22 CCIC (China Certification and Inspection Group)
- 6.4.23 SGEPL India Private Ltd
- 6.4.24 Geosyntec Consultants Inc.
- 6.4.25 Control Union Certifications BV
7 MARKET OPPORTUNITIES AND FUTURE OUTLOOK
- 7.1 White-space and Unmet-need Assessment


