

|
시장보고서
상품코드
2097361
금융 서비스 산업용 데스크톱 가상화 시장 : 시장 점유율 분석, 산업 동향 및 통계 데이터, 성장 예측(2025-2030년)Desktop Virtualization In Financial Services Industry - Market Share Analysis, Industry Trends & Statistics, Growth Forecasts (2025 - 2030) |
||||||
 Mordor Intelligence
Mordor Intelligence에 의하면, 금융 서비스 산업용 데스크톱 가상화 시장 규모는 2025년에 288만 달러로 평가되었고, 2030년까지 575만 달러에 이를 것으로 예측되며, 예측 기간 중 연평균 복합 성장률(CAGR)은 14.8%를 나타낼 전망입니다.
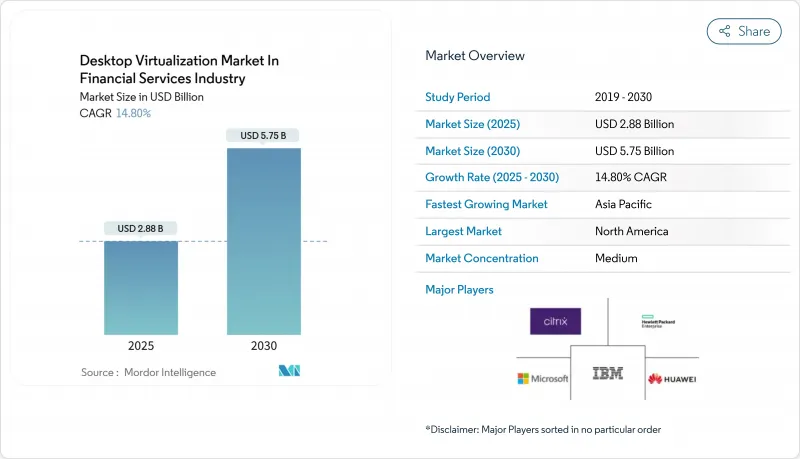
본 보고서는 데스크톱 전달 플랫폼별(호스트형 가상 데스크톱 등), 배포 방식별(온프레미스, 클라우드, 하이브리드), 조직 규모별(대기업, 중소기업), 최종 사용자별(소매 및 상업 은행 등), 지역별(북미, 유럽 등)로 분류되어 있습니다. 시장 전망은 금액(달러) 기준으로 제시되어 있습니다.
금융 서비스 산업용 데스크톱 가상화 시장 동향 및 인사이트
Tier 1 은행의 광범위한 클라우드 전환 전략
대형 은행들은 회복력을 향상시키고 소유 비용을 절감하기 위해 하이브리드 클라우드 청사진에 기반하여 데스크톱 환경을 재구축하고 있습니다. 기밀성이 높은 거래 플랫폼은 온프레미스에 남겨두면서, 백오피스 데스크톱은 클라우드 구독 모델로 전환하고 있으며, 이를 통해 계약직 직원, 테스트 팀 및 재해 복구 훈련을 위한 동적 프로비저닝이 가능해졌습니다. 그 결과, 조달 정책은 하드웨어 교체 주기에서 비즈니스 성과와 연계된 운영비 기반 계약으로 전환되고 있습니다. 이러한 변화로 인해 클라우드 네이티브 보안 제어의 표준화가 가속화되고, 가상 세션 전반에 감사 추적 기능이 통합되고 있습니다. 금융 기관들이 24-36개월에 걸친 단계적 전환을 추진하는 가운데, 레거시 데이터센터와 멀티 클라우드 오케스트레이션을 연결해 줄 수 있는 벤더에 대한 수요가 높아지고 있습니다.
제로 트러스트 보안 프레임워크로의 전환 가속화
금융 기업들은 현재 모든 가상 데스크톱 연결에서 다중 요소 인증(MFA), 행동 분석, 세션 기반 위험 점수 산정을 통합하여 지속적인 인증을 수행할 것을 요구하고 있습니다. 트레이더는 생체 인증으로 로그인하고, 이상 징후가 감지될 경우 데이터 접근을 제한하는 위치 기반 제어가 적용되는 반면, 컴플라이언스 팀은 키 입력 수준의 기록을 실시간으로 감사합니다. 이러한 기능 덕분에 VDI 선정 기준은 성능에 그치지 않고 네이티브 제로 트러스트에 대한 적합성까지 포함하게 되었습니다. 그 결과, 사이버 보안과 가상화 분야의 전문 지식을 겸비한 전문 통합 업체는 고액의 컨설팅 비용을 청구할 수 있게 되었으며, 플랫폼 로드맵에는 위협 인텔리전스 피드용 API 연결 지점이 점점 더 많이 포함되고 있습니다.
레거시 메인프레임 통합의 복잡성
많은 은행에서는 여전히 수십년전의 메인프레임으로 고액 거래를 처리하고 있습니다. 이러한 시스템을 최신 VDI 스택에 연결하려면 맞춤형 미들웨어, 이중 인증 경로 및 지연 시간 대책이 필요하며, 이로 인해 도입에 6-12개월의 추가 기간이 소요되고 예산도 두 자릿수 비율로 증가합니다. 희소한 COBOL 전문가나 독자적인 도구에 대한 의존은 벤더에 대한 협상력을 약화시키고, 혁신을 지연시키며, 디지털 네이티브 경쟁사 대비 가치 실현까지의 시간을 저해하고 있습니다.
부문별 분석
2024년, 호스트형 가상 데스크톱은 매출 점유율 47.1%를 유지했으나, 데스크톱-어즈-어-서비스(DaaS)는 연평균 성장률(CAGR) 17.8%를 기록하며 기존 강자들의 우위를 꾸준히 잠식했습니다. DaaS가 입지를 다지고 있는 이유는 그 종량제 가격 체계가 자문, 트레이딩, 컴플라이언스 부서에서 흔히 볼 수 있는 인력 변동에 대응하고 있기 때문입니다. 서비스 제공업체들은 규제 대응을 위한 로그 기록 기능과 GPU 옵션을 번들로 제공함으로써, 중견 은행들이 자본 지출을 급격히 늘리지 않고도 엔터프라이즈급 스택을 활용할 수 있도록 하고 있습니다. 호스팅형 공유 데스크톱 제품은 표준화된 용도를 사용하는 틈새 환경에 대응하는 반면, 원격 데스크톱 서비스는 지점의 레거시 Windows 워크로드를 지원합니다.
금융 서비스 산업용 데스크톱 가상화 시장은 DaaS 공급업체가 제로 트러스트 및 재해 복구 플레이북을 사전에 통합함으로써 도입 기간을 수개월에서 수주로 단축할 수 있다는 이점을 누리고 있습니다. 멀티테넌트형 제어 플레인을 통해 패치 적용 및 취약점 스캔이 자동화되어 감사 부담이 경감됩니다. 대조적으로, 온프레미스 HVD 환경은 오프사이트 데이터 보관을 금지하는 정책을 가진 금융 기관에게는 여전히 매력적이지만, 리프레시 주기로 인해 총비용이 증가한다는 과제에 직면해 있습니다. 따라서 선견지명이 있는 구매자들은 하이브리드형 조달을 선호하며, 핵심 트레이딩용 데스크톱은 프라이빗 클라우드에 배치하는 한편, 사무 업무용 사용자는 퍼블릭 DaaS로 이전하고 있습니다.
2024년 기준, 금융 서비스 산업용 데스크톱 가상화 시장에서 온프레미스 환경은 58.4%의 점유율을 차지했으나, 클라우드 인스턴스는 2030년까지 연평균 16.2%의 성장률로 확대될 것으로 예측됩니다. 은행들은 기밀성이 높은 데이터 세트를 로컬에 격리하고, 계절적 워크로드나 저위험 워크로드를 하이퍼스케일러로 오프로드함으로써 데이터 주권에 대한 우려를 해소하고 있습니다. 하이브리드 오케스트레이션 플랫폼은 지연 시간, 규정 준수 태그 및 비용을 기반으로 데스크톱 스케줄링을 수행합니다.
규제 당국이 암호화, 키 관리, 액세스 감사에 관한 보다 명확한 지침을 발표하고 인식되는 위험이 감소함에 따라 클라우드로의 전환이 가속화되고 있습니다. 보험사는 고객 경험 향상을 위해 고객과 가까운 클라우드 리전에서 보험금 청구 심사 처리를 수행하지만, 핵심 보험 수리 모델은 프라이빗 존에 남겨두고 있습니다. 금융 기관이 플랫폼에 대한 락인(lock-in)을 피하려는 가운데, AWS, Azure, GCP 전반에 걸쳐 통일된 정책 적용을 실현하는 벤더의 시장 점유율이 확대되고 있습니다.
지역별 분석
2024년에는 북미가 41.2%의 시장 점유율로 1위를 차지했습니다. 이는 제로 트러스트의 조기 도입, 밀집된 거래 허브, 그리고 뉴욕, 시카고, 토론토에서 진행된 대규모 GPU 가상화 시범 프로젝트가 원동력이 되었습니다. 금융 기관들은 복원력에 막대한 투자를 하고 있으며, 사업 연속성에 관한 연방 지침을 충족하기 위해 대도시권의 존 간에 액티브-액티브 데스크톱 페어를 구축하고 있습니다. 1초 미만의 페일오버 및 전송 중 암호화는 기본 사양으로 자리 잡았으며, 랜섬웨어 대책으로서 모니터링 및 자동 복구로 지출이 전환되고 있습니다.
아시아태평양은 싱가포르, 호주, 일본의 규제 당국이 클라우드 이용 규정을 명확히 하고, 은행들의 지점 기술 현대화 및 모바일 우선 서비스 출시를 뒷받침하고 있어 12.7%라는 가장 높은 연평균 성장률(CAGR)을 보일 것으로 예측됩니다. 금융 그룹은 현지 데이터센터의 포드와 지역 하이퍼스케일러의 용량을 융합한 하이브리드 데스크톱 그리드를 도입하여 인접 시장으로의 신속한 확장을 가능하게 하고 있습니다. 인도와 동남아시아의 핀테크 생태계는 레거시 시스템의 제약을 뛰어넘는 그린필드 구축을 통해 수요를 더욱 부추기고 있습니다.
유럽에서는 GDPR(EU 개인정보보호규정)(일반 데이터 보호 규정) 준수 및 에너지 효율화 의무화를 배경으로, 꾸준한 장비 교체 주기가 진행되고 있습니다. 프랑크푸르트와 파리의 은행들은 ESG 목표와 연계된 씬 클라이언트 도입을 중시하고 있으며, 노후화된 PC를 중앙 관리형 가상 데스크톱과 통합된 저전력 엔드포인트로 교체하고 있습니다. 엄격한 데이터 주권 관련 법규에 따라, 각국 고유의 클라우드 리전 및 암호화 키 에스크로에 대한 투자가 촉진되고 있습니다. 중동 및 아프리카에서는 두바이와 요하네스버그에서 도입이 아직 초기 단계이긴 하지만 가속화되고 있으며, 금융 자유무역지대가 ‘디지털 퍼스트’ 방식의 은행 면허 취득을 장려하고 있습니다. 남미에서는 선택적인 진전이 나타나고 있으며, 브라질과 칠레의 금융 기관에서는 핵심 용도를 온프레미스로 유지하면서, 컨택 센터 상담원을 대상으로 클라우드 데스크톱의 시범 운영을 진행하고 있습니다.
기타 혜택 :
- Excel 형식 시장 예측(ME) 시트
- 3개월간의 애널리스트 지원
자주 묻는 질문
목차
제1장 서론
제2장 분석 방법
제3장 주요 요약
제4장 시장 구도
제5장 시장 규모 및 성장률 예측
제6장 경쟁 구도
제7장 시장 기회 및 향후 전망
AJY 26.08.07According to Mordor Intelligence, the desktop virtualization market in financial services industry size stands at USD 2.88 million in 2025 and is projected to reach USD 5.75 million by 2030, posting a 14.8% CAGR over the forecast period.
This report is Segmented by Desktop Delivery Platform (Hosted Virtual Desktop, and More), Deployment Mode (On-Premise, Cloud, and Hybrid), Organization Size (Large Enterprises, and Small and Mid-Sized Enterprises), End-User (Retail and Commercial Banking, and More), and Geography (North America, Europe, and More). The Market Forecasts are Provided in Terms of Value (USD).
Insights and Trends of Desktop Virtualization Market In Financial Services Industry
Widespread Cloud-Migration Strategies Among Tier-1 Banks
Large banks are refactoring their desktop estates around hybrid-cloud blueprints to improve resilience and reduce ownership costs. Sensitive trading platforms remain on-premises, while back-office desktops transition to cloud subscription models, enabling dynamic provisioning for contractors, test teams, and disaster recovery drills. Procurement, therefore, pivots from hardware refresh cycles to operating-expense contracts aligned with business outcomes. The shift accelerates standardization on cloud-native security controls and drives embedded audit-trail functionality across virtual sessions. Vendors capable of bridging legacy data centers with multi-cloud orchestration capture heightened demand as institutions roll out phased migrations over 24-36 months.
Accelerated Move to Zero-Trust Security Frameworks
Financial firms now insist that every virtual desktop connection authenticates continuously, integrating MFA, behavioral analytics, and session-based risk scoring. Traders log in with biometrics and location controls that restrict data access when anomalies arise, while compliance teams audit keystroke-level histories in real-time. These capabilities elevate VDI selection criteria beyond performance to encompass native zero-trust alignment. Consequently, specialist integrators with combined cybersecurity and virtualization expertise command premium consulting rates, and platform roadmaps increasingly embed API hooks for threat-intelligence feeds.
Legacy Mainframe Integration Complexity
Many banks still process high-value transactions on decades-old mainframes. Bridging these systems to modern VDI stacks requires custom middleware, doubled authentication paths, and latency workarounds that add 6-12 months to rollouts and raise budgets by double-digit percentages. Dependence on scarce COBOL specialists and proprietary tooling reduces vendor leverage and slows innovation, hampering time-to-value compared to digital-native peers.
Other drivers and restraints analyzed in the detailed report include:
- Hybrid-Work Mandates for Capital-Market Trading Floors
- Growing GPU-Enabled Risk-Analytics Workloads
- Skills Gap in Cloud-Native VDI Operations
For complete list of drivers and restraints, kindly check the Table Of Contents.
Segment Analysis
Hosted Virtual Desktop retained a 47.1% revenue share in 2024, yet Desktop-as-a-Service posted a 17.8% CAGR that steadily eroded incumbent dominance. DaaS gains ground because fee-for-use pricing aligns with volatile head-count swings common in advisory, trading, and compliance units. Service providers bundle regulatory logging and GPU options, allowing mid-tier banks to access enterprise-grade stacks without incurring capital expenditure spikes. Hosted Shared Desktop products cater to niche environments with standardized applications, while Remote Desktop Services support legacy Windows workloads in branch offices.
The desktop virtualization market in financial services industry benefits as DaaS vendors pre-integrate zero-trust and disaster-recovery playbooks, shortening deployment from months to weeks. Multi-tenant control planes automate patching and vulnerability scans, easing audit pressures. In contrast, on-premises HVD estates still appeal to institutions whose policies prohibit off-site data, but they face refresh cycles that increase total cost. Forward-looking buyers therefore favor hybrid procurement, sinking core trading desktops into private clouds while diverting clerical users to public DaaS.
On-premises estates held a 58.4% desktop virtualization market in financial services industry in 2024, but cloud instances are expected to compound at 16.2% through 2030. Banks reconcile sovereignty concerns by ring-fencing sensitive data sets locally, then offloading seasonal or low-risk workloads to hyperscalers. Hybrid orchestration platforms schedule desktops based on latency, compliance tags, and cost.
Cloud acceleration intensifies as regulators publish clearer guidance on encryption, key management, and audit access, lowering perceived risk. Insurers run claims adjudication in cloud regions close to customers for a better experience, while core actuarial models remain in private zones. Vendors that deliver uniform policy enforcement across AWS, Azure, and GCP win share as institutions resist platform lock-in.
Complete Report Scope:
- By Desktop Delivery Platform
- Hosted Virtual Desktop (HVD)
- Hosted Shared Desktop (HSD)
- Desktop-as-a-Service (DaaS)
- Remote Desktop Services (RDS)
- By Deployment Mode
- On-Premises
- Cloud
- Hybrid
- By Organization Size
- Large Enterprises
- Small and Mid-sized Enterprises (SMEs)
- By End-User
- Retail and Commercial Banking
- Capital Markets and Trading
- Insurance
- FinTech and Payment Providers
- By Geography
- North America
- United States
- Canada
- Mexico
- South America
- Brazil
- Argentina
- Rest of South America
- Europe
- Germany
- United Kingdom
- France
- Italy
- Spain
- Russia
- Rest of Europe
- Asia-Pacific
- China
- Japan
- India
- South Korea
- Rest of Asia-Pacific
- Middle East and Africa
- Middle East
- Saudi Arabia
- United Arab Emirates
- Turkey
- Rest of Middle East
- Africa
- South Africa
- Nigeria
- Egypt
- Rest of Africa
- Middle East
- North America
Geography Analysis
North America led with 41.2% market share in 2024, powered by early zero-trust adoption, dense trading hubs, and large-scale GPU virtualization pilots in New York, Chicago, and Toronto. Institutions invest heavily in resilience, building active-active desktop pairs across metropolitan zones to meet federal guidelines on business continuity. Sub-second failover and encryption-in-transit are baseline specifications, and spending shifts toward monitoring and automated remediation to guard against ransomware.
The Asia-Pacific region is expected to record the fastest 12.7% CAGR, as regulators in Singapore, Australia, and Japan clarify cloud usage rules, encouraging banks to modernize their branch technology and launch mobile-first services. Financial groups deploy hybrid desktop grids that blend local data-center pods with regional hyperscaler capacity, allowing for rapid expansion into adjacent markets. FinTech ecosystems in India and Southeast Asia further fuel demand through green-field builds that leapfrog legacy limitations.
Europe experiences steady replacement cycles driven by GDPR compliance and energy-efficiency mandates. Banks in Frankfurt and Paris emphasize thin-client rollouts tied to ESG targets, swapping aging PCs for low-wattage endpoints that integrate with centralized virtual desktops. Stringent data-sovereignty statutes spur investments in country-specific cloud regions and encryption key escrow. Middle East and Africa show nascent but accelerating uptake in Dubai and Johannesburg, where financial free zones incentivize digital-first banking licenses. South America advances selectively, with Brazilian and Chilean lenders piloting cloud desktops for contact-centre agents while core applications stay on-premises.
- Citrix Systems, Inc.
- Microsoft Corporation
- VMware, Inc.
- Amazon Web Services, Inc.
- Hewlett Packard Enterprise Development LP
- IBM Corporation
- Dell Technologies Inc.
- Huawei Technologies Co., Ltd.
- Oracle Corporation
- Google LLC
- Parallels International GmbH (Corel)
- NComputing Co., Ltd.
- Evolve IP, LLC
- Ericom Software Ltd.
- Workspot, Inc.
- Nerdio, Inc.
- Anunta Tech Inc.
- Accops Systems Pvt. Ltd.
- XTIUM (ATSG)
- DXC Technology Company
Additional Benefits:
- The market estimate (ME) sheet in Excel format
- 3 months of analyst support
TABLE OF CONTENTS
1 INTRODUCTION
- 1.1 Study Assumptions and Market Definition
- 1.2 Scope of the Study
2 RESEARCH METHODOLOGY
3 EXECUTIVE SUMMARY
4 MARKET LANDSCAPE
- 4.1 Market Overview
- 4.2 Market Drivers
- 4.2.1 Widespread Cloud-migration Strategies Among Tier-1 Banks
- 4.2.2 Accelerated Move to Zero-trust Security Frameworks
- 4.2.3 Hybrid-work Mandates for Capital-market Trading Floors
- 4.2.4 ESG-driven Demand for Energy-efficient Thin Clients
- 4.2.5 Growing GPU-enabled Risk-analytics Workloads
- 4.2.6 Proliferation of AI-PC Endpoints Enabling Local Inference Off-loading
- 4.3 Market Restraints
- 4.3.1 Legacy Mainframe Integration Complexity
- 4.3.2 Skills Gap in Cloud-native VDI Operations
- 4.3.3 Concentrated Vendor-dependency Risk
- 4.3.4 Regulatory Data-residency Requirements Raising Deployment Cost
- 4.4 Evaluation of Critical Regulatory Framework
- 4.5 Industry Value Chain Analysis
- 4.6 Technological Outlook
- 4.7 Porter's Five Forces
- 4.7.1 Bargaining Power of Suppliers
- 4.7.2 Bargaining Power of Buyers
- 4.7.3 Threat of New Entrants
- 4.7.4 Threat of Substitutes
- 4.7.5 Competitive Rivalry
- 4.8 Key Use Cases and Case Studies
- 4.9 Impact on Macroeconomic Factors of the Market
- 4.10 Investment Analysis
5 MARKET SIZE AND GROWTH FORECASTS (VALUES)
- 5.1 By Desktop Delivery Platform
- 5.1.1 Hosted Virtual Desktop (HVD)
- 5.1.2 Hosted Shared Desktop (HSD)
- 5.1.3 Desktop-as-a-Service (DaaS)
- 5.1.4 Remote Desktop Services (RDS)
- 5.2 By Deployment Mode
- 5.2.1 On-Premises
- 5.2.2 Cloud
- 5.2.3 Hybrid
- 5.3 By Organization Size
- 5.3.1 Large Enterprises
- 5.3.2 Small and Mid-sized Enterprises (SMEs)
- 5.4 By End-User
- 5.4.1 Retail and Commercial Banking
- 5.4.2 Capital Markets and Trading
- 5.4.3 Insurance
- 5.4.4 FinTech and Payment Providers
- 5.5 By Geography
- 5.5.1 North America
- 5.5.1.1 United States
- 5.5.1.2 Canada
- 5.5.1.3 Mexico
- 5.5.2 South America
- 5.5.2.1 Brazil
- 5.5.2.2 Argentina
- 5.5.2.3 Rest of South America
- 5.5.3 Europe
- 5.5.3.1 Germany
- 5.5.3.2 United Kingdom
- 5.5.3.3 France
- 5.5.3.4 Italy
- 5.5.3.5 Spain
- 5.5.3.6 Russia
- 5.5.3.7 Rest of Europe
- 5.5.4 Asia-Pacific
- 5.5.4.1 China
- 5.5.4.2 Japan
- 5.5.4.3 India
- 5.5.4.4 South Korea
- 5.5.4.5 Rest of Asia-Pacific
- 5.5.5 Middle East and Africa
- 5.5.5.1 Middle East
- 5.5.5.1.1 Saudi Arabia
- 5.5.5.1.2 United Arab Emirates
- 5.5.5.1.3 Turkey
- 5.5.5.1.4 Rest of Middle East
- 5.5.5.2 Africa
- 5.5.5.2.1 South Africa
- 5.5.5.2.2 Nigeria
- 5.5.5.2.3 Egypt
- 5.5.5.2.4 Rest of Africa
- 5.5.5.1 Middle East
- 5.5.1 North America
6 COMPETITIVE LANDSCAPE
- 6.1 Market Concentration
- 6.2 Strategic Moves
- 6.3 Market Share Analysis
- 6.4 Company Profiles {(includes Global level Overview, Market level overview, Core Segments, Financials as available, Strategic Information, Market Rank/Share for key companies, Products and Services, and Recent Developments)}
- 6.4.1 Citrix Systems, Inc.
- 6.4.2 Microsoft Corporation
- 6.4.3 VMware, Inc.
- 6.4.4 Amazon Web Services, Inc.
- 6.4.5 Hewlett Packard Enterprise Development LP
- 6.4.6 IBM Corporation
- 6.4.7 Dell Technologies Inc.
- 6.4.8 Huawei Technologies Co., Ltd.
- 6.4.9 Oracle Corporation
- 6.4.10 Google LLC
- 6.4.11 Parallels International GmbH (Corel)
- 6.4.12 NComputing Co., Ltd.
- 6.4.13 Evolve IP, LLC
- 6.4.14 Ericom Software Ltd.
- 6.4.15 Workspot, Inc.
- 6.4.16 Nerdio, Inc.
- 6.4.17 Anunta Tech Inc.
- 6.4.18 Accops Systems Pvt. Ltd.
- 6.4.19 XTIUM (ATSG)
- 6.4.20 DXC Technology Company
7 MARKET OPPORTUNITIES AND FUTURE OUTLOOK
- 7.1 White-space and Unmet-Need Assessment


