

|
시장보고서
상품코드
2097382
라이브 커머스 플랫폼 : 시장 점유율 분석, 업계 동향 및 통계, 성장 예측(2025-2030년)Live Commerce Platforms - Market Share Analysis, Industry Trends & Statistics, Growth Forecasts (2025 - 2030) |
||||||
 Mordor Intelligence
Mordor Intelligence에 의하면, 라이브 커머스 플랫폼 시장 규모는 2025년에 14억 1,000만 달러로 평가되었고 2030년까지 37억 9,000만 달러에 이를 것으로 예측됩니다.
이는 예측 기간 동안 연평균 성장률(CAGR)이 21.84%에 해당합니다.
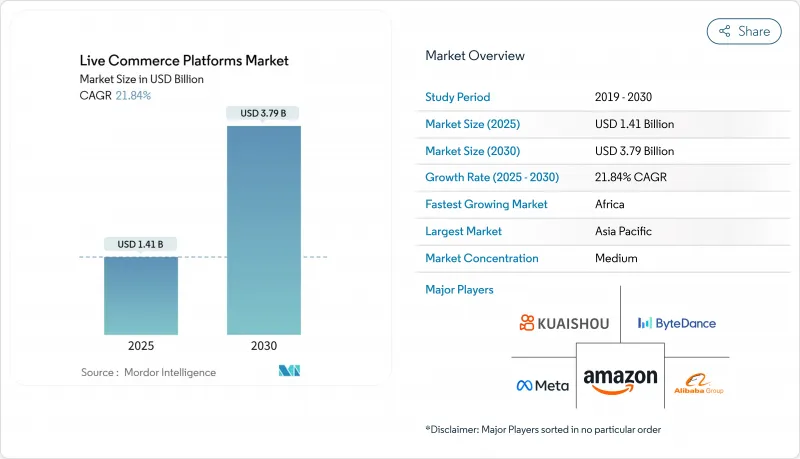
본 보고서는 제품 유형(라이브 스트리밍 마켓플레이스 플랫폼, 소셜 미디어 라이브 커머스 도구 등), 비즈니스 모델(B2C 플랫폼, 하이브리드 플랫폼 등), 산업 분야(홈 & 리빙, 식품·식료품 등), 플랫폼 유형(웹 기반 플랫폼, 모바일 애플리케이션 등) 및 지역별로 분류되어 있습니다. 시장 전망은 금액(달러) 기준으로 제시되어 있습니다.
세계의 라이브 커머스 플랫폼 시장 동향 및 인사이트
5G 네트워크 보급으로 동영상 스트리밍 품질 향상
초저지연 5G 덕분에, 기존에는 시청자 이탈의 원인이 되었던 버퍼링 현상이 해소되어 호스트는 쇼핑객의 질문에 즉시 대응할 수 있게 되었습니다. 5G는 고화질 스트림과 인터랙티브 오버레이를 지연 없이 처리할 수 있기 때문에 라이브 커머스 결제의 73%는 모바일 앱을 통해 이루어지고 있습니다. 가전제품이나 미용 제품의 시연은 선명한 디테일과 부드러운 움직임의 이점을 가장 많이 누리고 있으며, 이러한 기능 향상으로 제품 평가가 용이해졌습니다. 통신 사업자에 따르면, 라이브 커머스는 일반 동영상에 비해 40% 더 많은 대역폭을 소비하지만, 5G의 용량은 이러한 급증하는 트래픽을 흡수하면서도 다수의 동시 시청자에게도 품질을 유지하고 있습니다. 신뢰성 향상으로 인해 브랜드들은 더 긴 방송을 기획하게 되었으며, 스토리텔링의 심화와 업셀링 기회가 확대되고 있습니다. 이에 따라 라이브 커머스 플랫폼 시장은 소매 업계에서 주류로 자리 잡아가고 있습니다.
신흥 경제국에서의 스마트폰 보급률 상승
현재 사하라 이남 아프리카에서는 스마트폰 보급률이 54%를 넘고, 동남아시아에서는 73%에 달하며, 이에 따라 소비자들은 데스크톱을 통한 쇼핑 단계를 건너뛰고 라이브 방송과 직접 소통할 수 있게 되었습니다. 현지 언어를 지원하는 결제 지갑, 현지 언어 음성 트랙, 지역 방언에 정통한 인플루언서 진행자 등이 전자상거래를 처음 이용하는 사용자의 참여도를 높이고 있습니다. 이 지역에서 활동하는 플랫폼은 성숙한 경제권에 비해 전환율이 2.3배 더 높다고 보고하고 있습니다. 이는 라이브 커머스가 호기심을 충족시키고, 사회적 유대를 형성하며, 신뢰를 구축하는 것을 동시에 실현하고 있기 때문입니다. 이러한 추세에 따라 지방의 틈새 시장을 공략하는 장인들의 방송이 확대되면서 판매자의 도달 범위가 넓어지고 있습니다. 이로 인해 풀뿌리 수준의 참여가 촉진되고, 라이브 커머스 플랫폼 시장에서 모바일이 기본 채널로서의 입지를 공고히 하고 있습니다.
플랫폼 운영 사업자의 높은 고객 확보 비용
컨텐츠 양이 증가함에 따라 시청자의 관심은 희소해지고 있으며, 선진 지역의 사용자 1인당 평균 확보 비용은 47달러에 달하고, 일반적인 전자상거래 벤치마크의 약 4배에 이릅니다. 컨텐츠 품질에 대한 기대가 높아지는 가운데, 플랫폼은 전문 진행자나 스튜디오를 고용할 수밖에 없어 수익화 이전에 고정비가 증가하고 있습니다. 라이브 쇼핑 기능을 통합한 소셜 네트워크는 추가 비용을 절감하면서 기존 커뮤니티를 활용할 수 있기 때문에 유료 광고에 의존해 시청자를 모으는 중소기업의 입지를 압박하고 있습니다. 따라서 높은 참여도를 유지하려면 마케팅 예산과 크리에이터에 대한 인센티브 사이의 미묘한 균형이 필요하며, 이것이 라이브 커머스 플랫폼 시장의 단기적 확장을 억제하는 요인이 되고 있습니다.
부문 분석
내장형 라이브 스트리밍 쇼핑 플러그인은 2024년 라이브 커머스 플랫폼 시장 규모의 22.78%를 차지했으며, 2030년까지 가장 높은 연평균 성장률(CAGR)을 나타낼 전망입니다. 소매업체들은 새로운 생태계로의 전환보다는 기존 웹사이트에 플러그 앤 플레이 방식의 모듈을 추가하는 것을 선호하며, 이를 통해 기존 IT 투자를 보호하고 SEO 권위를 유지하고 있습니다. 브랜드 고유의 스토어프론트 내에서 원활한 결제 과정을 통해 트래픽 유출을 방지하고, 실시간 API를 통해 재고 현황을 화면상의 상품 카드에 반영합니다. 라이브 커머스 플랫폼 시장에서 라이브 스트리밍 마켓플레이스 플랫폼은 기존 시청자 기반 덕분에 여전히 37.64%의 시장 점유율을 차지하고 있지만, 고객 데이터와 시각적 정체성을 완벽하게 관리하고자 하는 전통 있는 브랜드에게는 임베디드형 옵션이 더 매력적입니다. 소셜 미디어 라이브 커머스 도구는 이 두 극단 사이의 중간 지점에 위치하며, 인플루언서의 방송 중에 ‘구매 가능 태그’를 통합함으로써 방대한 사용자 기반에서 수익을 창출하고 있습니다. 화이트 라벨 제품군은 여러 지역의 규정 준수 및 상세한 분석을 필요로 하는 기업을 지원하며, 라이브 커머스 플랫폼 시장 전체의 수익 성장을 뒷받침하는 다양한 경로를 부각시키고 있습니다.
마켓플레이스의 상품 검색 기능과 임베드 가능한 위젯을 결합한 하이브리드형 솔루션은 판매자가 여러 도메인에서 동시에 방송을 진행하면서도 주문 관리를 일원화할 수 있어 그 인기가 높아지고 있습니다. AI 기반 모더레이션 기능은 댓글을 필터링하여 브랜드 평판을 보호하고, 로우코드 디자인 스튜디오는 기술적 지식이 없는 팀도 동영상 배너를 쉽게 제작할 수 있게 해줍니다. 이러한 이점 덕분에 도입 주기가 수개월에서 수주로 단축되어, 마케팅 예산을 방송 인플루언서나 유료 프로모션에 할당할 수 있게 됩니다. 플러그인 라이브러리가 성숙해짐에 따라, 이들은 매장 내 이벤트, 웹상의 팝업, 소셜 프로모션을 단일 대시보드에서 동기화하는 옴니채널 전략의 기반이 되어, 임베디드형 솔루션을 라이브 커머스 플랫폼 시장의 구조적 기둥으로 확고히 자리매김할 것입니다.
B2C 형식은 2024년 매출의 44.83%를 차지하며, 직접적인 데이터 수집과 효율적인 주문 처리(fulfillment)를 중시하는 브랜드 직영점에 서비스를 제공했습니다. 대조적으로, B2C와 C2C 공급을 융합한 하이브리드 플랫폼은 더 폭넓은 상품 라인업과 동적인 가격 책정을 실현함으로써 연평균 성장률(CAGR) 22.67%로 성장하고 있습니다. 소비자들은 한 번의 세션 내에서 공식 출시 상품과 사용자 간 재판매 특가 상품을 모두 즐길 수 있다는 점을 높이 평가하고 있으며, 이로 인해 사용자 유지율과 평균 시청 시간이 향상되고 있습니다. 판매자는 재고 위험 허용도에 따라 고정 수수료와 매출 분배 방식을 전환할 수 있는 유연한 수수료 체계를 활용하고 있습니다. 이러한 유연성은 중규모 브랜드와 독립 크리에이터 모두에게 지지를 받고 있으며, 라이브 커머스 플랫폼 시장에서 방송자의 잠재 고객층을 확대되고 있습니다.
C2C 라이브 커머스는 아시아태평양에서 특히 활발하며, 이 지역에서는 브랜드의 권위보다 커뮤니티의 신뢰가 중시되기 때문에 소규모 사업자가 자택에서 방송을 진행하며 재고를 신속하게 소진할 수 있습니다. B2B 분야의 도입은 여전히 틈새 영역에 머물러 있지만, 산업 용도구나 원자재 분야에서는 정적인 카탈로그보다 라이브 데모를 통해 사양을 더 효과적으로 설명할 수 있어 도입이 확대되고 있습니다. 전반적으로 이러한 하이브리드화는 라이브 커머스 플랫폼 시장의 성숙을 나타내며, 시장은 수직적으로 분할된 시장 구조에서 오프라인 바자회의 역동성을 온라인상에서 재현하는 유동적인 생태계로 진화하고 있습니다.
지역별 분석
아시아태평양은 2024년 매출의 46.92%를 차지했습니다. 이는 중국의 성숙한 생태계뿐만 아니라, 소셜 커머스 관행이 상호작용형 쇼핑을 촉진하고 있는 인도네시아, 베트남, 태국에서의 급속한 확산에 힘입은 결과입니다. 국내 전자 지갑 및 당일 배송 서비스를 통해 결제 및 배송 프로세스가 효율화되어 고객 충성도 강화와 구매 빈도 향상이 도모되고 있습니다. 아프리카 시장은 규모는 작지만, 모바일 데이터 통신 요금의 인하와 라이브 방송실을 디지털 노점으로 탈바꿈시키는 기업이 정신이 넘치는 판매자들 덕분에 22.78%라는 가장 높은 연평균 성장률(CAGR)을 기록하고 있습니다. 데이터 통신 요금이 무료인 스트리밍 패키지를 제공하는 통신 사업자와의 제휴를 통해 도달 범위는 더욱 확대되고 있습니다.
북미 시장의 성장은 기술 대기업들이 기존 소셜 네트워크에 라이브 기능을 통합하여 사용자와 판매자 모두에게 존재하는 장벽을 낮추고 있는 데 힘입고 있습니다. 미국의 브랜드들은 피킹·포장·발송 주기를 가속화하여 ‘즉시성’에 대한 인식을 높이기 위해, 창고에 인접한 스튜디오 공간을 운영하는 경우가 늘고 있습니다.
유럽에서는 더욱 엄격한 개인정보 보호 규제로 인해 도입이 지연되고 있지만, 한정판 출시나 독점적인 백스테이지 컨텐츠가 프리미엄 가격을 정당화하는 럭셔리 분야에서는 견조한 실적을 올리고 있습니다. 라틴아메리카에서는 브라질과 멕시코에서 현지화된 결제 게이트웨이가 규모를 확대함에 따라 성장세를 보이고 있으며, 스토리텔링을 중시하는 문화가 호스트 주도의 상품 소개와 잘 부합하고 있습니다.
중동에서는 높은 가처분 소득과 한정 상품에 대한 수요가 활용되고 있으며, 면세 라이브 투어와 퍼스널 쇼퍼를 통한 방송이 맞춤형 서비스를 원하는 부유층의 요구를 충족시키고 있습니다. 이러한 지역별 특성은 라이브 커머스 플랫폼 시장 진출을 목표로 하는 기업들에게 다양한 시장 진출 전략의 타당성을 뒷받침해 줍니다.
기타 혜택 :
- 엑셀 형식 시장 예측(ME) 시트
- 3개월간의 애널리스트 지원
자주 묻는 질문
목차
제1장 서론
제2장 조사 방법
제3장 주요 요약
제4장 시장 구도
제5장 시장 규모 및 성장 예측
제6장 경쟁 구도
제7장 시장 기회 및 향후 전망
KTH 26.08.05According to Mordor Intelligence, the live commerce platforms market size is valued at USD 1.41 billion in 2025 and is projected to reach USD 3.79 billion by 2030, translating into a 21.84% CAGR over the forecast period.
This report is Segmented by Product Type (Livestream Marketplace Platforms, Social Media Live Commerce Tools, and More), Business Model (Business-To-Consumer Platforms, Hybrid Platforms, and More), Industry Vertical (Home and Living, Food and Grocery, and More), Platform Type (Web-Based Platforms, Mobile Applications, and More), and Geography. The Market Forecasts are Provided in Terms of Value (USD).
Global Live Commerce Platforms Market Trends and Insights
Proliferation of 5G Networks Enhancing Video Streaming Quality
Ultra-low-latency 5G eliminates buffering that has historically caused viewer drop-off, allowing hosts to respond instantly to shopper questions. Mobile apps process 73% of live-commerce checkouts because 5G handles high-definition streams and interactive overlays without delays. Consumer electronics and beauty demonstrations benefit most from crisp detail and smooth motion, as these enhancements improve product assessment. Network providers confirm live commerce consumes 40% more bandwidth than standard video, yet 5G capacity absorbs the spike while sustaining quality across large concurrent audiences. Higher reliability persuades brands to schedule longer broadcasts that deepen storytelling and upsell opportunities, pushing the Live Commerce Platforms market toward mainstream retail adoption.
Rising Smartphone Penetration in Emerging Economies
Smartphone ownership now exceeds 54% in sub-Saharan Africa and 73% in Southeast Asia, allowing consumers to leapfrog desktop shopping and interact directly with live broadcasts. Localized payment wallets, vernacular audio tracks, and influencer hosts familiar with regional dialects raise engagement among first-time e-commerce users. Platforms active in these regions report conversion rates 2.3 times higher than in mature economies because live commerce simultaneously satisfies curiosity, fosters social bonding, and builds trust. The trend widens seller reach as niche artisans stream from rural areas, fueling grassroots participation and reinforcing mobile as the default channel for the Live Commerce Platforms market.
High Customer Acquisition Costs for Platform Operators
As content volume climbs, viewer attention becomes scarce, driving average acquisition outlays to USD 47 per user in developed regions, nearly quadruple standard e-commerce benchmarks. Production-quality expectations push platforms to hire professional hosts and studios, inflating fixed costs ahead of monetization. Social networks that integrate live shopping features leverage existing communities at a lower incremental spend, squeezing smaller firms that rely on paid ads to attract audiences. Sustaining high engagement thus requires a delicate balance between marketing budgets and creator incentives, tempering the near-term expansion of the Live Commerce Platforms market.
Other drivers and restraints analyzed in the detailed report include:
- Integration of AI-Powered Product Recommendation Engines
- Growing Influence of Gen Z and Millennial Shopping Behaviors
- Regulatory Scrutiny Over Influencer Endorsement Transparency
For complete list of drivers and restraints, kindly check the Table Of Contents.
Segment Analysis
Embedded livestream shopping plugins accounted for 22.78% of the Live Commerce Platforms market size in 2024 and are forecast to post the fastest CAGR through 2030. Retailers prefer augmenting existing websites with plug-and-play modules rather than migrating to new ecosystems, protecting prior IT investments and preserving SEO authority. Seamless checkout within branded storefronts prevents traffic leakage, while real-time APIs feed inventory status to on-screen product cards. Livestream marketplace platforms still hold a 37.64% market share in Live Commerce Platforms, thanks to their built-in audiences; however, embedded options entice heritage brands that demand full control over customer data and visual identity. Social media live commerce tools sit between these extremes, monetizing vast user bases by integrating shoppable tags during influencer broadcasts. White-label suites cater to enterprises seeking multi-region compliance and in-depth analytics, highlighting the diverse paths that fuel revenue growth across the Live Commerce Platforms market.
Hybrid offerings that package marketplace discovery with embeddable widgets are gaining momentum because they let sellers simulcast on multiple domains while centralizing order management. AI-driven moderation filters comments to shield brand reputation, and low-code design studios democratize video banner creation for non-technical teams. These advantages shorten deployment cycles from months to weeks, freeing marketing budgets for on-air talent and paid amplification. As plugin libraries mature, they will anchor omnichannel strategies that sync in-store events, web pop-ups, and social promotions under one dashboard, cementing embedded solutions as a structural pillar of the Live Commerce Platforms market.
The B2C format captured 44.83% of 2024 revenue, serving brand-owned stores that value direct data capture and streamlined fulfillment. In contrast, hybrid platforms blending B2C and C2C supply are expanding at a 22.67% CAGR as they unlock broader catalog depth and dynamic pricing. Consumers appreciate the variety of official launches alongside peer-resale bargains within a single session, boosting stickiness and average watch time. Sellers leverage elastic commission structures, shifting between fixed fees and revenue shares based on inventory risk tolerance. This flexibility appeals to mid-sized labels and independent creators alike, enlarging the addressable pool of broadcasters on Live Commerce Platform market venues.
C2C live commerce excels in Asia Pacific, where community trust supersedes brand authority, enabling micro-entrepreneurs to stream from home and clear inventory quickly. B2B adoption remains niche, but it is rising for industrial tools and raw materials, where live demos clarify specifications more effectively than static catalogs. Overall, hybridization signals the maturation of the Live Commerce Platforms market, evolving from siloed verticals into fluid ecosystems that mirror offline bazaar dynamics online.
Complete Report Scope:
- By Product Type
- Livestream Marketplace Platforms
- Embedded Livestream Shopping Plugins
- Social Media Live Commerce Tools
- White-Label Live Shopping Software
- Other Product Type
- By Business Model
- Business-to-Consumer (B2C) Platforms
- Business-to-Business (B2B) Platforms
- Consumer-to-Consumer (C2C) Platforms
- Hybrid Platforms
- By Industry Vertical
- Fashion and Apparel
- Beauty and Personal Care
- Consumer Electronics
- Home and Living
- Food and Grocery
- Other Industry Vertical
- By Platform Type
- Web-Based Platforms
- Mobile Applications
- Cross-Platform Omni Channel Solutions
- Smart TV and OTT Applications
- By Geography
- North America
- United States
- Canada
- Mexico
- Europe
- Germany
- United Kingdom
- France
- Russia
- Rest of Europe
- Asia-Pacific
- China
- Japan
- India
- South Korea
- Australia
- Rest of Asia-Pacific
- Middle East and Africa
- Middle East
- Saudi Arabia
- United Arab Emirates
- Rest of Middle East
- Africa
- South Africa
- Egypt
- Rest of Africa
- Middle East
- South America
- Brazil
- Argentina
- Rest of South America
- North America
Geography Analysis
The Asia Pacific generated 46.92% of 2024 revenue, driven by China's mature ecosystems and the rapid adoption in Indonesia, Vietnam, and Thailand, where social commerce norms favor interactive shopping. Domestic e-wallets and same-day fulfillment services streamline the checkout and delivery process, reinforcing loyalty and increasing frequency. African markets contribute a modest base yet post the highest 22.78% CAGR, driven by the affordability of mobile data and entrepreneurial sellers transforming broadcast rooms into digital stalls. Partnerships with telecom operators offering zero-rated streaming packages further widen reach.
North America's growth relies on technology giants integrating live features into existing social networks, reducing friction for both users and merchants. U.S. brands are increasingly operating studio spaces adjacent to warehouses to accelerate the pick-pack-ship cycle, thereby enhancing the perceived immediacy.
Europe lags in adoption due to stricter privacy regulations, yet it records strong performance in luxury, where limited-edition drops and exclusive backstage content justify premium price points. Latin America is seeing traction in Brazil and Mexico as localized payment gateways achieve scale, while the cultural emphasis on storytelling aligns well with host-led product narratives.
The Middle East leverages high disposable incomes and an appetite for exclusive goods; duty-free live tours and personal shopper streams cater to affluent audiences seeking bespoke service. Such regional nuances validate a diversified go-to-market strategy for any entrant eyeing the Live Commerce Platforms market.
- Alibaba Group Holding Limited
- Amazon.com, Inc.
- ByteDance Ltd.
- Kuaishou Technology
- Meta Platforms, Inc.
- Google LLC
- Tencent Holdings Limited
- Qurate Retail, Inc.
- Mogu Inc.
- Sea Limited
- Pinduoduo Inc.
- JD.com, Inc.
- Flipkart Internet Private Limited
- NTWRK Inc.
- Bilibili Inc.
- ShopShops Holdings Inc.
- TalkShopLive, Inc.
- CommentSold, Inc.
- Bambuser AB
- Livescale Technologies Inc.
Additional Benefits:
- The market estimate (ME) sheet in Excel format
- 3 months of analyst support
TABLE OF CONTENTS
1 INTRODUCTION
- 1.1 Study Assumptions and Market Definition
- 1.2 Scope of the Study
2 RESEARCH METHODOLOGY
3 EXECUTIVE SUMMARY
4 MARKET LANDSCAPE
- 4.1 Market Overview
- 4.2 Market Drivers
- 4.2.1 Proliferation of 5G Networks Enhancing Video Streaming Quality
- 4.2.2 Rising Smartphone Penetration in Emerging Economies
- 4.2.3 Integration of AI-Powered Product Recommendation Engines
- 4.2.4 Growing Influence of Gen Z and Millennial Shopping Behaviors
- 4.2.5 Expansion of Cross-Border E-Commerce Fulfillment Infrastructure
- 4.2.6 Increasing Brand Adoption of In-House Live Shopping Studios
- 4.3 Market Restraints
- 4.3.1 High Customer Acquisition Costs for Platform Operators
- 4.3.2 Regulatory Scrutiny Over Influencer Endorsement Transparency
- 4.3.3 Fragmented Payment and Logistics Ecosystems in Developing Regions
- 4.3.4 Livestream Content Fatigue Reducing Viewer Engagement
- 4.4 Industry Value Chain Analysis
- 4.5 Regulatory Landscape
- 4.6 Technological Outlook
- 4.7 Impact of Macroeconomic Factors
- 4.8 Porter's Five Forces Analysis
- 4.8.1 Bargaining Power of Buyers
- 4.8.2 Bargaining Power of Suppliers
- 4.8.3 Threat of New Entrants
- 4.8.4 Threat of Substitutes
- 4.8.5 Competitive Rivalry
5 MARKET SIZE AND GROWTH FORECASTS (VALUE)
- 5.1 By Product Type
- 5.1.1 Livestream Marketplace Platforms
- 5.1.2 Embedded Livestream Shopping Plugins
- 5.1.3 Social Media Live Commerce Tools
- 5.1.4 White-Label Live Shopping Software
- 5.1.5 Other Product Type
- 5.2 By Business Model
- 5.2.1 Business-to-Consumer (B2C) Platforms
- 5.2.2 Business-to-Business (B2B) Platforms
- 5.2.3 Consumer-to-Consumer (C2C) Platforms
- 5.2.4 Hybrid Platforms
- 5.3 By Industry Vertical
- 5.3.1 Fashion and Apparel
- 5.3.2 Beauty and Personal Care
- 5.3.3 Consumer Electronics
- 5.3.4 Home and Living
- 5.3.5 Food and Grocery
- 5.3.6 Other Industry Vertical
- 5.4 By Platform Type
- 5.4.1 Web-Based Platforms
- 5.4.2 Mobile Applications
- 5.4.3 Cross-Platform Omni Channel Solutions
- 5.4.4 Smart TV and OTT Applications
- 5.5 By Geography
- 5.5.1 North America
- 5.5.1.1 United States
- 5.5.1.2 Canada
- 5.5.1.3 Mexico
- 5.5.2 Europe
- 5.5.2.1 Germany
- 5.5.2.2 United Kingdom
- 5.5.2.3 France
- 5.5.2.4 Russia
- 5.5.2.5 Rest of Europe
- 5.5.3 Asia-Pacific
- 5.5.3.1 China
- 5.5.3.2 Japan
- 5.5.3.3 India
- 5.5.3.4 South Korea
- 5.5.3.5 Australia
- 5.5.3.6 Rest of Asia-Pacific
- 5.5.4 Middle East and Africa
- 5.5.4.1 Middle East
- 5.5.4.1.1 Saudi Arabia
- 5.5.4.1.2 United Arab Emirates
- 5.5.4.1.3 Rest of Middle East
- 5.5.4.2 Africa
- 5.5.4.2.1 South Africa
- 5.5.4.2.2 Egypt
- 5.5.4.2.3 Rest of Africa
- 5.5.4.1 Middle East
- 5.5.5 South America
- 5.5.5.1 Brazil
- 5.5.5.2 Argentina
- 5.5.5.3 Rest of South America
- 5.5.1 North America
6 COMPETITIVE LANDSCAPE
- 6.1 Market Concentration
- 6.2 Strategic Moves
- 6.3 Market Share Analysis
- 6.4 Company Profiles (includes Global level Overview, Market level overview, Core Segments, Financials as available, Strategic Information, Market Rank/Share for key companies, Products and Services, and Recent Developments)
- 6.4.1 Alibaba Group Holding Limited
- 6.4.2 Amazon.com, Inc.
- 6.4.3 ByteDance Ltd.
- 6.4.4 Kuaishou Technology
- 6.4.5 Meta Platforms, Inc.
- 6.4.6 Google LLC
- 6.4.7 Tencent Holdings Limited
- 6.4.8 Qurate Retail, Inc.
- 6.4.9 Mogu Inc.
- 6.4.10 Sea Limited
- 6.4.11 Pinduoduo Inc.
- 6.4.12 JD.com, Inc.
- 6.4.13 Flipkart Internet Private Limited
- 6.4.14 NTWRK Inc.
- 6.4.15 Bilibili Inc.
- 6.4.16 ShopShops Holdings Inc.
- 6.4.17 TalkShopLive, Inc.
- 6.4.18 CommentSold, Inc.
- 6.4.19 Bambuser AB
- 6.4.20 Livescale Technologies Inc.
7 MARKET OPPORTUNITIES AND FUTURE OUTLOOK
- 7.1 White-space and Unmet-Need Assessment


