

|
시장보고서
상품코드
2099091
동영상 컨텐츠 시장 : 점유율 분석, 업계 동향 및 통계, 성장 예측(2026-2031년)Video Content - Market Share Analysis, Industry Trends & Statistics, Growth Forecasts (2026 - 2031) |
||||||
 Mordor Intelligence
Mordor Intelligence에 의하면, 동영상 컨텐츠 시장 규모는 2025년에 5,483억 달러로 평가되었고 2026년 5,962억 달러에서 2031년까지 9,146억 달러에 이를 것으로 예측되며, 예측 기간(2026-2031년) CAGR은 8.94%를 나타낼 전망입니다.
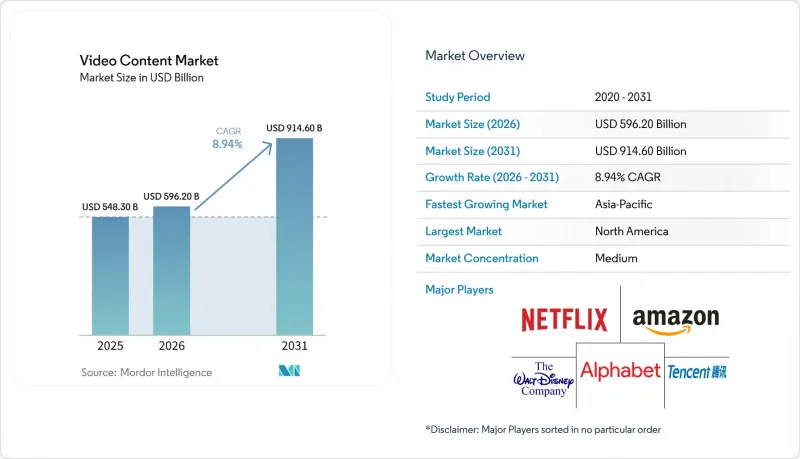
본 보고서는 제공 형태(OTT, IPTV, 케이블 TV, 유료 TV), 플랫폼(스마트 TV, 스마트폰·태블릿, 노트북·데스크톱 PC 등), 제공 형태(비디오 온 디맨드(VOD), 온라인 동영상), 지역(북미, 남미, 유럽, 아시아태평양, 중동 및 아프리카)별로 분류되어 있습니다. 시장 예측은 금액(달러) 기준으로 제시되어 있습니다.
전 세계 동영상 컨텐츠 시장 동향과 인사이트
라이브 및 온디맨드 동영상 소비량 증가
시청자들이 라이브 이벤트와 온디맨드 라이브러리를 동일한 시청 환경 내에서 이용할 수 있기를 기대하게 되면서, 동영상 컨텐츠 시장은 더욱 심화되고 있습니다. 넷플릭스는 2025년 하반기 960억 시청 시간을 기록했다고 보고했으며, 이는 초기 가입자 확대가 성숙기에 접어든 후에도 대규모 수요가 여전히 견조함을 보여줍니다. 동 보고서에 따르면, 넷플릭스는 2025년 12월 미국 TV 시청 점유율에서 9.0%에 달했으며, 이는 가정 내 시청 시간이 현재 어디에 소비되고 있는지에 있어 더 깊은 변화가 반영된 것입니다. JioHotstar는 2026년 2월, 자사 서비스가 19개 언어로 30만 시간 이상의 컨텐츠를 제공하고 있다고 발표했습니다. 이는 동영상 컨텐츠 시장 규모가 더 이상 카탈로그의 규모뿐만 아니라 접근의 폭에도 크게 좌우되고 있음을 보여줍니다. 라이브 스포츠, 연속 드라마, 숏폼 컨텐츠의 시청은 서로 분리된 컨텐츠 카테고리로 기능하기보다는 서로를 보완하는 경향이 강해지고 있습니다. 이로 인해 동영상 컨텐츠 시장은 더욱 참여도 주도형으로 변화하고 있습니다. 사용자가 여러 포맷을 넘나들며 지속적으로 이용하도록 유도하는 플랫폼일수록, 세션당 수익화율을 높일 가능성이 커지기 때문입니다.
구독 및 광고 기반 모델의 확대
동영상 컨텐츠 시장은 하이브리드형 수익화 모델로 전환되고 있습니다. 이는 광고 지원형 접근이 도달 범위를 확대하는 한편, 유료 요금제가 프리미엄 사용자로부터의 수익을 꾸준히 확보하고 있기 때문입니다. 넷플릭스는 2025년 광고 수익이 15억 달러를 넘어설 것이며, 2026년에는 이 사업이 약 2배로 더 확대될 것으로 전망한다고 발표했습니다. 이는 광고가 단순한 부수적인 제품 라인이 아니라 성장의 핵심 동력이 되고 있음을 뒷받침하는 것입니다. 디즈니는 2025 회계연도에 ‘직접 투 컨슈머(Direct-to-Consumer)’ 부문이 246억 달러의 매출을 기록했으며, 2026 회계연도에는 13억 2,700만 달러의 영업이익을 기록했다고 보고했습니다. 이는 대형 서비스 사업자가 스트리밍 규모 확대와 더욱 견실한 이익 실적을 동시에 달성할 수 있음을 보여줍니다. 이러한 변화가 중요한 이유는 저렴한 광고 포함 요금제가 반복되는 구독료 인상에 거부감을 느끼면서도 컨텐츠에 대한 완전한 접근을 원하는 시청자를 유지하는 데 도움이 되기 때문입니다. 또한, 동영상 컨텐츠 시장이 더 이상 단일하고 획일적인 가격 체계에 의존하지 않으며, 플랫폼이 총 시청자 수를 잃지 않으면서도 사용자를 세분화할 여지가 넓어지고 있다는 점에서도 중요합니다. 여러 사용자 그룹에 걸쳐 구독, 광고, 번들 이용 간의 균형을 잘 맞출 수 있는 기업이 동영상 컨텐츠 시장에서 더욱 견고한 입지를 다질 가능성이 높습니다.
뿌리 깊은 컨텐츠 불법 복제 문제와 계정 공유
불법 복제는 유료화 전환을 저해하고, 라이선스된 컨텐츠 권리의 가치를 훼손하기 때문에 여전히 동영상 컨텐츠 시장에 대한 직접적인 제약 요인으로 작용하고 있습니다. VAUNET이 인용한 조사에 따르면, 2025년 독일에서 불법 TV 스트리밍으로 인해 24억 유로(25억 9,000만 달러 상당)의 경제적 손실이 발생했으며, 그 총액은 2022년 대비 33% 증가한 것으로 추정됩니다. 또한, 아시아 동영상 산업 협회(Asia Video Industry Association)도 2026년 6월, 조직적인 인증 정보 도용 및 상업화된 재스트리밍이 아시아태평양 전체에 걸쳐 큰 위협이 되고 있다고 경고하며, 이러한 네트워크를 신원 도용 사기 및 계정 탈취의 위험과 연관 지었습니다. 이 문제는 단순한 우발적인 무단 시청에 그치지 않습니다. 조직적인 접근 권한 재판매가 현재는 지역이나 기기 유형을 불문하고 대규모로 이루어지고 있기 때문입니다. 불법 스트리밍이 여전히 쉽게 발견되고 더 저렴하게 접근할 수 있는 상황에서는 독점 컨텐츠의 효과가 희석될 수밖에 없습니다. 동영상 컨텐츠 시장에서 플랫폼은 비밀번호 관리를 강화함으로써 수익화를 개선할 수 있을지 모르지만, 무단 대체 수단이 여전히 광범위하고 편리한 접근을 제공하는 한 그 이익은 계속해서 위협받을 것입니다.
부문 분석
2025년, OTT 컨텐츠는 전 세계 동영상 컨텐츠 시장 매출의 42.47%를 차지하며 최대 제공 부문이 되었습니다. 또한 2031년까지 연평균 성장률(CAGR) 12.22%라는 가장 높은 성장률을 나타낼 것으로 예측됩니다. 이러한 규모와 성장의 조합은 인터넷을 통해 배포되는 컨텐츠가 수익화, 시청 행동, 기기 도달 범위 측면에서 여전히 가장 적응성이 높은 모델임을 보여줍니다. OTT 동영상 컨텐츠 시장 규모는 구독형 요금제, 광고 포함 요금제, 라이브 이벤트, 온디맨드 카탈로그가 단일 서비스 환경 내에서 공존할 수 있는 구조 덕분에 계속해서 혜택을 보고 있습니다. 넷플릭스는 2026년 1분기 매출이 전년 동기 대비 16.2% 증가한 122억 5,000만 달러를 기록했다고 보고했으며, 이는 지역을 불문하고 프리미엄 디지털 시청 수요가 계속해서 견조함을 반영합니다. 또한 OTT는 기반이 되는 접속 모델을 변경하지 않고도 팟캐스트, 단편 동영상, 스포츠 생중계 등을 추가할 수 있어 그 역할을 지속적으로 확대되고 있습니다.
IPTV는 통신 사업자들이 여전히 광대역 고객 유지 및 가정용 서비스 번들화를 지원하기 위해 활용하고 있어 그 중요성을 유지하고 있습니다. 방고(Bango)는 2026년 6월, 가입자 수 4,300만 명 이상을 보유한 터크셀(Tarkcell)이 자사의 ‘디지털 벤딩 머신’을 채택하여 대규모 다자간 구독 번들을 출시했다고 발표했습니다. 이는 통신 사업자와 연계된 패키징이 유료 디지털 컨텐츠에 대한 접근성을 확대하기 위해 어떻게 활용되고 있는지를 보여줍니다. 케이블 TV와 유료 TV는 많은 시장에서 점유율이 계속 하락하고 있지만, 스포츠나 뉴스의 실시간 시청이 여전히 가정의 일상이 된 지역에서는 여전히 일정한 가치를 유지하고 있습니다. 동영상 컨텐츠 시장 점유율에서는 여전히 OTT가 우위를 점하고 있습니다. 이는 시청자의 제어권, 유연한 가격 책정, 화면의 이동성 등의 요소가 고정된 일정에 따른 방송보다 현재의 시청 행태에 더 부합하기 때문입니다. 유럽에서는 컨텐츠 구성 또한 OTT 서비스의 경쟁적 위치를 좌우하고 있습니다. 유럽 시청각 관측소(European Audiovisual Observatory)의 조사에 따르면, 2025년 EU 27개국의 VOD 카탈로그 중 48%를 미국 작품이 차지하는 반면, EU 27개국 작품은 22%에 그쳤기 때문입니다. 이러한 균형은 동영상 컨텐츠 시장의 일부에서 플랫폼의 도달 범위와 마찬가지로 지역별 카탈로그 전략이 중요한 이유를 보여줍니다.
지역별 분석
2025년, 북미는 전 세계 동영상 컨텐츠 시장의 36.58%를 차지하며, 금액 기준으로 최대 지역 기여자라는 지위를 유지했습니다. 이 지역이 여전히 중요하게 여겨지는 이유는 수익화 수준이 높고, 프리미엄 컨텐츠 권리 취득 비용이 비싸며, 주요 플랫폼 간의 경쟁이 다른 대부분의 지역보다 성숙해 있기 때문입니다. 2026년 1월, 넷플릭스와 워너 브라더스 디스커버리는 인수 계약을 전액 현금 거래로 수정했는데, 이는 북미의 경쟁이 규모, 컨텐츠 카탈로그 관리, 스튜디오 소유권과 점점 더 밀접하게 연결되어 있음을 보여줍니다. 또한, DAZN은 2026년 4월, 미국 내 사업 확장을 가속화하고 스포츠 팀 및 권리 보유자를 위한 D2C(Direct-to-Consumer) 솔루션을 강화하기 위해 ViewLift 인수를 합의했습니다. 이러한 움직임은 북미 동영상 컨텐츠 시장이 더 이상 단순한 가입자 확보 경쟁에 그치지 않고, 권리, 기술 소유권, 그리고 비즈니스 모델의 지배권을 둘러싼 경쟁으로 번지고 있음을 보여줍니다.
유럽은 여전히 동영상 컨텐츠 시장의 주요 시청 지역이며, 한편 남미에서는 모바일 접속, 스포츠에 대한 관심, 광고 수익을 통한 사업 확장을 통해 계속해서 성장세를 보이고 있습니다. 유럽 시청각 관측소(European Audiovisual Observatory)의 보고서에 따르면, 2025년 EU 27개국의 VOD 카탈로그 중 48%를 미국 작품이 차지하는 반면, EU 27개국 작품은 22%에 그쳐, 국제적 규모와 현지 컨텐츠의 충실도 사이에서 균형을 맞출 필요성이 부각되었습니다. 카탈로그 구성은 플랫폼의 매력, 규제상 위치, 그리고 현지 파트너십 전략에 영향을 미치기 때문에 이러한 균형은 중요합니다. 남미는 현재 시장 규모는 작지만, 스포츠 중심의 시청자층과 가격에 민감한 사용자들이 AVOD 및 번들형 접속 모델을 뒷받침하고 있어 동영상 컨텐츠 시장에서의 가치가 높아지고 있습니다. DAZN은 2026년 6월, 2026년 FIFA 월드컵 중계를 위해 남미 5개국에서 ‘DSPORTS Network’를 전개할 것이라고 발표했습니다. 이는 이벤트 중심의 스트리밍을 통해 지역적 성장을 추구하고 있음을 보여줍니다.
아시아태평양은 2031년까지 동영상 컨텐츠 시장에서 13.12%라는 가장 높은 연평균 성장률(CAGR)을 보일 것으로 예측되며, 예측 기간 동안 주요 지역 성장의 원동력이 될 전망입니다. 이 지역은 모바일 우선 이용 경향, 디지털화의 급속한 확산, 폭넓은 언어 다양성, 그리고 성숙한 유럽 및 미국 시장에 비해 광고 수익형 시청의 비중이 더 크다는 장점을 가지고 있습니다. JioHotstar는 2026년 2월, 19개 언어로 30만 시간 이상의 프로그램을 제공하고 있으며, JioStar의 TV 및 스트리밍을 통해 매주 8억 명 이상의 시청자에게 도달하고 있다고 발표했습니다. 이는 인도에서 현지 언어 및 멀티 포맷을 통한 컨텐츠 제공이 현재 어느 정도의 규모로 전개되고 있는지를 반영합니다. 중동 및 아프리카는 현재 시장 규모가 아직 작지만, 통신사와의 제휴를 통한 배포로 접근성이 개선되어 직접적인 구독 확보의 장벽이 낮아지고 있습니다. Bango사에 따르면, Turkcell사는 자사의 5G 전개 전략에 부합하는 ‘슈퍼 번들’을 출시했다고 합니다. 이는 통신 사업자 주도의 패키지 상품이 모바일 중심 시장에서 컨텐츠 보급을 얼마나 가속화할 수 있는지를 보여줍니다. 아시아태평양과 중동 및 아프리카 모두에서 현지 언어 접근성, 모바일 편의성, 그리고 번들 상품을 통한 합리적인 가격이 어우러져 동영상 컨텐츠 시장이 착실히 입지를 다져가고 있습니다.
기타 혜택:
- 엑셀 형식 시장 예측(ME) 시트
- 3개월간의 애널리스트 지원
자주 묻는 질문
목차
제1장 서론
제2장 조사 방법
제3장 주요 요약
제4장 시장 구도
제5장 시장 규모와 성장 예측
제6장 경쟁 구도
제7장 시장 기회와 향후 전망
JHS 26.08.05According to Mordor Intelligence, the video content market size was valued at USD 548.30 billion in 2025 and estimated to grow from USD 596.20 billion in 2026 to reach USD 914.60 billion by 2031, at a CAGR of 8.94% during the forecast period (2026-2031).
This report is Segmented by Offering (Over-The-Top (OTT), Internet Protocol TV (IPTV), Cable TV, and Pay-TV), Platform (Smart TVs, Smartphones and Tablets, Laptops and Desktops, and More), Deployment Type (Video-On-Demand (VOD), and Online Video), and Geography (North America, South America, Europe, Asia-Pacific, Middle East, and Africa). The Market Forecasts are Provided in Terms of Value (USD).
Global Video Content Market Trends and Insights
Rising Live And On-Demand Video Consumption
The video content market is gaining depth because audiences now expect live events and on-demand libraries to sit inside the same viewing environment. Netflix reported 96 billion viewing hours in the second half of 2025, which showed that large-scale demand remained strong even after earlier subscriber expansion matured. The same filing stated that Netflix reached a 9.0% share of U.S. television viewing in December 2025, which reflected a deeper shift in where household viewing time is now being spent. JioHotstar said in February 2026 that its service offered more than 300,000 hours of content in 19 languages, which showed how scale in the video content market now depends on breadth of access as much as on catalog size alone. Live sports, serialized programming, and short-format viewing are increasingly reinforcing one another instead of operating as isolated content categories. This is making the video content market more engagement-led, because the platforms that keep users moving across multiple formats have a better chance of lifting monetization per session.
Expansion Of Subscription And Advertising-Based Models
The video content market is moving toward hybrid monetization because ad-supported access is now widening reach while paid tiers continue to protect revenue from premium users. Netflix stated that ad revenue exceeded USD 1.5 billion in 2025 and that it expected this business to roughly double again in 2026, which confirmed that advertising has become a central growth lever rather than a secondary product line. Disney reported that its Direct-to-Consumer segment generated USD 24.6 billion in revenue in fiscal year 2025 and then delivered USD 1.327 billion in operating income in fiscal year 2026, which showed that large services can pair scale streaming with stronger profit outcomes. This shift matters because lower-price ad tiers help retain viewers who may resist repeated subscription price increases but still want full content access. It also matters because the video content market is no longer relying on one universal pricing structure, and that creates more room for platforms to segment users without losing total audience reach. The companies that can balance subscriptions, advertising, and bundled access across several user groups are likely to hold a stronger position in the video content market.
Persistent Content Piracy And Credential Sharing
Piracy remains a direct constraint on the video content market because it weakens paid conversion and erodes the value of licensed content rights. A study cited by VAUNET estimated that illegal TV streaming caused EUR 2.4 billion in economic losses in Germany in 2025, equal to USD 2.59 billion, and that the total was 33% higher than in 2022. The Asia Video Industry Association also warned in June 2026 that organized credential theft and commercialized re-streaming had become major threats across Asia-Pacific, and it linked those networks with identity fraud and account takeover risk. This problem is not limited to casual unauthorized viewing, because organized access resale can now operate at scale across regions and device types. That dynamic makes exclusive content less effective when illegal distribution remains easy to find and cheaper to access. In the video content market, platforms may improve monetization with tighter password controls, but those gains remain exposed if unauthorized alternatives still offer broad and convenient access.
Other drivers and restraints analyzed in the detailed report include:
- Growth In Cloud-Native Video Delivery And Playback
- Increasing Demand For Localized And Low-Latency Content
- Rising Premium Content Acquisition And Production Costs
For complete list of drivers and restraints, kindly check the Table Of Contents.
Segment Analysis
OTT content held 42.47% of global video content market revenue in 2025, which made it the largest offering segment, and it is also projected to record the fastest CAGR of 12.22% through 2031. This combination of scale and growth shows that internet-delivered content remains the most adaptable model across monetization, viewing behavior, and device reach. The video content market size for OTT continues to benefit from the way subscription plans, ad tiers, live events, and on-demand catalogs can coexist inside one service environment. Netflix reported Q1 2026 revenue of USD 12.25 billion, up 16.2% year over year, which reflected continuing strength in premium digital viewing demand across regions. OTT also keeps extending its role because podcasts, short-form viewing, and live sports can be added without changing the underlying access model.
IPTV remains relevant because telecom operators still use it to support broadband retention and household service bundling. Bango said in June 2026 that Turkcell, with more than 43 million subscribers, selected its Digital Vending Machine to launch major multi-party subscription bundles, which showed how telecom-linked packaging is being used to widen access to paid digital content. Cable TV and pay-TV continue to lose ground in many markets, but they still hold residual value where linear sports and news viewing remain part of household routines. The video content market share still favors OTT because viewer control, flexible pricing, and screen portability are more aligned with current behavior than fixed-schedule delivery. In Europe, content mix also shapes the competitive position of OTT services, because the European Audiovisual Observatory found that U.S. works accounted for 48% of VOD catalogue presences in the EU27 in 2025 while EU27 works represented 22%. That balance shows why local catalog strategy matters as much as platform reach in parts of the video content market.
Complete Report Scope:
- By Offering
- Over-The-Top (OTT)
- Internet Protocol TV (IPTV)
- Cable TV
- Pay-TV
- By Platform
- Smart TVs
- Smartphones and Tablets
- Laptops and Desktops
- Other Platforms
- By Deployment Type
- Video-on-Demand (VOD)
- Online Video
- By Geography
- North America
- United States
- Canada
- Mexico
- South America
- Brazil
- Argentina
- Chile
- Rest of South America
- Europe
- Germany
- United Kingdom
- France
- Italy
- Spain
- Rest of Europe
- Asia-Pacific
- China
- Japan
- India
- South Korea
- Australia
- Rest of Asia-Pacific
- Middle East
- Saudi Arabia
- United Arab Emirates
- Qatar
- Rest of Middle East
- Africa
- South Africa
- Egypt
- Nigeria
- Rest of Africa
- North America
Geography Analysis
North America held 36.58% of the global video content market in 2025, which kept it as the largest regional contributor by value. The region remains important because monetization is deeper, premium rights spending is higher, and major platform competition is more mature than in most other regions. Netflix and Warner Bros. Discovery amended their acquisition agreement to an all-cash transaction in January 2026, which showed how North American competition is increasingly tied to scale, catalog control, and studio ownership. DAZN also agreed to acquire ViewLift in April 2026 to accelerate its U.S. expansion and strengthen direct-to-consumer solutions for sports teams and rights holders. These moves show that the video content market in North America is no longer just a battle for subscribers, and is now also a battle for rights, technology ownership, and business model control.
Europe remains a major viewing region in the video content market, while South America continues to build momentum through mobile access, sports interest, and ad-supported expansion. The European Audiovisual Observatory reported that U.S. works represented 48% of VOD catalogue presences in the EU27 in 2025, while EU27 works accounted for 22%, which highlighted the pressure to balance international scale with local content depth. That balance matters because catalog composition affects platform appeal, regulatory positioning, and local partnership strategy. South America has a smaller current footprint, but its value in the video content market is rising because sports-led viewership and price-sensitive users support AVOD and bundled access models. DAZN said in June 2026 that it would bring the DSPORTS Network across 5 South American countries for FIFA World Cup 2026 coverage, which showed how regional growth is being pursued through event-led distribution.
Asia-Pacific is projected to record the fastest CAGR in the video content market at 13.12% through 2031, which makes it the primary regional growth engine over the forecast period. The region benefits from mobile-first usage, fast digital adoption, broad language diversity, and a stronger role for ad-funded viewing than in mature Western markets. JioHotstar said in February 2026 that it offered more than 300,000 hours of programming in 19 languages and reached over 800 million viewers weekly across JioStar television and streaming, which reflected the scale at which local language and multi-format delivery now operate in India. The Middle East and Africa remain smaller in current value, but telco-linked distribution is improving access and lowering the friction of direct subscription acquisition. Bango said Turkcell launched super bundles aligned with its 5G rollout strategy, which illustrated how telecom-led packaging can accelerate content adoption in mobile-centered markets. Across both Asia-Pacific and the Middle East and Africa, the video content market is gaining ground where local language access, mobile usability, and bundled affordability come together.
- Netflix Inc.
- Amazon.com, Inc.
- The Walt Disney Company
- Alphabet Inc.
- Tencent Holdings Limited
- Apple Inc.
- Warner Bros. Discovery, Inc.
- Paramount Global
- Comcast Corporation
- Hulu, LLC
- Roku, Inc.
- Kaltura, Inc.
- Vimeo, Inc.
- Akamai Technologies, Inc.
- Brightcove Inc.
- Haivision Systems Inc.
- Wowza Media Systems, LLC
- iQIYI, Inc.
- DAZN Group Limited
- Jio Platforms Limited
- PCCW Media Limited
- Zee Entertainment Enterprises Limited
Additional Benefits:
- The market estimate (ME) sheet in Excel format
- 3 months of analyst support
TABLE OF CONTENTS
1 INTRODUCTION
- 1.1 Study Assumptions and Market Definition
- 1.2 Scope of the Study
2 RESEARCH METHODOLOGY
3 EXECUTIVE SUMMARY
4 MARKET LANDSCAPE
- 4.1 Market Overview
- 4.2 Market Drivers
- 4.2.1 Rising Live and On-Demand Video Consumption
- 4.2.2 Expansion of Subscription and Advertising Based Monetization
- 4.2.3 Growth in Cloud-Native Video Delivery and Playback Infrastructure
- 4.2.4 Increasing Demand for Localized and Low-Latency Streaming Experiences
- 4.2.5 AI Assisted Dubbing, Captioning, and Personalization at Scale
- 4.2.6 Telco Bundling and Zero-Rating Support for Premium Video Access
- 4.3 Market Restraints
- 4.3.1 Persistent Content Piracy and Credential Sharing
- 4.3.2 Rising Premium Content Acquisition and Production Costs
- 4.3.3 Fragmented Codec, DRM, and Device Compatibility Standards
- 4.3.4 Energy and Carbon Intensity Pressure on Large Scale Streaming Operations
- 4.4 Industry Value Chain Analysis
- 4.5 Impact of Macroeconomic Factors on the Market
- 4.6 Regulatory Landscape
- 4.7 Technological Outlook
- 4.8 Porter's Five Forces Analysis
- 4.8.1 Threat of New Entrants
- 4.8.2 Bargaining Power of Suppliers
- 4.8.3 Bargaining Power of Buyers
- 4.8.4 Threat of Substitutes
- 4.8.5 Competitive Rivalry
5 MARKET SIZE AND GROWTH FORECASTS (VALUE)
- 5.1 By Offering
- 5.1.1 Over-The-Top (OTT)
- 5.1.2 Internet Protocol TV (IPTV)
- 5.1.3 Cable TV
- 5.1.4 Pay-TV
- 5.2 By Platform
- 5.2.1 Smart TVs
- 5.2.2 Smartphones and Tablets
- 5.2.3 Laptops and Desktops
- 5.2.4 Other Platforms
- 5.3 By Deployment Type
- 5.3.1 Video-on-Demand (VOD)
- 5.3.2 Online Video
- 5.4 By Geography
- 5.4.1 North America
- 5.4.1.1 United States
- 5.4.1.2 Canada
- 5.4.1.3 Mexico
- 5.4.2 South America
- 5.4.2.1 Brazil
- 5.4.2.2 Argentina
- 5.4.2.3 Chile
- 5.4.2.4 Rest of South America
- 5.4.3 Europe
- 5.4.3.1 Germany
- 5.4.3.2 United Kingdom
- 5.4.3.3 France
- 5.4.3.4 Italy
- 5.4.3.5 Spain
- 5.4.3.6 Rest of Europe
- 5.4.4 Asia-Pacific
- 5.4.4.1 China
- 5.4.4.2 Japan
- 5.4.4.3 India
- 5.4.4.4 South Korea
- 5.4.4.5 Australia
- 5.4.4.6 Rest of Asia-Pacific
- 5.4.5 Middle East
- 5.4.5.1 Saudi Arabia
- 5.4.5.2 United Arab Emirates
- 5.4.5.3 Qatar
- 5.4.5.4 Rest of Middle East
- 5.4.6 Africa
- 5.4.6.1 South Africa
- 5.4.6.2 Egypt
- 5.4.6.3 Nigeria
- 5.4.6.4 Rest of Africa
- 5.4.1 North America
6 COMPETITIVE LANDSCAPE
- 6.1 Market Concentration
- 6.2 Strategic Moves
- 6.3 Vendor Positioning Analysis
- 6.4 Company Profiles (includes Global Level Overview, Market Level Overview, Core Segments, Financials as available, Strategic Information, Products and Services, Recent Developments)
- 6.4.1 Netflix Inc.
- 6.4.2 Amazon.com, Inc.
- 6.4.3 The Walt Disney Company
- 6.4.4 Alphabet Inc.
- 6.4.5 Tencent Holdings Limited
- 6.4.6 Apple Inc.
- 6.4.7 Warner Bros. Discovery, Inc.
- 6.4.8 Paramount Global
- 6.4.9 Comcast Corporation
- 6.4.10 Hulu, LLC
- 6.4.11 Roku, Inc.
- 6.4.12 Kaltura, Inc.
- 6.4.13 Vimeo, Inc.
- 6.4.14 Akamai Technologies, Inc.
- 6.4.15 Brightcove Inc.
- 6.4.16 Haivision Systems Inc.
- 6.4.17 Wowza Media Systems, LLC
- 6.4.18 iQIYI, Inc.
- 6.4.19 DAZN Group Limited
- 6.4.20 Jio Platforms Limited
- 6.4.21 PCCW Media Limited
- 6.4.22 Zee Entertainment Enterprises Limited
7 MARKET OPPORTUNITIES AND FUTURE OUTLOOK
- 7.1 White-Space and Unmet-Need Assessment


