

|
시장보고서
상품코드
2100013
조명 산업 전자상거래 시장 : 점유율 분석, 업계 동향 및 통계, 성장 예측(2026-2031년)E-commerce for Lighting Industry - Market Share Analysis, Industry Trends & Statistics, Growth Forecasts (2026 - 2031) |
||||||
 Mordor Intelligence
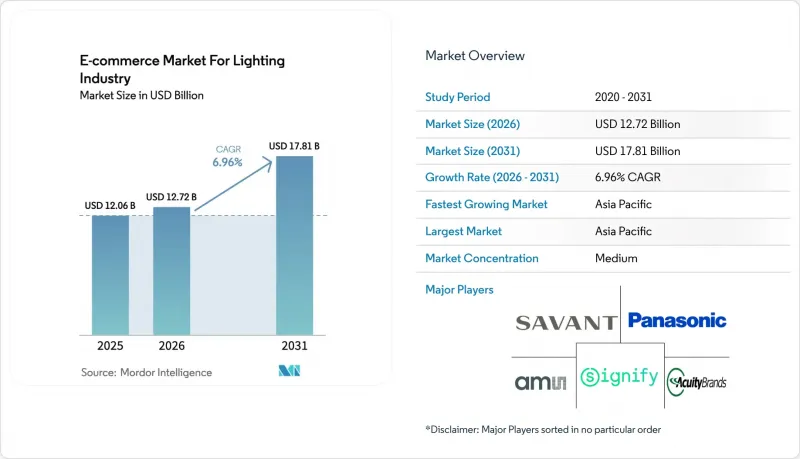
Mordor Intelligence에 의하면, 조명 산업 전자상거래 시장 규모는 2025년에 120억 6,000만 달러로 평가되었고 2026년 127억 2,000만 달러에서 2031년까지 178억 1,000만 달러에 이를 것으로 예측되며, 예측 기간(2026-2031년) CAGR은 6.96%를 나타낼 전망입니다.
본 보고서는 최종 사용자별(주거, 상업, 산업, 지자체 및 정부), 제품 유형별(LED 조명 기구, LED 전구 및 램프 등), 판매 채널별(브랜드 직영 웹사이트 등), 배송 모델별(일반 배송, 특급·당일 배송, 클릭 앤 콜렉트, 드롭쉬핑), 지역별로 분류되어 있습니다. 시장 전망은 금액(달러) 기준으로 제시되어 있습니다.
조명 산업 전자상거래 시장 인사이트 및 동향
백열전구의 단계적 폐지 관련 정부 규제
2024년 12월 미국 에너지부가 공표한 규정에 따라, 범용 램프는 2028년 1월까지 1와트당 120루멘의 광속 효율을 달성해야 하며, 이로 인해 백열전구 및 대부분의 할로겐 램프가 소매점이나 온라인 스토어에서 사실상 퇴출될 것입니다. 유럽연합(EU), 캐나다, 호주에서의 유사한 규제가 더해지면서 LED로의 전환이 가속화되고, 카탈로그 상품 구성이 정리되는 동시에 소비자들은 규정을 준수하는 대체품으로 유도되고 있습니다. 인증 포털에서는 제품을 등록하기 전에 광도 측정 시험 결과를 업로드해야 하므로, 사내에 시험실을 갖추지 않은 소규모 판매업체의 경우 시장 진입 장벽이 높아지고 있습니다. 구형 재고의 최종 처분 세일로 인해 쇼핑객들은 LED 가격이 기존 제품과 동등해질 것으로 기대하게 되었으며, 주요 마켓플레이스에서 고효율 전구에 대한 검색 트래픽이 증가하고 있습니다. 캘리포니아주와 뉴욕주의 전력 회사는 현재 일괄 전자 조달 포털을 통해 구매된 LED 스타터 키트를 우편으로 발송하고 있으며, 조명 기구의 온라인 구매가 정착되면서 장기적인 디지털 구매 습관이 형성되고 있습니다.
에너지 절약형 LED 조명 기구의 보급 확대
상업시설 소유주들은 2021년판 국제 에너지 절약 기준(IECC)에서 도입된 더 엄격한 전력 밀도 상한선을 충족하기 위해 형광등 트로퍼나 HID 베이 조명을 LED 패널로 개조하고 있습니다. 미국 에너지부의 ‘베터 빌딩스(Better Buildings)’ 프로그램에 따르면, LED로 전환한 사무실의 경우 평균 회수 기간이 1.4-2.7년이며, 유지 관리비 절감률은 최대 80%에 달하는 것으로 보고되었습니다. 시그니파이(Signify)는 2024년 3분기 매출 16억 4,700만 유로(18억 1,000만 달러) 중 87%가 LED 제품에서 비롯된 것이라고 보고하며, 고효율 조명 기구로의 전 세계적 전환을 뒷받침하고 있습니다. 아시아태평양 각국 정부는 도입을 더욱 추진하고 있으며, 인도에서는 공공 건축물에 LED 사용이 의무화되었고, 중국의 ‘제14차 5개년 계획’에서는 상업시설 내 LED 보급률 70%를 목표로 하고 있어, 이에 따라 인증된 조명 기구를 한곳에 모아 제공하는 B2B 전자상거래 포털에 대한 수요가 더욱 높아지고 있습니다. 루멘 출력이나 CCT(색온도)를 필터링할 수 있는 온라인 필터 덕분에 조달 주기가 몇 주에서 며칠로 단축되어 지역 계약업체들에게도 이점을 제공합니다.
운송 중 제품 파손으로 인한 높은 반품률
전미소매협회(NRF) 보고서에 따르면, 2024년 조명 기구의 온라인 반품률은 17.6%를 기록하여 내구재 카테고리 중 가장 높은 수치를 보였습니다. 운송사가 도입한 부피 중량 과금제로 인해 저밀도 펜던트 조명의 배송비가 상대적으로 비싸져, 판매자가 정가를 인상하지 않는 한 이익률이 압박받고 전환율 하락 위험도 발생합니다. 무료 반품 정책으로 인해 구매자들은 여러 가지 색온도를 시험해 보게 되었고, 이에 따라 역물류 처리량이 증가하고 있습니다. 한편, 지방 배송지에서는 여전히 며칠이 소요되는 육상 운송 서비스에 의존하고 있어, 이로 인해 처리 과정이 늘어나고 파손 위험이 높아지고 있습니다.
부문 분석
2025년, 조명 산업 전자상거래 시장 점유율의 58.54%를 주거용 고객층이 차지했습니다. 이는 백열 전구를 익일 배송이 가능한 제품군에서 구할 수 있는 음성 제어 지원 LED로 교체하는 DIY(직접 수리) 방식의 개조가 뒷받침하고 있습니다. 상호 운용성이 향상됨에 따라 주택 소유자는 여러 브랜드의 세트 상품을 구매할 수 있게 되었으며, 전구 교체 주기가 10년으로 늘어났음에도 불구하고 평균 주문 금액은 상승하고 있습니다.
법인 고객의 경우, 현재 지출 규모는 작지만, 임대인이 지방자치단체의 에너지 기준법이나 임차인의 건강·복지에 대한 기대에 부응하기 위해 개보수를 실시함에 따라 2031년까지 연평균 성장률(CAGR) 7.83%로 확대될 것으로 예측됩니다. 와트당 100루멘 이상을 의무화하는 연방 정부의 조달 규정에 따라, 사양 결정권자들은 사전 인증을 받은 SKU를 선택하게 되었으며, B2B 포털에서의 입찰 기간이 단축되고 있습니다. 조명 산업 전자상거래 시장 규모는 클릭 한 번으로 수천 개의 센서 내장 조명 기구를 발주하는 지자체의 스마트 시티 입찰로부터도 혜택을 받고 있습니다.
LED 전구 및 램프는 2025년 매출의 38.43%를 차지했으나, 전 세계 마켓플레이스에서 범용 A19 전구가 2달러 미만으로 판매되고 있어 가격 하락 압력에 직면해 있습니다. 한편, 스마트 제어 장치는 Matter 인증을 받은 리모델링용 조광기가 기존 LED 소켓을 활용하고, 공급업체에 정기 수익형 펌웨어 및 클라우드 스토리지 수익을 가져다주기 때문에 연평균 성장률(CAGR) 7.42%를 나타낼 것으로 예측됩니다.
스마트 제어와 연동되는 조명 산업 전자상거래 시장은 프리미엄 가격 책정 외에도 에너지 소비량 및 재실 상황을 모니터링하는 구독형 분석 기능의 혜택을 받고 있습니다. 대조적으로, 기존 형광등 및 할로겐 램프 SKU는 2028년 미국 에너지부(DOE)의 규제로 인해 1와트당 120루멘 미만의 램프가 소매 채널에서 퇴출된 후, 두 자릿수 감소율을 기록하며 축소될 것으로 전망됩니다.
지역별 분석
최대 시장인 아시아태평양은 2025년에 매출의 40.42%를 차지하며, 인도의 2선 도시와 인도네시아의 대도시권에서 LED 전구의 2시간 이내 퀵커머스 배송이 급속히 보급됨에 따라, 2031년까지 연평균 성장률(CAGR) 8.31%를 나타낼 것으로 전망됩니다. 중국의 ‘제14차 5개년 계획’에서는 상업시설 내 LED 보급률을 70%로 하는 목표가 설정되어 있으며, 국가 입찰이 국내 전자 조달 사이트로 유도되고 있습니다. UPI 및 GrabPay를 통한 모바일 결제의 보급으로, 그동안 착불 결제 제약에 시달리던 새로운 계층의 쇼핑객들이 시장에 진입하고 있습니다.
북미는 조명 산업 전자상거래 시장에서 2위를 차지하고 있습니다. 이는 각 주의 엄격한 에너지 규제, 광범위한 당일 배송 네트워크, 그리고 광대역 이용 가구의 50%를 넘어선 스마트 홈 보급에 힘입은 결과입니다. B2B 포털은 계약업체의 ERP 시스템과 연동되어 있어, 전기 기술자는 부품 명세서(BOM)를 자동으로 가져와 몇 분 만에 발주서를 작성할 수 있습니다. 유럽에서는 ‘디지털 서비스법’을 배경으로 꾸준한 성장이 나타나고 있습니다. 이 법은 안전 기준을 충족하지 않는 수입품을 배제하고 소비자의 신뢰를 강화하는 한편, 저가 상품 수입에 대해 마켓플레이스에 부가가치세(VAT) 부담을 의무화하고 있습니다. 파리, 베를린, 마드리드의 퀵 커머스 거점에서는 2시간 이내 배송이 보장되고 있지만, 국경을 넘는 주문 처리(fulfillment)에 있어서는 재활용 요금 제도의 차이나 통관 신고와 같은 과제가 여전히 남아 있습니다.
중동의 성장세는 스마트 시티 계획에서 비롯되고 있습니다. 사우디아라비아의 5,000억 달러 규모 ‘NEOM’ 프로젝트에서는 대기질 센서가 탑재된 네트워크형 가로등의 도입이 예정되어 있어, 새로운 대규모 전자 입찰 워크플로가 창출되고 있습니다. 남미에서는 높은 수입 관세가 과제로 대두되고 있지만, 상파울루에서는 전기 요금 급등을 억제하기 위해 전력 회사가 LED 조명 구매 보조금을 지급하고 있어 국지적인 성장이 나타나고 있습니다. 아프리카에서는 전자상거래 보급률이 5% 미만으로 아직 초기 단계이지만, 케냐와 나이지리아에서는 모바일 머니를 통해 결제되는 태양광 LED 키트가 점차 보급되고 있습니다.
기타 혜택:
- 엑셀 형식 시장 예측(ME) 시트
- 3개월간의 애널리스트 지원
자주 묻는 질문
목차
제1장 서론
제2장 조사 방법
제3장 주요 요약
제4장 시장 구도
제5장 시장 규모와 성장 예측
제6장 경쟁 구도
제7장 시장 기회와 향후 전망
JHS 26.08.11According to Mordor Intelligence, the e-commerce market for lighting industry size was valued at USD 12.06 billion in 2025 and is estimated to grow from USD 12.72 billion in 2026 to reach USD 17.81 billion by 2031, at a CAGR of 6.96% during the forecast period (2026-2031).
This report is Segmented by End-User (Residential, Commercial, Industrial, and Municipal and Government), Product Type (LED Fixtures, LED Bulbs and Lamps, and More), Sales Channel (Brand-Owned Websites, and More), Delivery Model (Standard Shipping, Express/Same-Day Delivery, Click-And-Collect, and Drop Shipping), and Geography. The Market Forecasts are Provided in Terms of Value (USD).
Insights and Trends of E-commerce Market for Lighting Industry
Government Mandates for Phase-Out of Incandescent Bulbs
A December 2024 United States Department of Energy rule obligates general service lamps to reach 120 lumens per watt efficacy by January 2028, effectively eliminating incandescent and most halogen SKUs from retail and digital shelves. Similar bans in the European Union, Canada and Australia converge to force accelerated LED substitution, trimming catalog clutter and steering consumers toward compliant alternatives. Certification portals require photometric test uploads before a product can be listed, raising market-entry barriers for small sellers without in-house labs. Clearance discounts on the final wave of legacy inventory teach shoppers to expect LED price parity, boosting search traffic for high-efficacy bulbs on major marketplaces. Utilities in California and New York now mail LED starter kits purchased through bulk e-procurement portals, normalizing online acquisition for lighting fixtures and building long-term digital buying habits.
Rising Adoption of Energy-Efficient LED Fixtures
Commercial owners retrofit fluorescent troffers and HID bays with LED panels to meet tighter power-density caps that the International Energy Conservation Code 2021 introduced. The United States Department of Energy Better Buildings program documented average paybacks of 1.4-2.7 years and maintenance savings up to 80% for offices making the switch. Signify reported 87% of its EUR 1.647 billion (USD 1.81 billion) Q3 2024 sales came from LED-based products, underscoring the global skew toward high-efficacy luminaires. Asia-Pacific governments push adoption harder, India mandates LEDs in public buildings and China's 14th Five-Year Plan targets 70% LED penetration in commercial spaces, funneling incremental demand to B2B e-commerce portals that aggregate certified fixtures. Online filters for lumen output and CCT compress procurement cycles from weeks to days, benefiting regional contractors.
High Return Rates Due to Product Damage in Transit
Lighting fixtures posted a 17.6% online return rate during 2024, the highest among durable goods categories, as reported by the National Retail Federation. Dimensional-weight pricing introduced by carriers inflates shipping costs on low-density pendants, squeezing margins unless sellers raise list prices and risk lower conversion. Free-return policies encourage buyers to test multiple color temperatures, elevating reverse-logistics volumes, while rural addresses still rely on multi-day ground services that add handling touches and increase breakage risk.
Other drivers and restraints analyzed in the detailed report include:
- Proliferation of DIY Smart-Home Ecosystems
- Increasing Refurbishment of Commercial Real Estate
- Fragmented Regulations on Cross-Border E-commerce
For complete list of drivers and restraints, kindly check the Table Of Contents.
Segment Analysis
The residential customer base produced 58.54% of e-commerce market for lighting industry share in 2025, sustained by do-it-yourself upgrades that swap incandescent cans for voice-controlled LEDs available in next-day assortments. Growing interoperability lets homeowners order multi-brand bundles, raising average order values even as bulb replacement cycles climb to a decade.
Commercial buyers, although smaller in spending today, are expected to expand at 7.83% CAGR through 2031 as landlords retrofit to satisfy city energy benchmarking laws and tenant wellness expectations. Federal procurement rules that require >=100 lumens per watt push specifiers toward pre-certified SKUs, trimming bid timelines on B2B portals. The e-commerce market for lighting industry size also gains from municipal smart-city tenders that order thousands of sensor-embedded luminaires in one click.
LED bulbs and lamps captured 38.43% of 2025 revenue but face price erosion as generic A19 bulbs retail for under USD 2 on global marketplaces. Smart controls, however, are forecast to grow at 7.42% CAGR as Matter-certified retrofit dimmers exploit existing LED bases and create annuity-style firmware and cloud-storage income for vendors.
The e-commerce market for lighting industry attached to smart controls benefits from premium pricing and subscription analytics that monitor energy and occupancy. By contrast, traditional fluorescent and halogen SKUs decline in double digits after the 2028 DOE backstop removes sub-120-lumen-per-watt lamps from retail channels.
Complete Report Scope:
- By End-User
- Residential
- Commercial
- Industrial
- Municipal and Government
- By Product Type
- LED Fixtures
- LED Bulbs and Lamps
- Smart Lighting Controls
- Traditional Lighting
- By Sales Channel
- Brand-Owned Websites
- Third-Party Marketplaces
- Online Specialty Retailers
- By Delivery Model
- Standard Shipping
- Express/Same-Day Delivery
- Click-and-Collect
- Drop Shipping
- By Geography
- North America
- United States
- Canada
- Mexico
- South America
- Brazil
- Argentina
- Rest of South America
- Europe
- Germany
- United Kingdom
- France
- Spain
- Rest of Europe
- Asia-Pacific
- China
- Japan
- India
- South Korea
- Australia and New Zealand
- Rest of Asia-Pacific
- Middle East and Africa
- Middle East
- Saudi Arabia
- United Arab Emirates
- Turkey
- Rest of Middle East
- Africa
- South Africa
- Egypt
- Nigeria
- Rest of Africa
- Middle East
- North America
Geography Analysis
Asia-Pacific, the largest territory, held 40.42% of revenue in 2025 and is tracking an 8.31% CAGR through 2031 as tier-2 Indian cities and Indonesian metros leapfrog to two-hour quick-commerce deliveries of LED bulbs. China's 14th Five-Year Plan sets a 70% LED penetration target in commercial properties, channelling state tenders toward domestic e-procurement sites. Mobile payment ubiquity via UPI and GrabPay unlocks new cohorts of shoppers previously constrained by cash-on-delivery limitations.
North America ranks second in the e-commerce market for lighting industry, buoyed by stringent state energy codes, expansive same-day logistics grids and smart-home penetration that now exceeds 50% of broadband households. B2B portals integrate with contractor ERP systems, letting electricians auto-import BOMs and cut purchase orders in minutes.Europe grows steadily on the back of the Digital Services Act, which purges unsafe imports and fortifies consumer trust while requiring marketplaces to shoulder VAT on low-value entries. Quick-commerce nodes in Paris, Berlin and Madrid promise two-hour delivery, yet cross-border fulfillment still grapples with divergent recycling-fee regimes and customs declarations.
Middle East momentum stems from smart-city programs; Saudi Arabia's USD 500 billion NEOM earmarks networked streetlights with air-quality sensors, creating new bulk e-tender workflows. South America contends with high import tariffs but pockets of growth emerge in Sao Paulo where utilities offer LED rebates to curb rising electricity prices. Africa remains nascent at under 5% e-commerce penetration, but solar-LED kits paid through mobile-money are gaining traction in Kenya and Nigeria.
- Signify N.V.
- AMS Osram AG
- Acuity Brands Inc.
- Savant Systems Inc.
- Dialight plc
- Hubbell Incorporated
- Zumtobel Group AG
- Panasonic Holdings Corporation
- Soraa Inc. (EcoSense Lighting)
- Cree Lighting U.S. LLC
- GE Current, a Daintree company
- Fagerhult Group
- Eaton Corporation plc
- Legrand S.A.
- Lutron Electronics Co., Inc.
- Feit Electric Company, Inc.
- IKEA Systems B.V.
- Nanoleaf Canada Ltd.
- Yeelight Technology Co., Ltd.
Additional Benefits:
- The market estimate (ME) sheet in Excel format
- 3 months of analyst support
TABLE OF CONTENTS
1 INTRODUCTION
- 1.1 Study Assumptions and Market Definition
- 1.2 Scope of the Study
2 RESEARCH METHODOLOGY
3 EXECUTIVE SUMMARY
4 MARKET LANDSCAPE
- 4.1 Market Overview
- 4.2 Market Drivers
- 4.2.1 Proliferation of DIY Smart-Home Ecosystems
- 4.2.2 Rising Adoption of Energy-Efficient LED Fixtures
- 4.2.3 Convenience-Driven Shift Toward Same-Day Delivery
- 4.2.4 Increasing Refurbishment of Commercial Real Estate
- 4.2.5 Government Mandates for Phase-Out of Incandescent Bulbs
- 4.2.6 Surge in AI-Powered Visual Search on Retail Apps
- 4.3 Market Restraints
- 4.3.1 High Return Rates Due to Product Damage in Transit
- 4.3.2 Fragmented Regulations on Cross-Border E-commerce
- 4.3.3 Cyber-Security Breaches Eroding Consumer Trust
- 4.3.4 Supply-Chain Disruptions for Key LED Components
- 4.4 Impact of Macroeconomic Factors on the Market
- 4.5 Industry Supply-Chain Analysis
- 4.6 Regulatory Landscape
- 4.7 Technological Outlook
- 4.8 Porter's Five Forces Analysis
- 4.8.1 Bargaining Power of Suppliers
- 4.8.2 Bargaining Power of Consumers
- 4.8.3 Threat of New Entrants
- 4.8.4 Threat of Substitutes
- 4.8.5 Intensity of Competitive Rivalry
5 MARKET SIZE AND GROWTH FORECASTS (VALUE)
- 5.1 By End-User
- 5.1.1 Residential
- 5.1.2 Commercial
- 5.1.3 Industrial
- 5.1.4 Municipal and Government
- 5.2 By Product Type
- 5.2.1 LED Fixtures
- 5.2.2 LED Bulbs and Lamps
- 5.2.3 Smart Lighting Controls
- 5.2.4 Traditional Lighting
- 5.3 By Sales Channel
- 5.3.1 Brand-Owned Websites
- 5.3.2 Third-Party Marketplaces
- 5.3.3 Online Specialty Retailers
- 5.4 By Delivery Model
- 5.4.1 Standard Shipping
- 5.4.2 Express/Same-Day Delivery
- 5.4.3 Click-and-Collect
- 5.4.4 Drop Shipping
- 5.5 By Geography
- 5.5.1 North America
- 5.5.1.1 United States
- 5.5.1.2 Canada
- 5.5.1.3 Mexico
- 5.5.2 South America
- 5.5.2.1 Brazil
- 5.5.2.2 Argentina
- 5.5.2.3 Rest of South America
- 5.5.3 Europe
- 5.5.3.1 Germany
- 5.5.3.2 United Kingdom
- 5.5.3.3 France
- 5.5.3.4 Spain
- 5.5.3.5 Rest of Europe
- 5.5.4 Asia-Pacific
- 5.5.4.1 China
- 5.5.4.2 Japan
- 5.5.4.3 India
- 5.5.4.4 South Korea
- 5.5.4.5 Australia and New Zealand
- 5.5.4.6 Rest of Asia-Pacific
- 5.5.5 Middle East and Africa
- 5.5.5.1 Middle East
- 5.5.5.1.1 Saudi Arabia
- 5.5.5.1.2 United Arab Emirates
- 5.5.5.1.3 Turkey
- 5.5.5.1.4 Rest of Middle East
- 5.5.5.2 Africa
- 5.5.5.2.1 South Africa
- 5.5.5.2.2 Egypt
- 5.5.5.2.3 Nigeria
- 5.5.5.2.4 Rest of Africa
- 5.5.5.1 Middle East
- 5.5.1 North America
6 COMPETITIVE LANDSCAPE
- 6.1 Market Concentration
- 6.2 Strategic Moves
- 6.3 Market Share Analysis
- 6.4 Company Profiles (Includes Global Level Overview, Market Level Overview, Core Segments, Financials as Available, Strategic Information, Market Rank/Share, Products and Services, and Recent Developments)
- 6.4.1 Signify N.V.
- 6.4.2 AMS Osram AG
- 6.4.3 Acuity Brands Inc.
- 6.4.4 Savant Systems Inc.
- 6.4.5 Dialight plc
- 6.4.6 Hubbell Incorporated
- 6.4.7 Zumtobel Group AG
- 6.4.8 Panasonic Holdings Corporation
- 6.4.9 Soraa Inc. (EcoSense Lighting)
- 6.4.10 Cree Lighting U.S. LLC
- 6.4.11 GE Current, a Daintree company
- 6.4.12 Fagerhult Group
- 6.4.13 Eaton Corporation plc
- 6.4.14 Legrand S.A.
- 6.4.15 Lutron Electronics Co., Inc.
- 6.4.16 Feit Electric Company, Inc.
- 6.4.17 IKEA Systems B.V.
- 6.4.18 Nanoleaf Canada Ltd.
- 6.4.19 Yeelight Technology Co., Ltd.
7 MARKET OPPORTUNITIES AND FUTURE OUTLOOK
- 7.1 White-Space and Unmet-Need Assessment


