

|
시장보고서
상품코드
2100249
컨베이어 벨트 시장 : 시장 점유율 분석, 업계 동향 및 통계, 성장 예측(2026-2031년)Conveyor Belt - Market Share Analysis, Industry Trends & Statistics, Growth Forecasts (2026 - 2031) |
||||||
 Mordor Intelligence
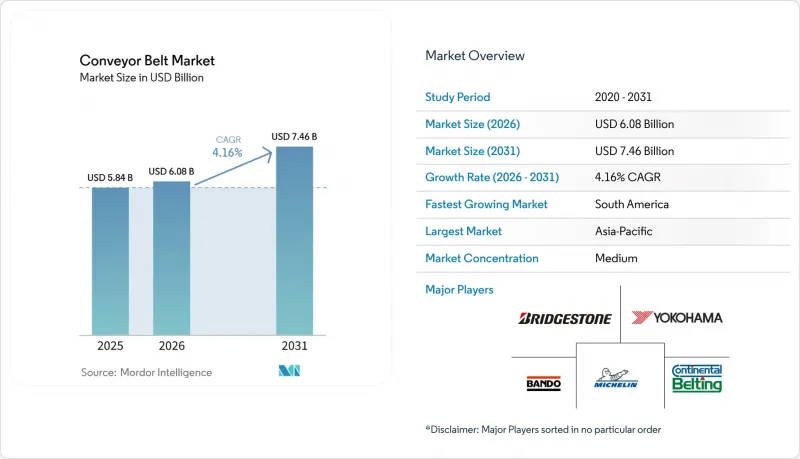
Mordor Intelligence에 의하면, 컨베이어 벨트 시장 규모는 2025년 58억 4,000만 달러로 평가되었고, 2026년에는 60억 8,000만 달러로 확대될 것으로 추정되고, 2026-2031년 CAGR 4.16%로 성장을 지속할 전망이며, 2031년에는 74억 6,000만 달러에 이를 것으로 예측됩니다.
본 보고서는 중량 등급별(중량급, 중경량급, 경량급), 벨트 재질별(스틸 코드 보강 고무, 패브릭 보강 고무, PVC/PU 모듈러 플라스틱, 특수 소재), 최종 사용자 산업별(광업·채석업, 공항·물류 창고업, 기타), 설치 유형별(고정형, 이동형), 지역별로 분류되어 있습니다. 시장 전망은 금액(달러) 기준으로 제시되어 있습니다.
세계의 컨베이어 벨트 시장 동향 및 인사이트
전자상거래 풀필먼트 센터에서 일고 있는 산업 자동화의 물결
소매업체와 제3자 물류 사업자들은 처리 능력을 시간당 4만 개의 소포까지 향상시키고, 99.99%의 정확도를 달성하는 동시에 수작업 필요성을 절반으로 줄여주는 고처리량 분류 컨베이어를 도입하고 있습니다. 이 벨트에 내장된 컴퓨터 비전 모듈이 결함을 실시간으로 감지하여 가동 중단 시간을 3%에서 0.1%로 줄여줍니다. 인건비 상승에 따른 비용 압박으로 인해 자동화가 전략적 필수 과제로 대두되면서, 변화하는 SKU 구성에 대응할 수 있는 모듈식이며 재구성이 용이한 시스템에 대한 다년간의 수주 파이프라인이 확보되어 있습니다. 소포 처리량은 계절적으로 피크를 맞이하기 때문에 사업자들은 에너지 소비가 적고 벨트를 신속하게 교체할 수 있는 경량 플라스틱 모듈을 선호하여 채택하고 있으며, 이것이 컨베이어 벨트 시장의 구조적인 성장 궤도를 뒷받침하고 있습니다.
기존 제조 설비 개조를 통한 생산성 향상
성숙한 공장에서는 컨베이어 라인을 IoT 대응 구동 장치나 가변 속도 제어 장치로 개조함으로써 자산 수명을 연장하고, 종합 설비 효율(OEE)을 두 자릿수 비율로 향상시키고 있습니다. 미국의 한 마루 제조업체는 연마 및 포장 스테이션에 인체공학에 기반한 이송 벨트를 도입한 결과, 생산 능력이 40% 향상되고 인건비를 25% 절감할 수 있었음을 입증했습니다. 개조 프로그램을 통해 막대한 신규 투자 없이도 단계적으로 인더스트리 4.0을 도입할 수 있게 되었으며, 이는 전기차 조립으로 전환 중인 자동차 공장에서 특히 큰 반향을 일으키고 있습니다. 고효율 모터는 전력 소비를 최대 30% 절감해 주며, 전력 비용 급등이 지속되는 가운데 이는 매우 중요한 이점이며, 컨베이어 벨트 시장 전반에 걸친 추가적인 보급을 촉진하고 있습니다.
전기 요금 상승으로 인해 벨트 구동 시스템의 운영 비용(OPEX)이 증가하고 있습니다.
에너지 비용은 컨베이어 총 운영 비용의 최대 40%를 차지하며, 유럽의 최근 전기 요금 인상은 광물 가공업체와 식품 제조업체의 이익률을 압박하고 있습니다. 조사에 따르면, 적응형 속도 제어를 통해 전력 소비를 7.4% 절감할 수 있으며, 가동 시간이 2,592시간인 시스템의 경우 연간 108만 달러를 절약할 수 있습니다. 이에 따라 각사는 고효율 24볼트 구동 장치나 회생 제동 모듈을 도입한 개조를 서둘러 진행하고 있지만, 설비 투자 부담이 소규모 사업자에게는 무겁게 다가와 컨베이어 벨트 시장의 단기적인 수주 증가세를 둔화시킬 가능성이 있습니다.
부문 분석
2025년 컨베이어 벨트 시장에서 중량급 벨트 시장 규모는 매출의 45.12%를 차지했으며, 이는 광업 및 중공업 분야의 적재량 수요에 힘입은 결과였습니다. 한편, 경량 벨트의 경우, 전자상거래(EC) 물류 및 식품 가공 공장에서 에너지 효율과 위생 기준 준수를 요구함에 따라 연평균 성장률(CAGR) 7.78%로 확대될 것으로 예측됩니다. 모듈식 플라스틱 벨트는 위생 관리 주기를 단축하고 물 사용량을 절감합니다. 이러한 환경적 이점이 도입을 촉진하고 있습니다. 또한, 사업자들 사이에서는 회전 관성이 낮아 전력 소비를 줄이고, 전기 요금 급등 위험을 완화할 수 있다는 점도 높이 평가받고 있습니다. 중량급 벨트는 자동차 프레스 가공 및 부품 이송 수요에 대응하며, 인장 강도와 유연성의 균형을 유지하고 있습니다. 이러한 각 중량 등급에서 센서 통합 및 스프로킷 퀵 체인지 기능은 예측 유지보수를 지원하며, 컨베이어 벨트 시장 내 서비스 제공업체의 안정적인 수익원을 뒷받침하고 있습니다.
경쟁의 치열함은 중량 등급에 따라 다릅니다. 중량급 제품에는 독자적인 카커스 기술과 대규모 검사 시설이 필요하여 진입 장벽이 높습니다. 경량 벨트는 제조가 용이하지만, 용도에 따른 표면 처리 기술이나 FDA 준수 문서가 필요하기 때문에 여전히 폭넓은 소재 포트폴리오를 보유한 기존 기업들이 우위를 점하고 있습니다. 모니터링 소프트웨어와 신속한 현장 대응 팀을 함께 제공하는 공급업체는 효과적인 차별화를 꾀하며, 컨베이어 벨트 산업 전반에 걸쳐 브랜드 충성도를 강화하고 있습니다.
스틸 코드 보강 고무는 벌크 운송 광업 분야에서 타의 추종을 불허하는 인장 강도를 갖추고 있어, 컨베이어 벨트 시장에서 35.84%의 점유율을 유지하고 있습니다. 한편, 아라미드나 실리콘과 같은 특수 복합 소재는 식품, 제약, 전자기기 공장에서 PFAS가 포함되지 않은 화학 성분이 규제 당국의 승인을 받음에 따라 연평균 성장률(CAGR) 8.23%로 성장할 전망입니다. 아라미드의 경량성은 구동 동력 절감에 기여하여 고객의 탈탄소화 목표를 지원합니다. 직물 보강 고무는 시멘트 및 골재 부문에서 여전히 중가대의 주력 제품으로 자리 잡고 있는 반면, PVC/PU 모듈은 세균 억제가 최우선으로 요구되는 습윤 및 청정 환경에서 주류를 이루고 있습니다.
조사의 초점은 향후 시행될 EU의 PFAS 규정을 위반하지 않으면서 불소 수지의 내열성을 재현하는 EPDM과 HNBR 혼합에 맞추어져 있습니다. 조기 도입 기업들은 공급 리스크를 헤지하기 위해 이중 조달 체제를 구축하고 있으며, 계약 구조에서도 석유화학 원자재에 연동된 가격 조정 조항이 점점 더 많이 포함되고 있습니다. 소재 혁신이 가속화되는 가운데, 컨베이어 벨트 시장의 이익률을 유지하기 위해서는 지적 재산권 포트폴리오가 극히 중요해지고 있습니다.
지역별 분석
2025년, 아시아태평양은 컨베이어 벨트 시장에서 40.58%의 점유율을 유지했습니다. 이는 로봇을 많이 활용하는 제조업에 대한 중국의 지속적인 투자와, 인도의 고속도로, 공항, 광물 처리 시설 확충에 힘입은 결과입니다. 도쿄와 오사카를 연결하는 총 길이 500킬로미터의 자동 자재관리 회랑을 구축하려는 일본의 계획은 하루 2만 5,000대의 트럭 운행을 대체할 수 있는 첨단 컨베이어 솔루션에 대한 해당 지역의 높은 수요를 여실히 보여주고 있습니다. 강력한 현지 공급망 체계를 통해 신속한 맞춤화가 가능해지고 리드타임이 단축되므로, 지역 공급업체들은 경쟁 우위를 점하고 있습니다.
남미에서는 광산 기업들이 세계 에너지 전환에 필수적인 구리 및 리튬 광상을 개발함에 따라, 2031년까지 연평균 성장률(CAGR)이 6.60%에 달하며 성장을 주도할 것으로 전망됩니다. 중국이 브라질의 가공 허브에 35억 달러의 지원을 약속함에 따라 중량용 벨트의 장기적인 수주가 확보되는 한편, 아르헨티나의 ‘양대양 철도 회랑’에서는 벌크 화물 거점이 가동을 시작하는 대로 항만으로의 광범위한 운송 네트워크가 필요하게 될 것입니다. 정부의 인프라 부양책이 건축자재 수요를 더욱 뒷받침하며, 대륙 전체의 컨베이어 벨트 시장 규모를 확대시키고 있습니다.
북미에서는 전자상거래 물류 센터의 확대와 피닉스 스카이하버 공항의 3억 1,000만 달러 규모 프로젝트를 비롯한 공항 수하물 처리 시스템의 업그레이드를 배경으로, 꾸준한 교체 수요가 예상됩니다. 에너지 요금은 인플레이션율을 웃도는 속도로 상승하고 있어, 가변 주파수 드라이브 및 회생 제동 모듈의 도입이 가속화되고 있습니다. 유럽에서도 유사한 현대화 수요가 발생하고 있으나, 엄격한 PFAS 규제로 인해 투입 비용 상승 및 재설계 주기가 발생할 우려가 있습니다. 이러한 조치는 규정을 준수하는 자재를 공급하는 현지 혁신 기업들에게도 기회를 창출하고 있습니다. 중동 및 아프리카에서는 모로코의 인광석 채굴이나 걸프 지역의 물류 자유무역지대와 관련된 선택적 성장이 나타나고 있으나, 정치적 리스크와 물 부족이 광범위한 확장을 저해하고 있습니다.
기타 혜택
- 엑셀 형식 시장 예측(ME) 시트
- 3개월간의 애널리스트 지원
자주 묻는 질문
목차
제1장 서론
제2장 조사 방법
제3장 주요 요약
제4장 시장 구도
제5장 시장 세분화
제6장 경쟁 구도
제7장 시장 기회 및 향후 전망
AJY 26.08.11According to Mordor Intelligence, the conveyor belt market size is expected to grow from USD 5.84 billion in 2025 to USD 6.08 billion in 2026 and is forecast to reach USD 7.46 billion by 2031 at 4.16% CAGR over 2026-2031.
This report is Segmented by Weight Class (Heavy-Weight, Medium-Weight, and Light-Weight), Belt Material (Steel-Cord Reinforced Rubber, Fabric Reinforced Rubber, PVC / PU Modular Plastic, and Specialty), End-User Industry (Mining and Quarrying, Airports and Logistics Warehousing, and More), Installation Type (Stationary, and Portable), and Geography. The Market Forecasts are Provided in Terms of Value (USD).
Global Conveyor Belt Market Trends and Insights
Industrial automation wave in e-commerce fulfillment centres
Retailers and third-party logistics operators are installing high-throughput sortation conveyors that boost processing capacity to 40,000 parcels per hour while hitting 99.99% accuracy, thereby halving manual handling needs. Computer-vision modules embedded in these belts catch defects in real time and trim downtime from 3% to 0.1%. Cost pressures from rising labor rates make automation a strategic imperative, locking in multi-year order pipelines for modular, easily re-configurable systems that keep pace with shifting SKU profiles. Because parcel volumes peak seasonally, operators favor light-weight plastic modules that consume less energy and permit rapid belt swaps, reinforcing the structural growth path of the conveyor belt market.
Productivity push in brownfield manufacturing retrofits
Mature factories retrofit conveyor lines with IoT-ready drives and variable-speed controls to stretch asset life and raise overall equipment effectiveness by double-digit percentages. A U.S. flooring producer documented a 40% capacity lift and 25% labor saving after installing ergonomic transfer belts across sanding and packaging stations. Retrofit programs allow gradual Industry 4.0 adoption without disruptive greenfield outlays, which resonates strongly in automotive plants transitioning to electric-vehicle assembly. Energy-efficient motors shrink power draw by up to 30%, a critical benefit as electricity costs escalate, and thus propel further uptake across the conveyor belt market.
Rising electricity tariffs are inflating OPEX for belt drives.
Energy accounts for up to 40% of total conveyor operating cost, and recent tariff hikes in Europe erode margins for mineral processors and food manufacturers. Studies indicate that adaptive speed control can cut consumption by 7.4%, translating to USD 1.08 million in annual savings for a system logging 2,592 hours. Firms therefore fast-track retrofits featuring high-efficiency 24-volt drives and regenerative braking modules, but capital outlays strain small operators and may slow near-term order intake for the conveyor belt market.
Other drivers and restraints analyzed in the detailed report include:
- CAPEX revival in global mining sector
- IoT-enabled predictive-maintenance belts lower unplanned downtime
- Shortage of skilled belt-maintenance technicians
For complete list of drivers and restraints, kindly check the Table Of Contents.
Segment Analysis
The conveyor belt market size for heavy-weight belts captured 45.12% revenue in 2025, anchored by mining and heavy-industry payload demands. Light-weight variants, however, are forecast to expand at 7.78% CAGR because e-commerce fulfillment and food processing plants seek energy efficiency and hygiene compliance. Modular plastic designs shorten sanitation cycles and trim water usage, an environmental benefit that amplifies adoption. Operators also value lower rotational inertia, which pares electricity draw and mitigates tariff shocks. Medium-weight belts serve automotive stamping and component transfer needs, balancing tensile strength with flexibility. Across these tiers, sensor integration and quick-change sprockets support predictive maintenance, underpinning steady revenue streams for service providers within the conveyor belt market.
The competitive intensity varies by weight class. Heavy-weight offerings require proprietary carcass technologies and extensive test facilities, raising barriers to entry. Light-weight belts, although easier to manufacture, depend on application-specific surface chemistries and FDA compliance documentation, which still favors incumbents with broad materials portfolios. Suppliers that bundle monitoring software and rapid-deployment field crews differentiate effectively, reinforcing brand stickiness across the conveyor belt industry.
Steel-cord reinforced rubber retains 35.84% conveyor belt market share given its unmatched tensile capacity for bulk-haul mining. Yet specialty composites such as aramid and silicone are poised for 8.23% CAGR as PFAS-free chemistries win regulatory clearance in food, pharmaceutical, and electronics plants. Aramid's low weight helps cut drive power, supporting customers' decarbonization targets. Fabric-reinforced rubber remains a mid-cost workhorse in cement and aggregates, while PVC/PU modules dominate wet-clean environments where bacteria control is paramount.
Research pipelines focus on EPDM and HNBR blends that mimic fluoropolymers' heat resistance without breaching upcoming EU PFAS rules. Early adopters lock in dual sourcing to hedge supply risk, and contract structures increasingly feature price-adjustment clauses tied to petrochemical feedstocks. As material innovation accelerates, intellectual-property portfolios become central to sustaining margins in the conveyor belt market.
Complete Report Scope:
- By Weight Class
- Heavy-weight
- Medium-weight
- Light-weight
- By Belt Material
- Steel-cord Reinforced Rubber
- Fabric Reinforced Rubber
- PVC / PU Modular Plastic
- Specialty (Aramid, Silicone, etc.)
- By End-user Industry
- Mining and Quarrying
- Food and Beverage Processing
- Automotive and Tire
- Airports and Logistics Warehousing
- General Manufacturing
- By Installation Type
- Stationary
- Portable / Mobile
- By Geography
- North America
- United States
- Canada
- Mexico
- South America
- Brazil
- Argentina
- Rest of South America
- Europe
- United Kingdom
- Germany
- France
- Italy
- Spain
- Nordics
- Rest of Europe
- Middle East and Africa
- Middle East
- Saudi Arabia
- United Arab Emirates
- Turkey
- Rest of Middle East
- Africa
- South Africa
- Egypt
- Nigeria
- Rest of Africa
- Middle East
- Asia-Pacific
- China
- India
- Japan
- South Korea
- ASEAN
- Australia
- New Zealand
- Rest of Asia-Pacific
- North America
Geography Analysis
Asia-Pacific retained 40.58% share of the conveyor belt market in 2025, fueled by continuous Chinese investment in robotics-intensive manufacturing and India's highway, airport, and mineral-processing build-out. Japan's plan for a 500-kilometer automated material-handling corridor linking Tokyo and Osaka exemplifies the region's appetite for advanced conveyor solutions capable of displacing 25,000 daily truck movements. Strong local supply ecosystems allow rapid customization and shorten lead times, giving regional vendors an edge.
South America is projected to lead growth at 6.60% CAGR through 2031 as miners unlock copper and lithium deposits critical to the global energy transition. China's USD 3.5 billion pledge for Brazilian processing hubs ensures long-term orders for heavy-duty belts, while Argentina's Bi-Oceanic Railway Corridor will require extensive conveying links to ports once bulk cargo nodes come online. Government infrastructure stimulus further underpins construction material demand, widening the addressable conveyor belt market across the continent.
North America experiences steady replacement demand driven by e-commerce distribution center build-outs and airport baggage upgrades, such as Phoenix Sky Harbor's USD 310 million project. Energy tariffs rise faster than inflation, accelerating the adoption of variable-frequency drives and regenerative braking modules. Europe faces parallel modernization needs but contends with stringent PFAS legislation that may raise input costs and trigger redesign cycles; nonetheless, the policy also seeds opportunity for local innovators supplying compliant materials. The Middle East and Africa record selective growth linked to phosphate mining in Morocco and logistics free zones in the Gulf, though political risk and water scarcity temper broader deployment.
- The Yokohama Rubber Co., Ltd.
- Continental AG (ContiTech)
- Michelin Group (Fenner Conveyors)
- Bando Chemical Industries, Ltd.
- Phoenix Conveyor Belt Systems GmbH
- Fenner Dunlop Conveyor Belting
- Sandvik AB
- Daifuku Co., Ltd.
- Emerson Electric Co.
- Siemens AG
- FLSmidth and Co. A/S
- Volta Belting Technology Ltd.
- Ammeraal Beltech Holding B.V.
- Qingdao Rubber Six Conveyor Belts Co., Ltd.
- Mitsuboshi Belting Ltd.
- Elcon Elastomers Pvt. Ltd.
- Continental Belting Pvt. Ltd.
- Huanan Xinhai (Shenzhen) Technology Co., Ltd.
- Wire Belt Company Ltd.
Additional Benefits:
- The market estimate (ME) sheet in Excel format
- 3 months of analyst support
TABLE OF CONTENTS
1 INTRODUCTION
- 1.1 Study Assumptions and Market Definition
- 1.2 Scope of the Study
2 RESEARCH METHODOLOGY
3 EXECUTIVE SUMMARY
4 MARKET LANDSCAPE
- 4.1 Market Overview
- 4.2 Market Drivers
- 4.2.1 Industrial automation wave in e-commerce fulfilment centres
- 4.2.2 Productivity push in brown-field manufacturing retrofits
- 4.2.3 CAPEX revival in global mining sector 2025-2028
- 4.2.4 Expansion of airports and baggage-handling upgrades
- 4.2.5 Adoption of antimicrobial food-grade belts post-FSMA amendments
- 4.2.6 IoT-enabled predictive-maintenance belts lower unplanned downtime
- 4.3 Market Restraints
- 4.3.1 Rising electricity tariffs inflating OPEX for belt drives
- 4.3.2 Shortage of skilled belt-maintenance technicians
- 4.3.3 Pending PFAS bans constraining fluoropolymer belt supply
- 4.3.4 Volatile synthetic rubber and steel-cord input prices
- 4.4 Evaluation of Critical Regulatory Framework
- 4.5 Value Chain Analysis
- 4.6 Technological Outlook
- 4.7 Porter's Five Forces
- 4.7.1 Bargaining Power of Suppliers
- 4.7.2 Bargaining Power of Buyers
- 4.7.3 Threat of New Entrants
- 4.7.4 Threat of Substitutes
- 4.7.5 Competitive Rivalry
- 4.8 Impact Assessment of Key Stakeholders
- 4.9 Key Use Cases and Case Studies
- 4.10 Impact on Macroeconomic Factors of the Market
- 4.11 Investment Analysis
5 MARKET SEGMENTATION
- 5.1 By Weight Class
- 5.1.1 Heavy-weight
- 5.1.2 Medium-weight
- 5.1.3 Light-weight
- 5.2 By Belt Material
- 5.2.1 Steel-cord Reinforced Rubber
- 5.2.2 Fabric Reinforced Rubber
- 5.2.3 PVC / PU Modular Plastic
- 5.2.4 Specialty (Aramid, Silicone, etc.)
- 5.3 By End-user Industry
- 5.3.1 Mining and Quarrying
- 5.3.2 Food and Beverage Processing
- 5.3.3 Automotive and Tire
- 5.3.4 Airports and Logistics Warehousing
- 5.3.5 General Manufacturing
- 5.4 By Installation Type
- 5.4.1 Stationary
- 5.4.2 Portable / Mobile
- 5.5 By Geography
- 5.5.1 North America
- 5.5.1.1 United States
- 5.5.1.2 Canada
- 5.5.1.3 Mexico
- 5.5.2 South America
- 5.5.2.1 Brazil
- 5.5.2.2 Argentina
- 5.5.2.3 Rest of South America
- 5.5.3 Europe
- 5.5.3.1 United Kingdom
- 5.5.3.2 Germany
- 5.5.3.3 France
- 5.5.3.4 Italy
- 5.5.3.5 Spain
- 5.5.3.6 Nordics
- 5.5.3.7 Rest of Europe
- 5.5.4 Middle East and Africa
- 5.5.4.1 Middle East
- 5.5.4.1.1 Saudi Arabia
- 5.5.4.1.2 United Arab Emirates
- 5.5.4.1.3 Turkey
- 5.5.4.1.4 Rest of Middle East
- 5.5.4.2 Africa
- 5.5.4.2.1 South Africa
- 5.5.4.2.2 Egypt
- 5.5.4.2.3 Nigeria
- 5.5.4.2.4 Rest of Africa
- 5.5.4.1 Middle East
- 5.5.5 Asia-Pacific
- 5.5.5.1 China
- 5.5.5.2 India
- 5.5.5.3 Japan
- 5.5.5.4 South Korea
- 5.5.5.5 ASEAN
- 5.5.5.6 Australia
- 5.5.5.7 New Zealand
- 5.5.5.8 Rest of Asia-Pacific
- 5.5.1 North America
6 COMPETITIVE LANDSCAPE
- 6.1 Market Concentration
- 6.2 Strategic Moves
- 6.3 Market Share Analysis
- 6.4 Company Profiles (includes Global level Overview, Market level overview, Core Segments, Financials as available, Strategic Information, Market Rank/Share for key companies, Products and Services, and Recent Developments)
- 6.4.1 The Yokohama Rubber Co., Ltd.
- 6.4.2 Continental AG (ContiTech)
- 6.4.3 Michelin Group (Fenner Conveyors)
- 6.4.4 Bando Chemical Industries, Ltd.
- 6.4.5 Phoenix Conveyor Belt Systems GmbH
- 6.4.6 Fenner Dunlop Conveyor Belting
- 6.4.7 Sandvik AB
- 6.4.8 Daifuku Co., Ltd.
- 6.4.9 Emerson Electric Co.
- 6.4.10 Siemens AG
- 6.4.11 FLSmidth and Co. A/S
- 6.4.12 Volta Belting Technology Ltd.
- 6.4.13 Ammeraal Beltech Holding B.V.
- 6.4.14 Qingdao Rubber Six Conveyor Belts Co., Ltd.
- 6.4.15 Mitsuboshi Belting Ltd.
- 6.4.16 Elcon Elastomers Pvt. Ltd.
- 6.4.17 Continental Belting Pvt. Ltd.
- 6.4.18 Huanan Xinhai (Shenzhen) Technology Co., Ltd.
- 6.4.19 Wire Belt Company Ltd.
7 MARKET OPPORTUNITIES AND FUTURE OUTLOOK
- 7.1 White-space and Unmet-need Assessment


