

|
시장보고서
상품코드
2100546
수력발전 시장 : 시장 점유율 분석, 업계 동향 및 통계, 성장 예측(2026-2031년)Hydropower - Market Share Analysis, Industry Trends & Statistics, Growth Forecasts (2026 - 2031) |
||||||
 Mordor Intelligence
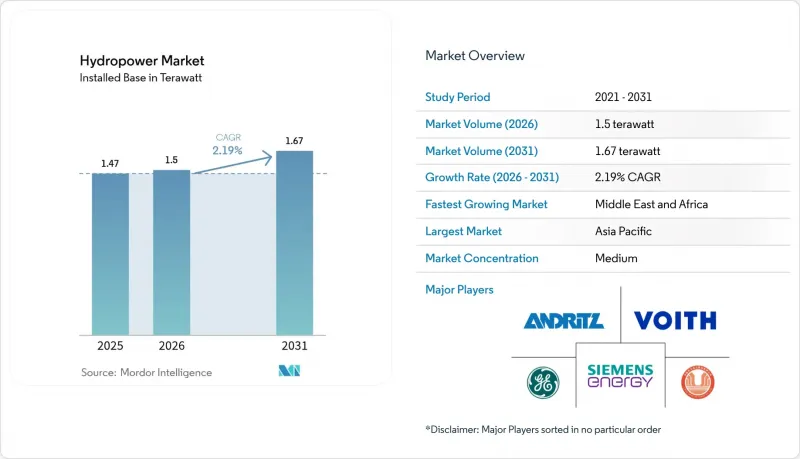
Mordor Intelligence에 의하면, 2026년 수력발전 시장 규모는 1.5 테라왓트와 추정되고, 2025년 1.47 테라왓트로부터 확대해, 2031년 예측은 1.67 테라왓트에 이를 것으로 예측되며, 2026-2031년 CAGR 2.19%로 성장할 전망입니다.
본 보고서는 용량별(대규모 수력, 중규모 수력, 소규모·마이크로 수력), 기술별(저수지식, 유입식, 양수식, 하천내식 및 마이크로 도관식), 최종 사용자별(유틸리티, 독립발전사업자, 산업용 및 자가소비용), 지역별(북미, 유럽, 아시아태평양, 기타)로 분류되어 있습니다. 시장 규모 및 전망은 설비 용량(GW) 단위로 제시되어 있습니다.
세계의 수력 발전 시장 동향 및 인사이트
노후화된 댐의 양수 발전으로의 개조가 급증
개조 프로그램에서는 기존 댐에 가역식 펌프 터빈을 도입하여 업그레이드를 진행하고 있으며, 신규 저수 프로젝트에 비해 설비 투자를 최대 60% 절감하고, 계통 균형 조정을 위한 응답 속도를 2배로 높이고 있습니다. 변동성이 큰 재생에너지 비중이 피크 부하의 50%를 초과하는 가운데, 유럽의 전력 회사들이 도입을 주도하고 있는 반면, 북미의 사업자들은 송전 제약이 있는 계곡 내 저수지를 대상으로 새로운 피크 대응 발전소 건설을 미루고 있습니다. 880 MW 규모의 크루아찬 확장 프로젝트는 현대화된 발전 단위가 6분 만에 가동될 수 있음을 입증했으며, 시스템 운영 사업자들은 부가 서비스 시장을 통해 이러한 특성을 수익화하는 데 점점 더 박차를 가하고 있습니다. 디지털 트윈 플랫폼을 통해 기획 담당자는 수량, 터빈 피로도, 시장 가격을 실시간으로 모델링할 수 있게 되었으며, 기존 인프라를 유연한 저장 허브로 전환하여 자산의 수명을 2050년 이후까지 연장하고 있습니다.
가스 피크 발전소와 비교한 균등화 발전 비용의 감소
기존 수력 발전소의 운영 비용은 50달러/MWh 미만인 반면, 가스 피크 발전소는 연료 가격 급등으로 인해 80달러/MWh를 초과하며, 분기마다 비용 격차가 확대되고 있습니다. 탄소 가격 메커니즘은 가스 발전에 추가적인 불이익을 부과하는 반면, 수력 발전의 ‘연료 제로’ 특성은 배출 제로 인증서를 통해 추가 수익을 창출하고 있습니다. 가동률의 우위 덕분에 수력 발전은 가스 피크 발전소에 비해 연간 2배 더 많은 시간 동안 조절 가능한 발전이 가능하며, 사업자는 전력 판매에 더해 주파수 조절에 대한 대가도 얻을 수 있습니다. 미드컨티넨트 독립계통운영기구(MISO) 관할 구역 내 전력 회사는 2025년 계통 연계 대기 목록에서 3.2 GW 규모의 수력 발전 설비 업그레이드를 승인함으로써, 지난 10년간 이어져 온 가스 피킹 발전소 건설 확대 추세에 제동을 걸었습니다.
높아지는 사회적 수용성 리스크와 원주민의 반대
개발업자가 영향을 받는 지역 사회로부터 ‘자유롭고 사전적이며, 충분한 정보에 기반한 동의(FPIC)’를 얻지 못할 경우, 프로젝트 지연은 평균 3년에 달할 전망입니다. 카리와 댐과 같이 주목을 받은 계획 중단 사례는 평판 리스크의 심각성을 여실히 보여주고 있으며, 보험사들은 현재 표준 보험 계약에서 사회적 수용성과 관련된 분쟁을 제외하고 있습니다. 개발사는 자본 예산의 최대 25%를 이익 배분에 할당하고 있는 반면, 금융 기관들은 상세한 인권 리스크 평가를 요구하고 있습니다. 투자자들은 분쟁 중인 지역을 우회하고, 주민 이주 문제를 최소화할 수 있는 지역 규모의 유수식 수력 발전 계획으로의 전환을 예상하고 있습니다.
부문 분석
10MW 미만의 소규모 및 초소규모 시설은 2025년 연간 설치량의 9.20%를 차지했으며, 전력 회사 및 미니 그리드 개발 사업자가 분산형 전기화를 추진함에 따라 2031년까지 다른 어떤 등급보다 크게 확대될 것으로 예측됩니다. 한편, 100MW를 초과하는 발전소는 여전히 절대 수에서 우위를 차지하고 있으며, 2025년에는 수력 발전 시장 점유율의 72.85%를 차지할 것으로 보입니다. 이 규모의 자산 소유자들은 터빈 효율 향상에 주력하고 있으며, 이를 통해 수력 발전 효율을 3-5퍼센트 포인트 향상시키고, 수명을 80년까지 연장할 수 있게 됩니다.
설치 물류 측면의 편의성이 높아짐에 따라, 소규모 수력 발전 개발업체들은 설비를 컨테이너화된 키트로 묶어 공급하게 되었으며, 이를 통해 토목 공사비를 절감하고 실용 가능한 낙차 범위를 넓히고 있습니다. 머신러닝을 활용한 디지털 트윈은 캐비테이션을 예측하고 위켓 게이트의 각도를 조정함으로써 피로를 99% 저감합니다. 대규모 댐은 현재 전력 시장뿐만 아니라 부대 서비스 입찰을 통해 경쟁하고 있으며, 양수 발전으로의 개조가 증가하고 있기 때문에 2031년까지 많은 고낙차 발전소는 베이스로드 발전기라기보다는 배터리처럼 가동될 것입니다. 중규모(10-100 MW) 프로젝트는 이러한 전략들을 연결하는 가교 역할을 하며, 규모의 경제와 사회적 수용성 장벽이 낮다는 점 사이의 균형을 맞추고 있습니다.
지역별 분석
아시아태평양은 수력 발전 분야에서 계속해서 주도적인 역할을 하고 있습니다. 2025년 기준, 이 지역은 전 세계 발전 용량의 45.60%를 차지했으며, 이는 주로 중국이 건설을 추진 중인 1370억 달러 규모의 티베트 메가 댐(역사상 최대 규모의 단일 수력 발전 프로젝트) 덕분입니다. 작년, 이 지역의 총 발전 용량은 519 GW에 달했습니다. 이는 중국이 고지대 지역에서 프로젝트를 추진한 데 더해, 인도가 수십 곳의 소규모 발전소를 신설하여 농촌 지역에 안정적인 전력을 공급하는 동시에 환경 부하를 줄인 데 기인합니다. 일본은 노후화된 댐의 개보수에 막대한 자금을 투입하여 터빈 교체 및 디지털 제어 시스템 도입을 추진하고 있으며, 이를 통해 설비의 수명을 통상적인 50년을 훨씬 초과하는 수준까지 연장하고 있습니다. 라오스나 파키스탄 등의 국가들은 인근 국가로의 전력 수출을 목적으로 댐을 건설하고 있으며, 물을 지역 간에 거래되는 상품으로 전환해 나가고 있습니다. 전 세계 수력 발전 관련 제조 노하우의 상당 부분이 아시아태평양에 집중되어 있기 때문에 각지의 개발 사업자들은 리드타임 단축과 비용 절감의 혜택을 누리고 있습니다.
중동 및 아프리카는 현재 규모가 작아 2024년에 가동을 시작한 신규 발전 용량이 고작 2GW에 그치지만, 시장 내에서 가장 빠르게 성장하고 있는 지역으로, 2031년까지 연평균 성장률(CAGR) 6.95%를 기록할 전망입니다. 50억 달러 규모의 바토카 협곡 프로젝트나 에티오피아의 그랜드 에티오피아 르네상스 댐과 같은 대형 프로젝트는 수력 발전이 공장의 동력원으로 활용되고, 지역 송전망을 연결하는 역할을 하고 있음을 보여줍니다. 앙골라와 남아프리카공화국은 신규 발전소 자금 조달을 추진하는 한편, 기존 발전소를 현대화하여 발전량을 더욱 늘리려 하고 있습니다. 주요 석유 기업들도 이러한 동향에 주목하고 있습니다. 토탈에너지(TotalEnergies)는 최근 스카텍(Scatec)사의 아프리카 내 수력 발전 포트폴리오를 인수했는데, 이는 자금이 재생에너지로 이동하고 있음을 명확히 보여주는 사례입니다. 개발 은행들은 댐을 전력 공급과 기후 변화 대응 능력 두 측면 모두에서 필수적인 요소로 간주하며, 이러한 노력의 상당 부분을 지원하고 있습니다.
북미와 유럽에서는 이러한 움직임이 더욱 가속화되고 있습니다. 최적의 하천 부지 대부분은 이미 댐으로 조성되었기 때문에 초점은 기존 시설의 발전량 확대 쪽으로 옮겨가고 있습니다. 미국에서는 가뭄으로 인해 저수지가 회복됨에 따라 2025년에 수력 발전량이 회복된 것으로 평가되었으며, 한편 연방 정부의 새로운 규제에 따라 설비 갱신을 위한 인허가 절차가 신속화되고 있습니다. 캐나다의 청정 에너지 추진으로 인해 수력 발전으로 생산된 전력이 국경을 넘어 미국으로 점점 더 많이 공급되고 있습니다. 유럽에서는 노르웨이가 잉여 수력발전을 그린 수소로 전환해 수출하기 위해 투자자를 유치하고 있습니다. 남미는 중간적인 입장을 취하고 있습니다. 브라질에서는 기후 변화로 인한 가뭄으로 장기적인 발전량 계획 수립이 어려워지고 있음에도 불구하고, 상 시마오(Sao Simao) 등 대규모 발전소의 개보수가 진행되고 있습니다. 남미 대륙 전체에서 각국 정부는 저렴하고 안정적인 수력 발전의 명백한 이점과 강우 패턴의 변화라는 점점 커지는 과제 사이에서 균형을 맞추려 하고 있습니다.
기타 혜택 :
- 엑셀 형식 시장 예측(ME) 시트
- 3개월간의 애널리스트 지원
자주 묻는 질문
목차
제1장 서론
제2장 조사 방법
제3장 주요 요약
제4장 시장 구도
제5장 시장 규모 및 성장 예측
제6장 경쟁 구도
제7장 시장 기회 및 향후 전망
AJY 26.08.07According to Mordor Intelligence, hydropower market size in 2026 is estimated at 1.5 terawatt, growing from 2025 value of 1.47 terawatt with 2031 projections showing 1.67 terawatt, growing at 2.19% CAGR over 2026-2031.
This report is Segmented by Capacity (Large Hydro, Medium Hydro, and Small and Micro Hydro), Technology (Reservoir-Based, Run-Of-River, Pumped-Storage, and In-Stream and Micro-Conduit), End-User (Utilities, Independent Power Producers, and Industrial and Captive), and Geography (North America, Europe, Asia Pacific, and More). The Market Sizes and Forecasts are Provided in Terms of Installed Capacity (GW).
Global Hydropower Market Trends and Insights
Surge in Pumped-Storage Retrofits of Ageing Dams
Retrofit programs are upgrading conventional dams with reversible pump-turbines, cutting capital outlays by up to 60% relative to greenfield storage projects and doubling response speeds for grid balancing. European utilities lead deployments as variable renewables exceed 50% of peak load, while North American operators target reservoirs inside transmission-constrained valleys to defer new peaker plants. The 880 MW Cruachan expansion demonstrates how modernized units start in six minutes, a feature system operators increasingly monetize through ancillary-service markets. Digital twin platforms allow planners to model water, turbine fatigue, and market prices in real time, turning legacy infrastructure into flexible storage hubs that extend asset lives beyond 2050.
Declining Levelized Cost Versus Gas-Peaking Plants
Existing hydropower plants run below USD 50/MWh, while gas-peaking facilities exceed USD 80/MWh in fuel-driven price spikes, widening the cost gap each quarter. Carbon pricing mechanisms further penalize gas, and hydropower's zero-fuel profile generates bonus revenues through emissions-free certificates. Capacity-factor superiority keeps hydropower dispatchable for twice as many hours per year as gas peakers, and operators can stack frequency-regulation payments on top of energy sales. Utilities in the Midcontinent Independent System Operator cleared 3.2 GW of hydropower upgrades in 2025 interconnection queues, reversing a decade-long gas-peaking build-out trend.
Escalating Social-Licence Risk & Indigenous Opposition
Project delays average three years when developers fail to secure free, prior, and informed consent from affected communities. High-profile cancellations such as the Kaliwa dam underscore reputational danger, and insurers now exclude social-licence disputes from standard policies. Developers allocate up to 25% of capital budgets for benefit-sharing, while lenders demand detailed human-rights risk assessments. Investors foresee a tilt toward community-scale run-of-river schemes that bypass contested territories and minimize resettlement challenges.
Other drivers and restraints analyzed in the detailed report include:
- Climate-Resilience Mandates Strengthening Baseload Renewables
- Grid-Forming Inverter Integration Enabling Hybrid Hydro-Solar Plants
- Long Permitting Lead-Times in OECD Markets
For complete list of drivers and restraints, kindly check the Table Of Contents.
Segment Analysis
Small and micro facilities below 10 MW captured 9.20% of annual installs in 2025 and are forecast to expand more than any other class through 2031 as utilities and mini-grid developers pursue decentralized electrification. Meanwhile, stations above 100 MW still dominate absolute totals, holding 72.85% of the hydropower market share in 2025. Asset owners in this tier concentrate on turbine-efficiency upgrades that lift water-to-wire yields by 3-5 percentage points and extend lifespans to 80 years.
Easier installation logistics push small hydro developers to bundle equipment in containerized kits, cutting civil works costs and widening viable head ranges. Machine-learning-enabled digital twins predict cavitation and adjust wicket-gate angles to reduce fatigue by 99%. Large dams now compete in ancillary-service auctions rather than energy-only markets, and rising pumped-storage retrofits mean many high-head plants will operate more like batteries than base-load generators by 2031. Medium-sized (10-100 MW) projects bridge these strategies, balancing economies of scale against lower social-licence hurdles.
Complete Report Scope:
- By Capacity
- Large Hydro (Above 100 MW)
- Medium Hydro (10 to 100 MW)
- Small and Micro Hydro (Below 10 MW)
- By Technology
- Reservoir-Based
- Run-of-River
- Pumped-Storage
- In-Stream and Micro-conduit
- By Component (Qualitative Analysis only)
- Turbines
- Generators
- Control and Automation
- Balance-of-Plant
- By End-User
- Utilities (State and Public)
- Independent Power Producers
- Industrial and Captive
- By Geography
- North America
- United States
- Canada
- Mexico
- Europe
- Russia
- Norway
- Turkey
- France
- Italy
- Spain
- Switzerland
- Sweden
- Austria
- Rest of Europe
- Asia Pacific
- China
- India
- Japan
- Pakistan
- Laos
- Rest of Asia-Pacific
- South America
- Brazil
- Argentina
- Colombia
- Venezuela
- Rest of South America
- Middle East and Africa
- Iran
- Ethiopia
- Angola
- South Africa
- Rest of Middle East and Africa
- North America
Geography Analysis
Asia Pacific keeps setting the pace for hydropower. The region controlled 45.60% of global capacity in 2025, thanks largely to China's USD 137 billion Tibet mega-dam, the biggest single hydropower project ever attempted. Total regional capacity reached 519 GW last year as China pushed ahead with high-elevation schemes and India added dozens of small plants that bring reliable power to rural districts while cutting ecological footprints. Japan is pouring money into overhauling its aging dams, swapping out turbines and layering in digital controls that push equipment lifetimes well past the usual 50-year mark. Countries such as Laos and Pakistan are building dams aimed at exporting power to neighbors, turning water into a traded regional commodity. Because so much of the world's hydropower manufacturing know-how sits in the Asia-Pacific, developers everywhere benefit from faster lead times and lower costs.
The Middle East and Africa might be small today, just 2 GW of new capacity came online in 2024, but it is the fastest-growing pocket of the market, on track for a 6.95% CAGR through 2031. Big-ticket ventures like the USD 5 billion Batoka Gorge project and Ethiopia's Grand Ethiopian Renaissance Dam show how hydropower is being used to power factories and knit together regional grids. Angola and South Africa are modernizing existing plants to squeeze out extra megawatts while they line up funding for new ones. Even oil majors are taking notice: TotalEnergies recently bought Scatec's African hydropower portfolio, a clear signal that the money is shifting toward renewables. Development banks are backing many of these efforts, viewing dams as critical for both electrification and climate resilience.
North America and Europe are further along the curve. Most of their best river sites are already dammed, so the focus has turned to squeezing more output from what's there. The United States expects hydropower production to bounce back in 2025 as reservoirs recover from drought, while new federal rules aim to speed up license amendments for upgrades. Canada's clean-energy push is sending ever more hydro-generated electrons south of the border. In Europe, Norway is courting investors to turn surplus water power into green hydrogen for export. South America sits somewhere in the middle: Brazil is refurbishing big plants such as Sao Simao even as climate-driven droughts make long-term output harder to plan. Across the continent, governments are trying to balance the undeniable benefits of cheap, steady hydropower with the mounting challenges of changing rainfall patterns.
- GE Renewable Energy
- Siemens Energy AG
- Andritz AG
- Voith GmbH & Co. KGaA
- China Yangtze Power Co. Ltd
- PJSC RusHydro
- EDF SA
- Iberdrola SA
- Power Construction Corp of China
- Alstom Hydro China
- Toshiba Energy Systems
- Harbin Electric Corporation
- BC Hydro
- Statkraft AS
- Engie SA
- Kansai Electric Power
- Hydro-Quebec
- Voith Hydro (India)
- Andritz Hydro (Germany)
- Duke Energy Corp
Additional Benefits:
- The market estimate (ME) sheet in Excel format
- 3 months of analyst support
TABLE OF CONTENTS
1 Introduction
- 1.1 Study Assumptions & Market Definition
- 1.2 Scope of the Study
2 Research Methodology
3 Executive Summary
4 Market Landscape
- 4.1 Market Overview
- 4.2 Market Drivers
- 4.2.1 Surge in pumped-storage retrofits of ageing dams
- 4.2.2 Declining levelized cost versus gas-peaking plants
- 4.2.3 Climate-resilience mandates strengthening baseload renewables
- 4.2.4 Grid-forming inverter integration enabling hybrid hydro-solar plants
- 4.2.5 Corporate 24/7 clean-power procurement for data-centre clusters
- 4.3 Market Restraints
- 4.3.1 Escalating social licence risk & indigenous opposition
- 4.3.2 Long permitting lead-times in OECD markets
- 4.3.3 Sedimentation-induced capacity loss in tropical basins
- 4.3.4 Rising insurance premiums for extreme-weather dam failures
- 4.4 Supply-Chain Analysis
- 4.5 Regulatory Landscape
- 4.6 Technological Outlook
- 4.7 Porter's Five Forces
- 4.7.1 Bargaining Power of Suppliers
- 4.7.2 Bargaining Power of Buyers
- 4.7.3 Threat of New Entrants
- 4.7.4 Threat of Substitutes
- 4.7.5 Competitive Rivalry
5 Market Size & Growth Forecasts
- 5.1 By Capacity
- 5.1.1 Large Hydro (Above 100 MW)
- 5.1.2 Medium Hydro (10 to 100 MW)
- 5.1.3 Small and Micro Hydro (Below 10 MW)
- 5.2 By Technology
- 5.2.1 Reservoir-Based
- 5.2.2 Run-of-River
- 5.2.3 Pumped-Storage
- 5.2.4 In-Stream and Micro-conduit
- 5.3 By Component (Qualitative Analysis only)
- 5.3.1 Turbines
- 5.3.2 Generators
- 5.3.3 Control and Automation
- 5.3.4 Balance-of-Plant
- 5.4 By End-User
- 5.4.1 Utilities (State and Public)
- 5.4.2 Independent Power Producers
- 5.4.3 Industrial and Captive
- 5.5 By Geography
- 5.5.1 North America
- 5.5.1.1 United States
- 5.5.1.2 Canada
- 5.5.1.3 Mexico
- 5.5.2 Europe
- 5.5.2.1 Russia
- 5.5.2.2 Norway
- 5.5.2.3 Turkey
- 5.5.2.4 France
- 5.5.2.5 Italy
- 5.5.2.6 Spain
- 5.5.2.7 Switzerland
- 5.5.2.8 Sweden
- 5.5.2.9 Austria
- 5.5.2.10 Rest of Europe
- 5.5.3 Asia Pacific
- 5.5.3.1 China
- 5.5.3.2 India
- 5.5.3.3 Japan
- 5.5.3.4 Pakistan
- 5.5.3.5 Laos
- 5.5.3.6 Rest of Asia-Pacific
- 5.5.4 South America
- 5.5.4.1 Brazil
- 5.5.4.2 Argentina
- 5.5.4.3 Colombia
- 5.5.4.4 Venezuela
- 5.5.4.5 Rest of South America
- 5.5.5 Middle East and Africa
- 5.5.5.1 Iran
- 5.5.5.2 Ethiopia
- 5.5.5.3 Angola
- 5.5.5.4 South Africa
- 5.5.5.5 Rest of Middle East and Africa
- 5.5.1 North America
6 Competitive Landscape
- 6.1 Market Concentration
- 6.2 Strategic Moves (M&A, Partnerships, PPAs)
- 6.3 Market Share Analysis (Market Rank/Share for key companies)
- 6.4 Company Profiles (includes Global level Overview, Market level overview, Core Segments, Financials as available, Strategic Information, Products & Services, and Recent Developments)
- 6.4.1 GE Renewable Energy
- 6.4.2 Siemens Energy AG
- 6.4.3 Andritz AG
- 6.4.4 Voith GmbH & Co. KGaA
- 6.4.5 China Yangtze Power Co. Ltd
- 6.4.6 PJSC RusHydro
- 6.4.7 EDF SA
- 6.4.8 Iberdrola SA
- 6.4.9 Power Construction Corp of China
- 6.4.10 Alstom Hydro China
- 6.4.11 Toshiba Energy Systems
- 6.4.12 Harbin Electric Corporation
- 6.4.13 BC Hydro
- 6.4.14 Statkraft AS
- 6.4.15 Engie SA
- 6.4.16 Kansai Electric Power
- 6.4.17 Hydro-Quebec
- 6.4.18 Voith Hydro (India)
- 6.4.19 Andritz Hydro (Germany)
- 6.4.20 Duke Energy Corp
7 Market Opportunities & Future Outlook
- 7.1 White-space & Unmet-need Assessment


