|
시장보고서
상품코드
2100730
인도의 비료 시장 : 시장 점유율 분석, 업계 동향 및 통계, 성장 예측(2026-2031년)India Fertilizers - Market Share Analysis, Industry Trends & Statistics, Growth Forecasts (2026 - 2031) |
||||||
 Mordor Intelligence
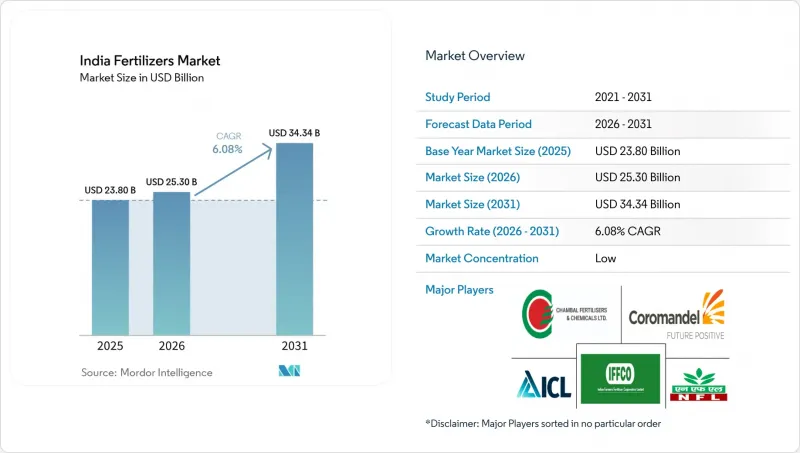
Mordor Intelligence에 의하면, 인도의 비료 시장 규모는 2025년 238억 달러로 평가되었고, 2026년 253억 달러에서 2031년까지 343억 4,000만 달러로 확대될 것으로 예측되며, 2026-2031년 CAGR 6.08%라고 하는 가장 높은 성장률을 기록할 전망입니다.
본 보고서는 유형별(복합비료, 단일비료), 형태별(기존, 특수형), 시비 방법별(시비 관개 등), 작물 유형별(밭작물 등)로 분류되어 있습니다. 시장 전망은 금액 및 수량 기준으로 제시되어 있습니다.
인도의 비료 시장 동향 및 인사이트
영양소 기반 가격 책정을 위한 보조금 합리화
2024년에 시행된 인도의 NBS(영양소 기반 가격 책정) 체계에 대한 대대적인 개편을 통해, 보조금 산정 기준이 제품 중심에서 영양소 중심으로 전환되었으며, 과거 요소가 복합비료보다 우대받았던 오랜 기간의 가격 왜곡이 시정되었습니다. 2024년 칼리프(우기) 시즌 동안 가격 균형화로 인해 단일 질소 비료에서 복합 비료로의 전환이 촉진된 결과, 농가들의 복합 비료 구매량이 23% 급증했습니다. 품질 기준 강화에 따라 NPK 등급에서 특정 미량 영양소의 최저 기준이 의무화되었으며, 제조업체들은 프리미엄 부문으로의 진출을 강요받고 있고, 강화 배합 제품을 보유한 해외 기업의 진출도 촉진되고 있습니다. 도입 상황에는 여전히 편차가 나타나고 있습니다. 마하라슈트라주와 구자라트주에서는 이미 두 자릿수 성장률을 보이고 있는 반면, 인도 갠지스 평야의 요소 의존도가 높은 지역에서는 전환 속도가 완만합니다. 중기적으로는 이 정책에 따라 인도 비료 시장이 부가가치가 높은 제품으로 전환되고, 수확량 증대를 통해 농가의 수익성이 향상될 뿐만 아니라, 과도한 질소 사용을 억제함으로써 재정적 부담이 경감될 것으로 예측됩니다.
점적 관개 및 시비 관개 시스템 도입 확대
2024년에는 ‘프라단 만트리 크리시 신차이 요자나(Pradhan Mantri Krishi Sinchayee Yojana)’에 따라 미량 관개의 보급 범위가 확대되어, 특수 수용성 비료 수요 증가를 위한 기반이 마련되었습니다. 정부의 2030년 목표는 살포 시비에서 소량·고빈도 시비 관개로 구조적 전환을 약속하고 있습니다. 카르나타카주와 구자라트주에서는 원예 분야를 주축으로 한 도입이 가속화되고 있습니다. 포장 시험 결과, 양분 사용량이 30-40% 감소하고 수확량이 20-25% 증가하는 것으로 나타나 비료 관개 방식의 사업적 타당성이 강화되고 있습니다. 하이파 네게브(Haifa Negev)와 ICL 그룹(ICL Group) 등 국제적인 공급업체들은 인도 비료 시장에 맞추어 맞춤 제작된 수용성 NPK 비료를 포장하는 현지 공장을 건설함으로써 이러한 흐름에 대응했습니다. 장기적으로는 비료-관개 통합 시스템의 정밀 시비라는 장점이 프리미엄 가격 책정을 뒷받침하고, 농업 투입 비용을 안정화하며, 토양 건강을 개선함으로써, 이러한 요소들이 종합적으로 작용하여 인도 비료 시장 내 특수 비료 수요를 끌어올리고 있습니다.
보조금 환급 지연이 운전자금을 압박
각 제조업체는 자금 사정의 공백을 메우기 위해 연이율 12-15%의 단기 대출에 의존할 수밖에 없었으며, 이로 인해 이익률이 압박받고 경우에 따라 생산 감축을 강요받기도 했습니다. 유동성 부족은 유통업체 체인 전체로 파급되어 신용 거래 기간이 장기화되는 한편, 비료 시비 성수기에는 자재 부족을 초래했습니다. 정부의 ‘직접 급여 제도(Direct Benefit Transfer)’는 환급금 승인에 여전히 다단계 승인 절차가 필요하기 때문에 병목 현상 해소에는 부분적으로만 기여했습니다. 중소규모 기업들은 불균형적인 타격을 입고 있으며, 철수나 인수 가능성이 높아지면서 인도 비료 시장의 재편 추세를 더욱 강화하고 있습니다.
부문 분석
인도 비료 시장에서 2025년 매출의 80.9%를 단일 비료가 차지했으며, 요소만으로도 부문 출하량의 약 65%를 차지했습니다. 요소는 확고한 보조금 제도, 광범위한 판매망, 그리고 농가와의 친숙함 덕분에 주도적인 지위를 공고히 하고 있습니다. 황산아연과 같은 미량 영양소 단일 비료는 결핍 현황에 대한 광범위한 매핑을 통해 눈부신 연평균 성장률(CAGR)을 기록했습니다. 복합비료는 시장 점유율은 작지만, 비용 격차를 줄이는 NBS(천연비료 기준)와의 가격 평준화와 미량 영양소 강화를 의무화하는 품질 기준에 힘입어, 2031년까지 연평균 성장률(CAGR) 6.9%로 시장 평균을 상회하는 성장이 예상됩니다.
복합비료는 물류 간소화와 균형 잡힌 영양분 공급이라는 장점이 있어, 농가는 여러 제품을 구분하여 사용할 필요 없이 토양 진단 결과에 맞추어 시비할 수 있습니다. 각 제조업체는 통합된 생산 시설을 활용하여 제품 등급을 전환함으로써 원자재 가격 변동 위험을 헤지하고 있습니다. BNM(균형 잡힌 영양 관리)이 추진되는 가운데, 10-26-26, 12-32-16, 20-20-0과 같은 배합 수요가 증가하고 있습니다. 인도의 복합비료 시장은 정책 전환과 실증 실험 결과가 농업적 성과를 뒷받침함에 따라 꾸준한 성장이 예상됩니다.
2025년 매출액 중 기존 입상 비료가 96.9%를 차지했으나, 특수 비료 부문은 인도 비료 시장의 성장 동력이 되고 있으며, 2031년까지 연평균 성장률(CAGR)은 6.5%로 전망됩니다. 자본 집약적인 원예 및 보호 재배 분야에서는 수용성 비료가 특수 비료 도입을 주도하고 있습니다. 피복성 및 서방형 요소는 비용은 높지만 25-30%의 효율 향상을 기대할 수 있어 대규모 생산자들의 관심을 끌고 있습니다. 선진 주에서는 특수 비료 보급률이 15-20%에 달하는 반면, 농업 보급 체계가 미비한 주에서는 5% 미만에 그치고 있습니다.
쌀이나 밀 재배에서는 살포 방식이 주류를 이루고 있어, 기존 입상 비료는 계속해서 시장에서 큰 점유율을 유지할 전망입니다. 그러나 환경 규제 강화와 보조금 재검토로 인해 예측 기간 동안 성장률이 높은 특수 비료로 수요가 서서히 이동할 것으로 보입니다. 각 기업은 특수 비료 제품에 농업 기술 서비스를 결합함으로써 고객 충성도를 높이고, 인도 비료 시장에서의 이익률 향상을 도모하고 있습니다.
기타 혜택 :
- 엑셀 형식 시장 예측(ME) 시트
- 3개월간의 애널리스트 지원
자주 묻는 질문
목차
제1장 서론
제2장 주요 요약 및 주요 조사 결과
제3장 개 보고서의 내용
제4장 주요 업계 동향
제5장 시장 규모 및 성장 예측
제6장 경쟁 구도
제7장 비료 업계 CEO가 직면하는 중요 전략적 과제
AJY 26.08.12According to Mordor Intelligence, the India fertilizers market size is projected to expand from USD 23.80 billion in 2025 and USD 25.30 billion in 2026 to USD 34.34 billion by 2031, registering a fastest-growing 6.08% CAGR between 2026 and 2031.
This report is Segmented by Type (Complex and Straight), by Form (Conventional and Specialty), by Application Mode (Fertigation, and More) and by Crop Type (Field Crops, and More). The Market Forecasts are Provided in Terms of Value (USD) and Volume (Metric Tons).
India Fertilizers Market Trends and Insights
Subsidy rationalization toward nutrient-based pricing
The 2024 overhaul of India's NBS framework moved the subsidy calculation from product-centric to nutrient-centric, correcting long-standing price distortions that once favored urea over balanced blends. During the 2024 kharif season, farmers responded with a 23% jump in complex fertilizer purchases as price parity encouraged switch-over from straight nitrogen. Enhanced quality norms now require specific micronutrient thresholds in NPK grades, nudging manufacturers into premium segments and attracting foreign entrants with fortified formulations. Adoption patterns remain uneven; Maharashtra and Gujarat already show double-digit gains, while urea-heavy belts across the Indo-Gangetic plains transition more slowly. Over the medium term, the policy is anticipated to steer the India fertilizers market toward value-added products, lift farm profitability through higher yields, and ease fiscal pressure by curbing excessive nitrogen use.
Rising adoption of drip irrigation and fertigation systems
Micro-irrigation coverage expanded in 2024 under the Pradhan Mantri Krishi Sinchayee Yojana, setting the stage for specialty, water-soluble fertilizer demand. The government's 2030 target promises a structural change from broadcast application to low-volume, high-frequency fertigation. Karnataka and Gujarat accelerate horticulture-led installations. Field trials show 30-40% nutrient savings and 20-25% yield gains, fortifying the business case for fertigation. International suppliers such as Haifa Negev and ICL Group reacted by building local plants that package water-soluble NPK grades tailored for the India fertilizers market. Over the long term, fertigation's precision-application advantage supports premium pricing, stabilizes farm input costs, and enriches soil health, collectively lifting demand for specialty inputs within the India fertilizers market.
Delayed subsidy reimbursements straining working capital
Manufacturers resorted to short-term loans at 12-15% interest to bridge cash gaps, squeezing margins and, in some cases, forcing production cuts. Liquidity stress rippled down the dealer chain, elongating credit terms and triggering input shortages during peak application periods. The government's Direct Benefit Transfer initiative only partly alleviated bottlenecks because reimbursement validation still requires multilevel clearances. Smaller companies bear disproportionate pain, raising the likelihood of exits or takeovers and aggravating the consolidation trend inside the India fertilizers market.
Other drivers and restraints analyzed in the detailed report include:
- Government push for balanced nutrient management
- Growing availability of nano-urea and nano-DAP
- Volatility in imported ammonia and phosphoric acid prices
For complete list of drivers and restraints, kindly check the Table Of Contents.
Segment Analysis
Straight fertilizers controlled 80.9% of 2025 revenue in the India fertilizers market, with urea alone contributing roughly 65% of segment shipments. Urea's entrenched subsidy status, broad dealer footprint, and familiarity among farmers cement its lead. Micronutrient straights, such as zinc sulfate, posted impressive CAGRs due to widespread deficiency mapping. Complex fertilizers, though smaller in share, outpace the market with a 6.9% CAGR through 2031, underpinned by NBS parity that narrows the cost gap and by quality mandates requiring micronutrient enrichment.
Complex grades benefit from simplified logistics and balanced nutrient delivery, allowing farmers to match soil prescriptions without juggling multiple products. Manufacturers leverage integrated facilities to swing between grades and hedge price volatility in raw materials. With BNM driving balanced nutrition, demand for 10-26-26, 12-32-16, and 20-20-0 variants rises. The India fertilizers market for complex formulas is forecast to grow steadily as policy shifts and demonstration results demonstrate agronomic gains.
Conventional granules commanded 96.9% of 2025 sales, yet specialty categories represent the momentum pocket of the India fertilizers market, with a 6.5% CAGR through 2031. Water-soluble fertilizers lead specialty uptake in capital-intensive horticulture and protected cultivation. Controlled-release and slow-release urea, while costlier, promise 25-30% efficiency improvements that attract large growers. Specialty penetration reaches 15-20% in progressive states, compared to sub-5% levels in weaker extension states.
Conventional granules will maintain a significant share of the market given rice and wheat's reliance on broadcast practices. Still, environmental tightening and subsidy realignments will progressively tilt value toward specialty lines with higher growth in the forecast period. Companies bundle agronomy services with specialty products, reinforcing customer loyalty and buttressing margins inside the India fertilizers market.
Complete Report Scope:
- Type
- Complex
- Straight
- Micronutrients
- Boron
- Copper
- Iron
- Manganese
- Molybdenum
- Zinc
- Others
- Nitrogenous
- Urea
- Others
- Phosphatic
- DAP
- MAP
- SSP
- Others
- Potassic
- MoP
- Secondary Macronutrients
- Calcium
- Magnesium
- Sulfur
- Micronutrients
- Form
- Conventional
- Speciality
- CRF
- Liquid Fertilizer
- SRF
- Water Soluble
- Application Mode
- Fertigation
- Foliar
- Soil
- Crop Type
- Field Crops
- Horticultural Crops
- Turf and Ornamental
List of Companies Covered in this Report:
- Chambal Fertilisers and Chemicals Limited (KK Birla Group)
- Coromandel International Limited (Murugappa Group)
- Gujarat Narmada Valley Fertilizers and Chemicals Limited (Govt. of Gujarat)
- Haifa Negev Technologies Ltd.
- ICL Group Ltd
- Indian Farmers Fertiliser Cooperative Limited (IFFCO)
- National Fertilizers Limited (Government of India)
- Rashtriya Chemicals and Fertilizers Limited (Government of India)
- Sociedad Quimica y Minera de Chile SA
- Yara International ASA
- Paradeep Phosphates Limited (Zuari-Maroc Phosphates Pvt. Ltd. & OCP)
- Nagarjuna Fertilizers and Chemicals Limited (Nagarjuna Group)
- Fertilizers and Chemicals Travancore Limited (FACT)
- Deepak Fertilisers and Petrochemicals Corporation Limited
- Krishak Bharati Cooperative Limited (KRIBHCO)
Additional Benefits:
- The market estimate (ME) sheet in Excel format
- 3 months of analyst support
TABLE OF CONTENTS
1 INTRODUCTION
- 1.1 Study Assumptions and Market Definition
- 1.2 Scope of the Study
- 1.3 Research Methodology
2 EXECUTIVE SUMMARY AND KEY FINDINGS
3 REPORT OFFERS
4 KEY INDUSTRY TRENDS
- 4.1 Acreage of Major Crop Types
- 4.1.1 Field Crops
- 4.1.2 Horticultural Crops
- 4.2 Average Nutrient Application Rates
- 4.2.1 Micronutrients
- 4.2.1.1 Field Crops
- 4.2.1.2 Horticultural Crops
- 4.2.2 Primary Nutrients
- 4.2.2.1 Field Crops
- 4.2.2.2 Horticultural Crops
- 4.2.3 Secondary Macronutrients
- 4.2.3.1 Field Crops
- 4.2.3.2 Horticultural Crops
- 4.2.1 Micronutrients
- 4.3 Agricultural Land Equipped For Irrigation
- 4.4 Regulatory Framework
- 4.5 Market Drivers
- 4.5.1 Subsidy rationalization toward nutrient-based pricing
- 4.5.2 Rising adoption of drip irrigation and fertigation systems
- 4.5.3 Government push for balanced nutrient management (BNM)
- 4.5.4 Growing availability of nano-urea and nano-DAP
- 4.5.5 Digitized soil-health card analytics enabling micro-dosing
- 4.5.6 Corporate sugarcane sustainability programs
- 4.6 Market Restraints
- 4.6.1 Delayed subsidy reimbursements straining working capital
- 4.6.2 Volatility in imported ammonia and phosphoric acid prices
- 4.6.3 Environmental compliance costs under revised CPCB norms
- 4.6.4 Smallholder mistrust of specialty fertilizers beyond urea
- 4.7 Value Chain and Distribution Channel Analysis
5 MARKET SIZE AND GROWTH FORECAST (VALUE AND VOLUME)
- 5.1 Type
- 5.1.1 Complex
- 5.1.2 Straight
- 5.1.2.1 Micronutrients
- 5.1.2.1.1 Boron
- 5.1.2.1.2 Copper
- 5.1.2.1.3 Iron
- 5.1.2.1.4 Manganese
- 5.1.2.1.5 Molybdenum
- 5.1.2.1.6 Zinc
- 5.1.2.1.7 Others
- 5.1.2.2 Nitrogenous
- 5.1.2.2.1 Urea
- 5.1.2.2.2 Others
- 5.1.2.3 Phosphatic
- 5.1.2.3.1 DAP
- 5.1.2.3.2 MAP
- 5.1.2.3.3 SSP
- 5.1.2.3.4 Others
- 5.1.2.4 Potassic
- 5.1.2.4.1 MoP
- 5.1.2.5 Secondary Macronutrients
- 5.1.2.5.1 Calcium
- 5.1.2.5.2 Magnesium
- 5.1.2.5.3 Sulfur
- 5.1.2.1 Micronutrients
- 5.2 Form
- 5.2.1 Conventional
- 5.2.2 Speciality
- 5.2.2.1 CRF
- 5.2.2.2 Liquid Fertilizer
- 5.2.2.3 SRF
- 5.2.2.4 Water Soluble
- 5.3 Application Mode
- 5.3.1 Fertigation
- 5.3.2 Foliar
- 5.3.3 Soil
- 5.4 Crop Type
- 5.4.1 Field Crops
- 5.4.2 Horticultural Crops
- 5.4.3 Turf and Ornamental
6 COMPETITIVE LANDSCAPE
- 6.1 Key Strategic Moves
- 6.2 Market Share Analysis
- 6.3 Company Landscape
- 6.4 Company Profiles (Includes Global Level Overview, Market Level Overview, Core Business Segments, Financials, Headcount, Key Information, Market Rank, Market Share, Products and Services, and Analysis of Recent Developments)
- 6.4.1 Chambal Fertilisers and Chemicals Limited (KK Birla Group)
- 6.4.2 Coromandel International Limited (Murugappa Group)
- 6.4.3 Gujarat Narmada Valley Fertilizers and Chemicals Limited (Govt. of Gujarat)
- 6.4.4 Haifa Negev Technologies Ltd.
- 6.4.5 ICL Group Ltd
- 6.4.6 Indian Farmers Fertiliser Cooperative Limited (IFFCO)
- 6.4.7 National Fertilizers Limited (Government of India)
- 6.4.8 Rashtriya Chemicals and Fertilizers Limited (Government of India)
- 6.4.9 Sociedad Quimica y Minera de Chile SA
- 6.4.10 Yara International ASA
- 6.4.11 Paradeep Phosphates Limited (Zuari-Maroc Phosphates Pvt. Ltd. & OCP)
- 6.4.12 Nagarjuna Fertilizers and Chemicals Limited (Nagarjuna Group)
- 6.4.13 Fertilizers and Chemicals Travancore Limited (FACT)
- 6.4.14 Deepak Fertilisers and Petrochemicals Corporation Limited
- 6.4.15 Krishak Bharati Cooperative Limited (KRIBHCO)