

|
시장보고서
상품코드
2113209
북미의 기내식 서비스 : 시장 점유율 분석, 업계 동향과 통계, 성장 예측(2026-2031년)North America In-flight Catering Services - Market Share Analysis, Industry Trends & Statistics, Growth Forecasts (2026 - 2031) |
||||||
 Mordor Intelligence
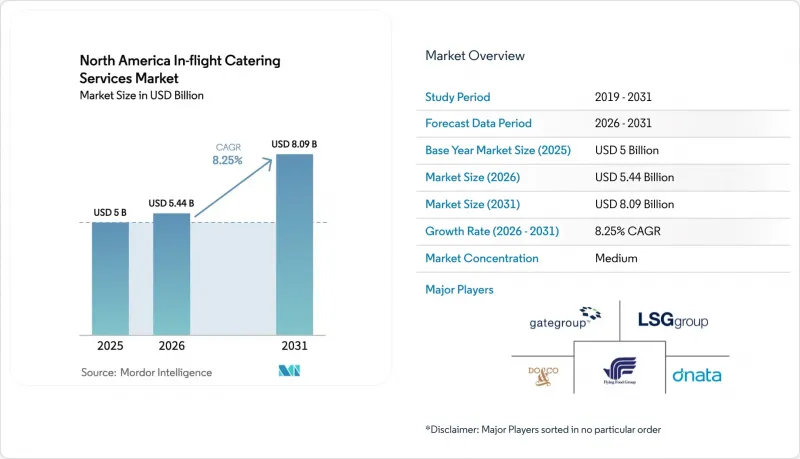
Mordor Intelligence에 따르면 북미의 기내식 서비스 시장 규모는 2025년 50억 달러에서 2026년에는 54억 4,000만 달러로 확대하며, 2026-2031년에 CAGR 8.25%로 추이하며, 2031년에는 80억 9,000만 달러에 달할 것으로 예측됩니다.
이 보고서는 식품 유형(식사, 제과·과자류, 기타), 항공편 유형(풀서비스 항공사, 기타),좌석 등급(이코노미, 비즈니스, 퍼스트), 기내식 유형(클래식형, 기내 판매형), 비행 시간(단거리 노선, 장거리 노선) 및 지역(미국, 캐나다, 멕시코)별로 분류되어 있습니다. 시장 예측은 금액(달러) 기준으로 제시되어 있습니다.
북미 기내식 서비스 시장의 동향 및 인사이트
항공 여객 수의 회복과 장거리 노선 운항 능력 확대
IATA의 2024년 말 보고서에 따르면 국제선 여객 수는 2019년 기준치를 불과 0.5% 상회했습니다. 국내선과 국제선을 합친 총 여객 수는 2019년 수치를 3.8% 상회했습니다. 이에 따라 각 항공사는 기내식 제공이 의무화되어 있으며, 단거리 노선보다 수익성이 높은 대양 횡단 노선으로 수송 능력을 전환하고 있습니다. 2025년 여름, 북미의 좌석 공급량은 7억 9,300만 좌석에 달했습니다. 캐나다 주요 공항의 운항 빈도가 증가하고 멕시코행 레저 노선이 확대됨에 따라 기내식 서비스에 대한 수요는 주방 시설이 제한된 공항에 집중되기 시작했습니다. FAA(연방항공청)는 2045년까지 시스템 여객 수입 마일이 연평균 2.8% 증가할 것으로 예측하고 있는데, 이는 평균 비행 거리가 길어짐을 의미하며, 다양한 메뉴의 기내식 서비스를 경제적으로 확대할 수 있는 케이터링 업체에게는 유리한 상황이 됩니다. 신선 및 냉동식품 공급망이나 다국적 요리 인증을 보유하지 않은 공급업체는 장거리 노선이 확대됨에 따라 시장에서 배제될 위험이 있습니다.
항공사 브랜드의 차별화를 꾀하는 기내 경험의 프리미엄화
델타항공은 2024년 호세 안드레스 씨 및 마샤마 베일리 씨와 함께 셰프 프로그램을 공식 출범시켜, 델타 원(Delta One) 객실에서 계절별 메뉴를 순환식으로 제공하고 있습니다. 또한 알래스카 항공은 2025년 5월에 ‘셰프스 테이블(Chef’s Table)’이라는 콘셉트를 도입했습니다. 2024년에 프리미엄 클래스 이용객을 대상으로 실시된 설문조사에서 78%가 식사의 질을 재예약의 주요 요인으로 꼽았으며, 이에 따라 각 항공사는 시그니처 메뉴, 와인 페어링, 지역산 식재료에 대한 투자를 확대하고 있습니다. 아메리칸 항공은 댈러스-포트워스에 214,000제곱피트 규모의 시설을 운영하며 하루 1만 5,000끼의 식사를 생산하고 있으며, 산업용 주방이 셰프의 레시피를 얼마나 대규모로 적용할 수 있는지 입증하고 있습니다. 비즈니스 클래스 기내식은 현재 요금 프리미엄을 창출하고 있으며, 경기 사이클 전반에 걸쳐 케이터링 비용을 측정 가능한 고객 생애 가치로 전환하고 있습니다.
높은 운영 비용과 식자재·인건비·공과금 인플레이션
2024년, 미국의 외식 가격 인플레이션율은 4.1%에 달했고, 인건비는 4.5% 상승한 결과, 외식 산업의 평균 시급은 19.47달러가 되었습니다. 캐나다에서는 2024년 10월 식품 인플레이션율이 5.2%에 달했으나, 다음 달에는 4.3%로 완화되었으며, 접객업 분야의 평균 임금은 20.85 캐나다 달러(15.40 달러)가 되었습니다. 냉장 및 급속 냉각 업무는 총 에너지 비용의 15%-20%를 차지하고 있으며, 2024년에는 북미 전역에서 상업용 전기 요금이 약 3% 상승했습니다. 이러한 압박으로 인해 이코노미 클래스 계약의 이익률이 압박받고 있으며, SKU 합리화 및 근무 일정 자동화가 진행되고 있지만, 이는 서비스 차별화 및 직원 유지에 부정적인 영향을 미칠 위험이 있습니다.
부문별 분석
2025년에는 매출의 44.76%를 기내식이 차지했으나, 항공사들이 사전 포장 식품에 가장 적합한 500마일 미만의 노선을 증편함에 따라 스낵 및 가벼운 식사의 매출은 2031년까지 연평균 성장률(CAGR) 8.39%로 증가할 것으로 예측됩니다. 미국 항공편의 절반 이상은 2시간 미만이기 때문에 따뜻한 식사 제공은 현실적이지 않아, 스낵 박스나 테이크아웃용 샌드위치가 선호되고 있습니다. 유나이티드(United)는 사전 주문 기간을 연장하고 노선별로 12-15종의 SKU를 제공하는 반면, 델타(Delta)는 10-12달러 상당의 계절 한정 스낵 박스를 순환식으로 제공하고 있습니다. 상온 보관이 가능한 상품은 추적 관리 부담이 적기 때문에 시장 출시까지 걸리는 시간을 단축할 수 있습니다. 음료는 여전히 주요 수입원이지만, TSA(미국 교통안전청)의 액체 반입 규제가 완화되어 개인용 음료의 용량 확대가 허용됨에 따라 기내 판매 증가세는 둔화되고 있습니다. 베이커리 제품과 과자류는 프리미엄 클래스에서 틈새 시장 역할을 수행하고 있으며, 따뜻한 쿠키나 접시에 담겨 제공되는 디저트가 브랜드 경험을 향상시키고 있습니다.
규제가 명확해짐에 따라 스낵 사업의 수익성이 향상되고 있습니다. FSMA 204에서는 검증된 살균 공정을 거쳐 가공된 많은 상온 보관 가능 상품이 적용 대상에서 제외되어, 감사에 드는 부담이 경감되었습니다. 유연한 생산 라인을 갖춘 케이터링 업체는 중복 재고를 필요로 하지 않으면서 단백질 박스, 과일 컵, 프리미엄 스낵 믹스 등을 조합한 믹스 케이스를 제공할 수 있습니다. 수천 식분의 동일한 메인 요리를 생산하도록 설계된 기존의 식사 조립 공장은 재투자를 하지 않으면 노후화 위험에 직면하게 됩니다. 그 결과, 스낵은 항공사의 지속가능성 요건을 충족하면서도 업무에 미치는 영향을 최소화하는 식물성 단백질, 알레르기 유발 물질이 없는 원재료, 그리고 퇴비화 가능한 포장재의 시험장이 되어가고 있습니다.
2025년 매출에서 FSC(기내식 서비스 회사)가 차지하는 비중은 61.89%였으나, 저비용 항공사는 2031년까지 연평균 9.02%의 성장이 예상되며, 기내식을 단순한 의무가 아닌 수입원으로 자리매김하고 있습니다. Volaris는 부가 수익의 약 15%를 기내식 사업만으로 창출하고 있습니다. VivaAerobus는 좌석 수를 33% 늘리고 모든 식사를 기내에서 판매하고 있습니다. WestJet의 단계별 메뉴 체계는 과거에는 서비스 제공에 너무 짧다고 여겨졌던 항공편에서도 수익화를 실현하고 있으며, 5달러짜리 스낵 박스부터 18달러짜리 프리미엄 식사까지 판매하고 있습니다. 전세편이나 개인 제트기의 기내식은 여전히 높은 수익률을 자랑하는 틈새 시장이며, 1인당 지출액은 종종 50달러를 초과합니다.
LCC는 데이터 투명성 측면에서 우위를 점하고 있습니다. 각 거래 데이터는 노선별 분석에 반영되어 SKU 선정 및 폐기물 감축에 활용되고 있습니다. FSC는 하이브리드 모델 도입을 시도하고 있으며, 아메리칸 항공은 2024년에 900마일 미만 비행편에서 기내 판매를 도입했습니다. 그러나 로열티 프로그램의 존재로 인해 레거시 브랜드가 자주 이용하는 고객을 밀어내지 않으면서 서비스를 어느 정도까지 분리할 수 있는지에 한계가 있습니다. 전략적 균형 차원에서 프리미엄 클래스 고객을 보호하는 동시에 옵션 업그레이드를 통해 이코노미 클래스의 수익화를 도모해야 합니다.
기타 혜택:
- 엑셀 형식의 시장 예측(ME) 시트
- 3개월간의 애널리스트 지원
자주 묻는 질문
목차
제1장 서론
제2장 조사 방법
제3장 개요
제4장 시장 구도
제5장 시장 규모와 성장 예측
제6장 경쟁 구도
제7장 시장 기회와 향후 전망
KSA 26.08.25According to Mordor Intelligence, the North America in-flight catering services market size is expected to grow from USD 5.00 billion in 2025 to USD 5.44 billion in 2026 and is forecasted to reach USD 8.09 billion by 2031 at 8.25% CAGR over 2026-2031.
This report is Segmented by Food Type (Meals, Bakery and Confectionery, and More), Flight Type (Full-Service Carriers, and More), Aircraft Seating Class (Economy, Business, and First), Catering Type (Classic and Retail On Board), Flight Duration (Short-Haul and Long-Haul), and Geography (United States, Canada, and Mexico). The Market Forecasts are Provided in Terms of Value (USD).
North America In-flight Catering Services Market Trends and Insights
Rebound in Air-Passenger Traffic and Long-Haul Capacity Additions
According to IATA's year-end report for 2024, international traffic surpassed the 2019 benchmark by just 0.5%. The combined total traffic (domestic and international) exceeded 2019 figures by 3.8%. Airlines are therefore pushing capacity toward transoceanic sectors where meal service is mandatory, and yields are higher than on short-haul flights. In the summer of 2025, North America boasted a seat capacity of 793 million. As Canadian gateways increased their flight frequencies and Mexican leisure routes expanded, demand for catering services became concentrated at airports with limited kitchen facilities. The FAA projects system revenue passenger miles will grow 2.8% annually through 2045, implying longer average stage lengths that favor caterers able to scale multi-course service economically. Suppliers lacking fresh-frozen networks or multi-cuisine certification risk displacement as long-haul corridors expand.
Premiumization of Onboard Experience to Differentiate Airline Brands
Delta formalized chef programs with Jose Andres and Mashama Bailey in 2024, rotating seasonal menus in Delta One cabins, and Alaska Airlines introduced its Chef's Table concept in May 2025. A 2024 survey of premium travelers found that 78% cite food quality as a key repeat-booking trigger, prompting carriers to invest in signature dishes, wine pairings, and regionally sourced ingredients. American Airlines operates a 214,000-square-foot facility in Dallas/Fort Worth that produces 15,000 meals daily, demonstrating how industrial kitchens can incorporate chef recipes at scale. Business-class meals now command rate premiums that translate catering spend into measurable customer lifetime value during economic cycles.
High Operating Costs and Inflation in Food, Labor, and Utilities
Food-away-from-home inflation in the United States reached 4.1% in 2024, and labor costs increased by 4.5%, resulting in average food-service wages of USD 19.47 per hour. Canada faced 5.2% food inflation in October 2024 before easing to 4.3% a month later, with hospitality pay averaging CAD 20.85 (USD 15.40). Refrigeration and blast-chilling operations account for 15%-20% of total energy expenses, and commercial power rates increased by roughly 3% across North America in 2024. These pressures compress margins on economy-class contracts, triggering SKU rationalization and automated shift scheduling that risk service differentiation and staff retention.
Other drivers and restraints analyzed in the detailed report include:
- Expansion of LCCs and Hybrids Scaling Buy-on-Board and Pre-Order Models
- Digitalization Through Pre-Order Platforms, Data-Driven Menu Planning, and Kitchen Automation
- Stringent Multi-Jurisdiction Food-Safety/Halal / Kosher Rules
For complete list of drivers and restraints, kindly check the Table Of Contents.
Segment Analysis
Meals accounted for 44.76% of revenue in 2025, but snacks and savouries are forecast to climb at an 8.39% CAGR to 2031 as carriers add sub-500-mile services best suited to pre-packaged items. More than half of US flights are under two hours, limiting the feasibility of heated meals and favoring snack boxes and grab-and-go sandwiches. United extended its pre-order window to offer 12-15 SKUs per route, while Delta rotates seasonal snack boxes priced at USD 10-12. Shelf-stable items also carry lighter traceability burdens, which speeds up the time-to-market. Although beverages remain a core revenue line, TSA's relaxations of the liquid-carrying rule are allowing larger personal drinks, which is dampening onboard sales growth. Bakery and confectionery products play a niche role in premium cabins, where warm cookies and plated desserts elevate the brand experience.
Regulatory clarity improves snack economics. FSMA 204 exempts many shelf-stable goods processed with validated kill steps, lowering audit overhead. Caterers with flexible lines can deliver mixed cases, including a protein box, a fruit cup, and a premium snack mix, without requiring duplicate inventory. Traditional meal-assembly plants designed for thousands of identical entrees must reinvest or risk obsolescence. As a result, snacks are becoming the testing ground for plant-based proteins, allergen-free ingredients, and compostable wrappers that satisfy airline sustainability mandates with minimal operational disruption.
FSCs accounted for 61.89% of 2025 revenue, but low-cost operators are expected to expand by 9.02% annually through 2031, treating food as a profit center rather than an obligation. Volaris earns roughly 15% of its ancillary revenue from catering alone. VivaAerobus recorded a 33% capacity jump and sells every meal retail. WestJet's tiered menus monetized flights once considered too short for service, selling snack boxes for USD 5 up to premium meals for USD 18. Charter and private-jet catering remain high-margin niches with spend often exceeding USD 50 per passenger.
LCCs win on data transparency. Each transaction feeds route-level analytics that inform SKU curation and waste reduction. FSCs are experimenting with hybrid models; American introduced buy-on-board on sub-900-mile flights in 2024. Loyalty programs, however, limit how far legacy brands can unbundle without alienating frequent flyers. The strategic balance seeks to protect premium tiers while monetizing economy cabins via optional upgrades.
Complete Report Scope:
- By Food Type
- Meals
- Bakery and Confectionery
- Snacks and Savouries
- Beverages
- By Flight Type
- Full-Service Carriers (FSCs)
- Low-Cost Carriers (LCCs)
- Other Flight Types
- By Aircraft Seating Class
- Economy
- Business
- First
- By Catering Type
- Classic (Complimentary and Pre-ordered)
- Retail On Board (Buy-on-board)
- By Flight Duration
- Short-Haul
- Long-Haul
- By Geography
- United States
- Canada
- Mexico
List of Companies Covered in this Report:
- gategroup
- LSG Group
- Flying Food Group LLC
- DO & CO Aktiengesellschaft
- dnata
- Newrest Group Services SAS
- SATS Ltd.
- Cathay Pacific Catering Services (H.K.) Limited
- KLM Catering Services
- Air Fayre
- Air Gourmet, Inc.
- Abby's Catering (Amber Green Corporation)
- Air Culinaire Worldwide
Additional Benefits:
- The market estimate (ME) sheet in Excel format
- 3 months of analyst support
TABLE OF CONTENTS
1 INTRODUCTION
- 1.1 Study Assumptions and Market Definition
- 1.2 Scope of the Study
2 RESEARCH METHODOLOGY
3 EXECUTIVE SUMMARY
4 MARKET LANDSCAPE
- 4.1 Market Overview
- 4.2 Market Drivers
- 4.2.1 Rebound in air-passenger traffic and long-haul capacity additions
- 4.2.2 Premiumization of onboard experience to differentiate airline brands
- 4.2.3 Expansion of LCCs and hybrids scaling buy-on-board and pre-order models
- 4.2.4 Digitalization through a pre-order platforms, data-driven menu planning, and kitchen automation
- 4.2.5 Under-utilized fresh-frozen meal networks enabling SKU standardization
- 4.2.6 Aircraft/engine delivery bottlenecks shift demand toward waste-aware catering
- 4.3 Market Restraints
- 4.3.1 High operating costs and inflation in food, labor, and utilities
- 4.3.2 Stringent multi-jurisdiction food-safety/halal-kosher rules
- 4.3.3 Short-haul time constraints and BYO-food erode service scope
- 4.3.4 Contract-to-retail mix shift lowers meals uplifted despite revenue growth
- 4.4 Value Chain Analysis
- 4.5 Regulatory and Technological Outlook
- 4.6 Porter's Five Forces Analysis
- 4.6.1 Bargaining Power of Suppliers
- 4.6.2 Bargaining Power of Buyers
- 4.6.3 Threat of New Entrants
- 4.6.4 Threat of Substitutes
- 4.6.5 Intensity of Competitive Rivalry
5 MARKET SIZE AND GROWTH FORECASTS (VALUE)
- 5.1 By Food Type
- 5.1.1 Meals
- 5.1.2 Bakery and Confectionery
- 5.1.3 Snacks and Savouries
- 5.1.4 Beverages
- 5.2 By Flight Type
- 5.2.1 Full-Service Carriers (FSCs)
- 5.2.2 Low-Cost Carriers (LCCs)
- 5.2.3 Other Flight Types
- 5.3 By Aircraft Seating Class
- 5.3.1 Economy
- 5.3.2 Business
- 5.3.3 First
- 5.4 By Catering Type
- 5.4.1 Classic (Complimentary and Pre-ordered)
- 5.4.2 Retail On Board (Buy-on-board)
- 5.5 By Flight Duration
- 5.5.1 Short-Haul
- 5.5.2 Long-Haul
- 5.6 By Geography
- 5.6.1 United States
- 5.6.2 Canada
- 5.6.3 Mexico
6 COMPETITIVE LANDSCAPE
- 6.1 Strategic Moves
- 6.2 Market Share Analysis
- 6.3 Company Profiles (includes Global Level Overview, Market Level Overview, Core Segments, Financials, Strategic Info, Market Rank/Share, Products and Services, Recent Developments)
- 6.3.1 gategroup
- 6.3.2 LSG Group
- 6.3.3 Flying Food Group LLC
- 6.3.4 DO & CO Aktiengesellschaft
- 6.3.5 dnata
- 6.3.6 Newrest Group Services SAS
- 6.3.7 SATS Ltd.
- 6.3.8 Cathay Pacific Catering Services (H.K.) Limited
- 6.3.9 KLM Catering Services
- 6.3.10 Air Fayre
- 6.3.11 Air Gourmet, Inc.
- 6.3.12 Abby's Catering (Amber Green Corporation)
- 6.3.13 Air Culinaire Worldwide
7 MARKET OPPORTUNITIES AND FUTURE OUTLOOK
- 7.1 White-Space and Unmet-Need Assessment


