

|
시장보고서
상품코드
2113282
바닐린 : 시장 점유율 분석, 업계 동향과 통계, 성장 예측(2026-2031년)Vanillin - Market Share Analysis, Industry Trends & Statistics, Growth Forecasts (2026 - 2031) |
||||||
 Mordor Intelligence
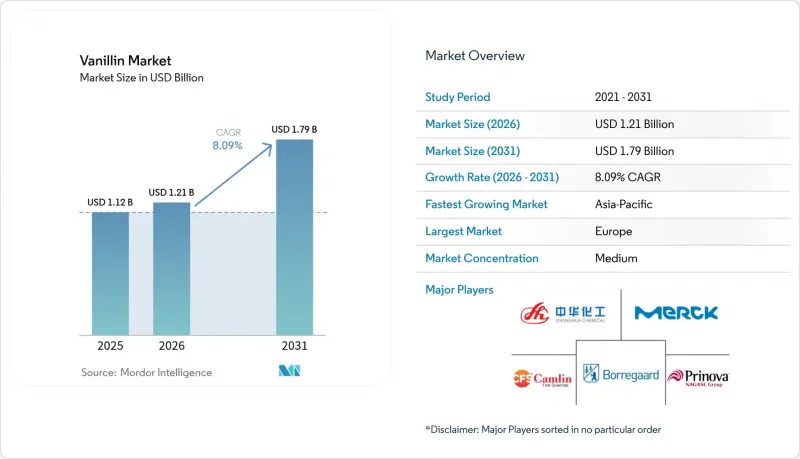
Mordor Intelligence에 따르면 바닐린 시장 규모는 2025년에 11억 2,000만 달러로 평가되며, 2026년 12억 1,000만 달러에서 2031년까지 17억 9,000만 달러에 달할 것으로 예측되고 있으며, 예측 기간(2026-2031년) CAGR은 8.09%에 달할 전망입니다.
이 보고서는 유형(천연 바닐린, 합성 바닐린), 형태(분말, 결정, 액체), 용도(식품 및 음료, 의약품, 퍼스널 케어·화장품, 영양 보조 식품·스포츠 영양, 동물 사료, 기타), 지역(북미, 유럽, 아시아태평양, 남미, 중동 및 아프리카)별로 분류되어 있습니다. 시장 전망은 금액(달러) 기준으로 제시되어 있습니다.
세계 바닐린 시장의 동향 및 인사이트
식품, 음료, 퍼스널 케어 부문에서 천연 원료에 대한 수요 증가
소비자들이 합성 제품보다 천연 제품을 점점 더 선호함에 따라 바이오 기반 바닐린 생산에 프리미엄 가격을 책정할 기회가 생기고 있습니다. 생명 공학의 발전으로 기업은 현재 발효 공정을 이용하여 ‘천연’으로 표시된 바닐린을 생산할 수 있게 되었으며, 1kg당 약 700달러에 판매할 수 있게 되었습니다. 대조적으로, 합성 바닐린의 소매 가격은 1킬로그램당 불과 15달러에 불과합니다. 도쿄 이과대학의 연구진은 농업 폐기물에서 유래한 페룰산을 단일 공정으로 바닐린으로 변환하는 효소를 생명공학 기술을 통해 개발했습니다. 이 혁신적인 기술은 지속가능성과 공급에 대한 우려를 해소할 뿐만 아니라, FDA 규제 하에서 제품이 ‘천연’ 분류를 유지하도록 보장합니다. 이 획기적인 발전으로 인해 제조사들은 천연 바닐라 추출물과 합성 바닐라 추출물 사이에 존재하는 킬로그램당 1,200-4,000달러라는 큰 가격 차이를 활용하면서도, 천연 표시에 관한 주요 시장 규정을 준수할 수 있게 되었습니다.
생명공학 및 발효 기술의 발전
유전자 공학과 발효 기술은 농업에 의존하지 않고 확장 가능한 천연 바닐린 생산을 가능하게 함으로써 생산 경제성에 혁명을 일으키고 있습니다. 유전자 변형 미생물 시스템, 특히 사카로마이세스 세레비시에(Saccharomyces cerevisiae)나 대장균(Escherichia coli)은 오이게놀,페룰산, 리그닌 유도체 등의 재생 가능한 원료로부터 천연 바닐린을 생산하는 데 있으며, 상업적 실현 가능성을 입증하고 있습니다. 리그닌을 원료로 하는 공정에서는 중량비 기준으로 6.2%의 수율을 달성하고 있으며, 석유 유래 합성 바닐린을 대체할 지속가능한 대안이 될 뿐만 아니라, 펄프·제지 산업의 폐기물 관리 문제도 해결하고 있습니다. 이러한 혁신을 통해 생명공학 기업은 주요 식품 및 음료 제조업체들의 환경 지속가능성에 대한 높아지는 기대에 부응하는 비용 효율적인 천연 바닐린을 제공함으로써, 상당한 시장 점유율을 확보할 수 있는 위치에 있습니다.
천연 바닐라 빈의 공급 불안정성
바닐라 빈 생산에서 마다가스카르가 차지하는 지배적인 지위는 천연 바닐린 시장 전체에 파급되는 구조적인 공급 리스크를 야기하고 있으며, 기후 변화와 정세 불안이 가격의 극심한 변동을 초래하고 있습니다. 2024년에 600톤 이상을 수출하며 2위 바닐라 생산국으로 부상한 우간다의 경우, 공급 다각화 측면에서는 한계가 있지만 1,660만 달러의 수익을 올렸을 뿐만 아니라 4%를 넘는 바닐린 함유율을 달성했습니다. 가격 버블 분석을 통해 사이클론, 시장 투기, 규제 변경과 관련된 5가지 뚜렷한 가격 변동 기간이 확인되었습니다. 안정성을 높이기 위해 기업과 농업인 간의 직접 협상이 권장되고 있습니다. 천연 바닐린 생산에는 바닐린 1킬로그램당 약 500킬로그램의 바닐라 포드가 필요하며, 이는 4만 송이의 꽃을 수분시키는 데 해당합니다. 이러한 농업의 높은 집약도가 공급 확대 가능성을 제약하고 있으며, 생명공학을 통한 대체 수단의 추진으로 이어지고 있습니다.
부문 분석
석유 유래 구아이아콜 제조의 경제성 덕분에 2025년 공급량의 56.35%를 합성 제품이 차지했습니다. 2025년 바닐린 시장 규모가 11억 2,000만 미달러를 넘어선 가운데, 이 부문은 안정적인 현금 흐름을 창출했습니다. 반면, 천연 제품은 8.42%라는 가장 높은 연평균 성장률(CAGR)을 기록하고 있으며, 발효 비용이 킬로그램당 300달러 미만으로 떨어짐에 따라 2031년까지 틈새 시장에서 주류 시장으로 성장할 전망입니다. 1993년부터 가동중인 보레가드(Boregard)사의 리그닌 제조 공정은 선구자 우위를 구현하고 있습니다. 신규 진입 기업은 현재 전기화학적 탈중합을 통한 높은 수율을 특징으로 하는 이 모델을 모방하고 있습니다. 베이커리 및 프리미엄 유제품 분야의 ‘클린 라벨’ 요건으로 인해 고가 제품군에서도 그 채택이 가속화되고 있습니다.
소비자 조사에 따르면 ‘천연 유래 풍미’를 지닌 초콜릿에 대해 소매 가격의 최대 15%에 달하는 프리미엄을 지불할 의사가 있는 것으로 나타나, 비용 부담이 제조사에서 최종 소비자로 이전되고 있습니다. 그 결과, 2031년까지 천연 유래 제품의 판매량은 바닐린 시장 점유율의 25.60%를 차지할 것으로 예상됩니다. 이에 대응하여 각 합성 제조사들은 생명공학 분야의 지적재산권을 라이선싱하거나, 과이아콜 생산 라인을 바이오 원료에 대응할 수 있도록 개조하는 등의 조치를 취하고 있으며, 하이브리드형 공급 환경이 형성되고 있습니다.
지역별 분석
2025년, 유럽은 견고한 제조 인프라, 엄격한 품질 기준, 식품, 의약품, 퍼스널 케어 산업의 높은 수요에 힘입어 31.10%라는 최고 시장 점유율을 차지하고 있습니다. 유럽의 생산자들은 천연 바닐린과 합성 바닐린의 규제상 차이를 활용하여, 바이오기술 유래 제품의 고부가가치 포지셔닝을 실현하고 있습니다. 독일, 프랑스, 네덜란드, 영국 등의 주요 시장은 고도로 발달된 밸류체인과 고부가가치 용도가 특징이지만, 규제 준수에 드는 비용이 소규모 경쟁사들에게는 과제로 작용하고 있습니다. 유럽 시장은 성숙한 수요 패턴을 보이고 있으며, 클린 라벨(Clean Label) 동향과 의약품 용도의 확대를 통해 꾸준한 성장을 달성하고 있습니다.
아시아태평양은 가장 성장세가 두드러진 지역으로, 2031년까지의 연평균 성장률(CAGR)은 9.30%로 예측됩니다. 이러한 성장은 해당 지역의 식품 가공 산업 확대, 개인 소비 증가, 중국, 인도, 일본, 호주 등 국가에서의 가공 식품 소비 증가에 의해 주도되고 있습니다. 그러나 연방 관보에 따르면 미국이 중국산 바닐린 수입에 대해 190.15%에서 379.87%의 반덤핑 관세를 부과함에 따라 공급망이 재편되고 대체 공급업체에 기회가 생겨나고 있으며, 무역 마찰이 지역 동향에 큰 영향을 미치고 있습니다. 주요 바닐린 생산국인 중국은 규제상 과제에 직면해 있는 반면, 인도 및 동남아시아 시장에서는 도시화와 식습관의 변화를 배경으로 강력한 성장 기회가 예상됩니다.
북미는 확립된 규제 체계와 식품, 의약품, 퍼스널 케어 부문 전반에 걸친 견고한 수요가 특징인 성숙한 시장입니다. 반면, 남미와 중동 및 아프리카에서는 경제 발전과 식품 가공 산업의 확장에 힘입어 새로운 성장 기회가 창출되고 있습니다. 아프리카에서 두 번째로 큰 바닐라 생산국인 우간다(Uganda)는 2024년에 600톤 이상을 수출하며, 천연 바닐린 공급망에서 아프리카 대륙의 잠재력을 여실히 보여주고 있습니다. 바닐린 함량이 4%를 넘는 우간다는 미국 및 EU 시장에서 점유율을 확대하고 있으며, 이는 세계 바닐린 공급망에서 아프리카의 역할이 점점 더 중요해지고 있음을 보여줍니다. 각 지역의 동향은 경제 발전, 규제 변화, 공급망 최적화를 반영하고 있으며, 제조사들은 품질 기준을 유지하면서도 비용 효율적인 생산 거점을 모색하고 있습니다.
기타 혜택
- 엑셀 형식의 시장 예측(ME) 시트
- 3개월간의 애널리스트 지원
자주 묻는 질문
목차
제1장 서론
제2장 조사 방법
제3장 개요
제4장 시장 구도
제5장 시장 규모와 성장 예측
제6장 경쟁 구도
제7장 시장 기회와 향후 전망
KSA 26.08.25According to Mordor Intelligence, the vanillin market size was valued at USD 1.12 billion in 2025 and estimated to grow from USD 1.21 billion in 2026 to reach USD 1.79 billion by 2031, at a CAGR of 8.09% during the forecast period (2026-2031).
This report is Segmented by Type (Natural Vanillin, Synthetic Vanillin), Form (Powder, Crystal, Liquid), Application (Food & Beverage, Pharmaceuticals, Personal Care & Cosmetics, Dietary Supplements and Sports Nutrition, Animal Feed, Others), and Geography (North America, Europe, Asia Pacific, South America, Middle East and Africa). The Market Forecasts are Provided in Terms of Value (USD).
Global Vanillin Market Trends and Insights
Rising demand for natural ingredients in food, beverages, and personal care
As consumers increasingly prefer natural products over synthetic ones, opportunities for premium pricing in bio-based vanillin production are emerging. Thanks to biotechnological advancements, companies can now produce vanillin labeled as "natural" through fermentation processes, allowing them to charge around USD 700 per kilogram. In contrast, synthetic vanillin retails at just USD 15 per kilogram. Researchers at Tokyo University of Science have bioengineered enzymes that transform ferulic acid, sourced from agricultural waste, into vanillin in a single step. This innovation not only addresses sustainability and supply concerns but also ensures the product retains its "natural" classification under FDA regulations. With this breakthrough, manufacturers can tap into the lucrative price gap of USD 1,200-4,000 per kilogram between natural vanilla extracts and their synthetic counterparts, all while adhering to major market regulations for natural labeling.
Advancements in biotechnology and fermentation
Genetic engineering and fermentation technologies are revolutionizing vanillin production economics by enabling scalable natural production without reliance on agriculture. Engineered microbial systems, particularly Saccharomyces cerevisiae and Escherichia coli, have demonstrated commercial feasibility in producing natural vanillin from renewable feedstocks such as eugenol, ferulic acid, and lignin derivatives. Lignin-based processes achieve a 6.2% yield by weight, providing a sustainable alternative to petroleum-based synthetic vanillin while addressing waste management issues in the pulp and paper industry. These innovations position biotechnology companies to capture a significant market share by delivering cost-effective natural vanillin that meets the increasing environmental sustainability expectations of major food and beverage manufacturers.
Volatile supply of natural vanilla beans
Madagascar's dominance in vanilla bean production creates systemic supply risks that cascade through natural vanillin markets, with climate events and political instability generating extreme price volatility. Uganda's emergence as the second-largest vanilla producer with over 600 metric tonnes exported in 2024 provides limited supply diversification, earning USD 16.6 million while achieving vanillin content exceeding 4%. Price bubble analysis identifies five distinct volatility periods linked to cyclones, market speculation, and regulatory changes, with recommendations for direct company-farmer negotiations to enhance stability. Natural vanillin production requires approximately 500 kilograms of vanilla pods per kilogram of vanillin, corresponding to pollination of 40,000 flowers, highlighting the agricultural intensity that constrains supply scalability and drives biotechnological alternatives.
Other drivers and restraints analyzed in the detailed report include:
- Increase in clean-label and organic product adoption
- Rising use as preservative and antioxidant in pharmaceutical formulations
- Stringent regulatory compliance for food additives and synthetic products
For complete list of drivers and restraints, kindly check the Table Of Contents.
Segment Analysis
Synthetic offerings supplied 56.35% of 2025 volume thanks to petro-based guaiacol economics. This segment delivered steady cash flows as the vanillin market size crossed USD 1.12 billion in 2025. Natural variants, however, recorded the highest 8.42% CAGR and will rise from niche to mainstream by 2031 as fermentation costs dip below USD 300 per kg. Borregaard's lignin route, operational since 1993, exemplifies first-mover advantage; newer entrants now mimic the model with higher yields from electrochemical depolymerization. Clean-label mandates in bakery and premium dairy accelerate adoption even at premium price points.
Consumer studies show willingness to pay up to 15% retail premium for "naturally flavored" chocolate, transferring cost absorption from manufacturer to end-user. As a result, natural volumes are expected to represent 25.60% of the vanillin market share by 2031. Synthetic producers respond by licensing biotech IP or retrofitting guaiacol lines for bio-feedstock compatibility, creating a hybrid supply environment.
Complete Report Scope:
- By Type
- Natural Vanillin
- Synthetic Vanillin
- By Form
- Powder
- Crystal
- Liquid
- By Application
- Food & Beverage
- Bakery and Confectionery
- Beverages
- Dairy and Frozen Products
- Other
- Pharmaceuticals
- Personal Care & Cosmetics
- Dietary Supplements and Sports Nutrition
- Animal Feed
- Others
- Food & Beverage
- By Geography
- North America
- United States
- Canada
- Mexico
- Rest of North America
- Europe
- Germany
- France
- United Kingdom
- Netherlands
- Italy
- Rest of Europe
- Asia Pacific
- China
- India
- Japan
- Australia
- Rest of Asia Pacific
- South America
- Brazil\
- Argentina
- Rest of South America
- Middle East and Africa
- Saudi Arabia
- South Africa
- Rest of Middle East and Africa
- North America
Geography Analysis
In 2025, Europe holds a leading 31.10% market share, supported by its strong manufacturing infrastructure, strict quality standards, and high demand from the food, pharmaceutical, and personal care industries. European producers capitalize on regulatory distinctions between natural and synthetic vanillin, enabling premium positioning for biotechnology-derived products. Key markets such as Germany, France, the Netherlands, and the UK feature advanced supply chains and high-value applications, though regulatory compliance costs pose challenges for smaller competitors. The European market exhibits mature demand patterns, with steady growth driven by clean-label trends and the expansion of pharmaceutical applications.
Asia Pacific is the fastest-growing region, with a 9.30% CAGR projected through 2031. This growth is driven by the region's expanding food processing industries, rising consumer spending, and increasing consumption of packaged foods in countries like China, India, Japan, and Australia. However, trade tensions significantly influence regional dynamics, as U.S. antidumping duties of 190.15% to 379.87% on Chinese vanillin imports reshape supply chains and create opportunities for alternative suppliers, according to the Federal Register. While China faces regulatory challenges as a major vanillin producer, India and Southeast Asian markets show strong growth potential, fueled by urbanization and shifting dietary preferences.
North America represents a mature market with well-established regulatory frameworks and strong demand across food, pharmaceutical, and personal care applications. Meanwhile, South America and the Middle East & Africa present emerging growth opportunities, driven by economic development and the expansion of food processing industries. Uganda, as Africa's second-largest vanilla producer, exported over 600 metric tonnes in 2024, highlighting the continent's potential in natural vanillin supply chains. With vanillin content exceeding 4%, Uganda is increasing its market share in the U.S. and EU markets, emphasizing Africa's growing role in global vanillin supply chains. Regional growth trends reflect economic development, regulatory changes, and supply chain optimization as manufacturers seek cost-effective production locations while maintaining quality standards.
- Merck KGaA
- Evolva Holding SA
- Camlin Fine Sciences Ltd
- Borregaard AS
- Jiaxing Zhonghua Chemical Co Ltd
- Syensqo (ex-Solvay)
- Prinova Group LLC
- FoodChem International Corp.
- Lesaffre Et Compagnie
- Veda Oils
- BASF SE
- Givaudan SA
- International Flavors & Fragrances (IFF)
- Sensient Technologies
- Kerry Group
- Symrise AG
- Fujian Xinhua Co Ltd
- Hubei Shuntian Chemical
- Anhui Bayi Chemical
- Beijing Youjiale Flavor
Additional Benefits:
- The market estimate (ME) sheet in Excel format
- 3 months of analyst support
TABLE OF CONTENTS
1 INTRODUCTION
- 1.1 Study Assumptions & Market Definition
- 1.2 Scope of the Study
2 RESEARCH METHODOLOGY
3 EXECUTIVE SUMMARY
4 MARKET LANDSCAPE
- 4.1 Market Overview
- 4.2 Market Drivers
- 4.2.1 Rising demand for natural ingredients in food, beverages, and personal care.
- 4.2.2 Advancements in biotechnology and fermentation
- 4.2.3 Increase in clean-label and organic product adoption.
- 4.2.4 Rising use as preservative and antioxidant in pharmaceutical formulations.
- 4.2.5 Product innovations and customized flavor blends
- 4.2.6 Growth of packaged and processed foods
- 4.3 Market Restraints
- 4.3.1 Volatile supply of natural vanilla beans
- 4.3.2 Stringent regulatory compliance for food additives and synthetic products.
- 4.3.3 High production costs for natural/bio-vanillin.
- 4.3.4 Competitive pressure from alternative flavoring agents.
- 4.4 Supply-Chain Analysis
- 4.5 Regulatory & Technological Outlook
- 4.6 Porter's Five Forces
- 4.6.1 Threat of New Entrants
- 4.6.2 Bargaining Power of Buyers/Consumers
- 4.6.3 Bargaining Power of Suppliers
- 4.6.4 Threat of Substitute Products
- 4.6.5 Intensity of Competitive Rivalry
5 MARKET SIZE AND GROWTH FORECASTS
- 5.1 By Type
- 5.1.1 Natural Vanillin
- 5.1.2 Synthetic Vanillin
- 5.2 By Form
- 5.2.1 Powder
- 5.2.2 Crystal
- 5.2.3 Liquid
- 5.3 By Application
- 5.3.1 Food & Beverage
- 5.3.1.1 Bakery and Confectionery
- 5.3.1.2 Beverages
- 5.3.1.3 Dairy and Frozen Products
- 5.3.1.4 Other
- 5.3.2 Pharmaceuticals
- 5.3.3 Personal Care & Cosmetics
- 5.3.4 Dietary Supplements and Sports Nutrition
- 5.3.5 Animal Feed
- 5.3.6 Others
- 5.3.1 Food & Beverage
- 5.4 By Geography
- 5.4.1 North America
- 5.4.1.1 United States
- 5.4.1.2 Canada
- 5.4.1.3 Mexico
- 5.4.1.4 Rest of North America
- 5.4.2 Europe
- 5.4.2.1 Germany
- 5.4.2.2 France
- 5.4.2.3 United Kingdom
- 5.4.2.4 Netherlands
- 5.4.2.5 Italy
- 5.4.2.6 Rest of Europe
- 5.4.3 Asia Pacific
- 5.4.3.1 China
- 5.4.3.2 India
- 5.4.3.3 Japan
- 5.4.3.4 Australia
- 5.4.3.5 Rest of Asia Pacific
- 5.4.4 South America
- 5.4.4.1 Brazil\
- 5.4.4.2 Argentina
- 5.4.4.3 Rest of South America
- 5.4.5 Middle East and Africa
- 5.4.5.1 Saudi Arabia
- 5.4.5.2 South Africa
- 5.4.5.3 Rest of Middle East and Africa
- 5.4.1 North America
6 COMPETITIVE LANDSCAPE
- 6.1 Market Concentration
- 6.2 Strategic Moves
- 6.3 Market Ranking Analysis
- 6.4 Company Profiles (includes Global level Overview, Market level overview, Core Segments, Financials as available, Strategic Information, Market Rank/Share for key companies, Products & Services, and Recent Developments)
- 6.4.1 Merck KGaA
- 6.4.2 Evolva Holding SA
- 6.4.3 Camlin Fine Sciences Ltd
- 6.4.4 Borregaard AS
- 6.4.5 Jiaxing Zhonghua Chemical Co Ltd
- 6.4.6 Syensqo (ex-Solvay)
- 6.4.7 Prinova Group LLC
- 6.4.8 FoodChem International Corp.
- 6.4.9 Lesaffre Et Compagnie
- 6.4.10 Veda Oils
- 6.4.11 BASF SE
- 6.4.12 Givaudan SA
- 6.4.13 International Flavors & Fragrances (IFF)
- 6.4.14 Sensient Technologies
- 6.4.15 Kerry Group
- 6.4.16 Symrise AG
- 6.4.17 Fujian Xinhua Co Ltd
- 6.4.18 Hubei Shuntian Chemical
- 6.4.19 Anhui Bayi Chemical
- 6.4.20 Beijing Youjiale Flavor


