
|
시장보고서
상품코드
2113357
미국의 석유 및 가스 미드스트림 : 시장 점유율 분석, 업계 동향과 통계, 성장 예측(2026-2031년)United States Oil And Gas Midstream - Market Share Analysis, Industry Trends & Statistics, Growth Forecasts (2026 - 2031) |
||||||
 Mordor Intelligence
Mordor Intelligence에 따르면 미국의 석유 및 가스 미드스트림 시장 규모는 2025년에 171억 달러로 평가되며, 2026년 177억 1,000만 달러에서 2031년까지 210억 8,000만 달러에 달할 것으로 예측되며, 예측 기간(2026-2031년) 동안 CAGR은 3.55%가 될 전망입니다.
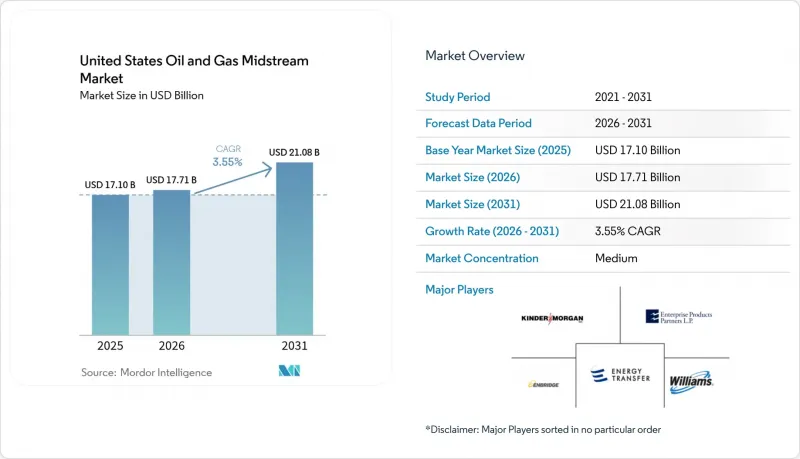
본 보고서는 인프라(파이프라인, 터미널, 저장 시설), 제품 유형(원유, 천연가스, 정제 제품, LNG), 서비스 유형(파이프라인 건설, 파이프라인 유지보수·수리, 저장·취급 서비스, 운송·물류)별로 분류되어 있습니다. 시장 규모 및 전망은 금액(달러)으로 표시되어 있습니다.
미국 석유 및 가스 미드스트림 시장의 동향 및 인사이트
LNG 주도 하에 급증하는 멕시코만 연안의 수출 능력
2028년까지 LNG 가동 능력은 하루 21.2 Bcf까지 증가할 것으로 예상되며, 이는 미국 석유 및 가스 미드스트림 시장에서 파이프라인 처리 능력에 대한 최대 수요 요인이 될 전망입니다. 91마일의 피더 라인을 갖춘 벤처 세계(Venture Global)의 280억 달러 규모 ‘칼카슈 패스 2(Calcasieu Pass 2)’ 프로젝트는 각 터미널이 주간 파이프라인 건설 및 압축 설비 업그레이드를 어떻게 촉발하는지를 보여줍니다. 셰니에르(Cheniere)사의 코퍼스 크리스티 8·9 트레인은 연간 3 Mtpa 이상의 생산능력을 추가하며, 고압 연결을 위한 상호연결마다 5,000만-1억 달러의 비용이 소요됩니다. 양방향 설계가 표준화되어, 유지보수나 허리케인으로 인한 중단 시 파이프라인의 흐름 방향을 반전시킬 수 있습니다. 이로 인해 비용은 증가하지만 회복력은 향상됩니다. 멕시코만 연안 지역에 활동이 집중되어 있어 인력과 특수강 공급이 부족해지면서, 소규모 신규 진입 기업의 설비 투자액이 증가하고 있습니다.
퍼미안 분지의 원유 및 수반 가스 생산 확대
퍼미안 분지의 생산량은 계속해서 출하량을 상회하고 있으며, 원유, 가스, NGL 각 유로에서 새로운 집하, 처리, 장거리 수송 능력에 대한 수요를 견인하고 있습니다. 필립스 66사가 2027년에 가동을 시작할 3억 달러 규모의 아이언 메사 플랜트는 과거 플레어 처리되던 가스를 회수하는 한편, 타르그래스사의 록키 익스프레스로 이어지는 일일 2.4 Bcf 용량의 파이프라인은 서부 시장으로의 접근을 가능하게 합니다. 통합형 운영사는 허브 간 가격 차이에 따라 원유, 가스, NGL 각 파이프라인 간의 수송량을 조정하여, 미국 석유 및 가스 미드스트림 시장의 시스템 현금 흐름을 극대화하고 있습니다. 유량 최적화 소프트웨어를 통해 수송량이 지속적임이 확인될 때까지 새로운 간선 파이프라인의 부설이 보류되고 있습니다. 생산자들은 다품목 대응이 가능한 테이크-오어-페이(take-or-pay) 계약을 제시할 수 있는 화주를 선호하는 경향이 있으며, 협상 우위는 대형 기존 사업자에게 기울어져 있습니다.
연방 허가 절차의 병목 현상(NEPA, 제401조)
내무부가 설정한 1년 이내 환경영향평가(EIS) 목표 덕분에 행정 절차는 간소화되었으나, 소송으로 인해 여전히 부지 확보가 지연되고 있으며, 그 결과 1마일당 최대 200만 달러의 지연 비용이 발생하고 있습니다. 제401조에 따른 수자원 심사에서는 연방 기관이 승인하더라도 주 정부가 프로젝트를 중단시킬 수 있기 때문에 심사 대기 줄이 길어지고 있습니다. 에너지 트랜스퍼(Energy Transfer)의 레이크 찰스(Lake Charles) LNG 확장 프로젝트는 미국 석유 및 가스 미드스트림 시장에서 FERC에 대한 연속적인 신청이 일상화되고 있는 실태를 보여주고 있습니다. 개발업자들은 초기 단계에서 기준선 조사 및 지역 사회와의 협의를 집중적으로 진행하여, FID(최종 투자 결정) 이전의 지출을 늘리면서도 일정을 확보하고 있습니다. 신용 지표를 훼손하지 않으면서 수년에 걸친 지연을 감당할 수 있는 것은 재무 기반이 가장 탄탄한 기업뿐입니다.
부문별 분석
파이프라인은 2025년 미국 석유 및 가스 미드스트림 시장 수익의 44.25%를 차지하며, 각 분지, 처리 시설, 부두를 연결하는 핵심 인프라를 형성하고 있습니다. 육상 자본 비용은 1마일당 평균 400만 달러로, 간선 파이프라인에 대한 투자는 막대하지만, 20년간의 테이크-오어-페이(take-or-pay) 계약이 뒷받침되는 한 정당화될 수 있습니다. 킨더 모건의 93억 달러 규모 수주 잔고(그 중 3분의 2가 가스 수송용)는 대륙 규모의 송배전망 확장에 대한 신뢰가 여전히 높음을 보여줍니다.
신규 건설에서는 양방향 흐름, 구간별 밸브, 고출력 압축기가 중시되고 있으며, 이를 통해 수출 수요와 전력 시장 수요 사이에 가스를 유연하게 배분할 수 있게 됩니다. 이는 구형 파이프라인에는 없는 기능입니다. 터미널 인프라는 2025년 매출에서 차지하는 비중이 17.85%에 불과하지만, LNG 및 LPG 부두가 급증함에 따라 2031년까지 연평균 성장률(CAGR) 4.95%로 확대될 것으로 예상됩니다. 칼카슈 패스 2 프로젝트만 해도 100마일에 가까운 새로운 지선 파이프라인과 2개의 선적 부두가 건설되고 있으며, 이는 각 부두가 시스템 투자를 얼마나 확대하는지를 여실히 보여줍니다. 간과되기 쉬운 저장 동굴과 탱크는 비수기 동안 차익 거래 기회를 포착하거나, 라이선스 문제가 발생했을 때 에탄 수출의 완충 역할을 하는 등 유연성을 제공합니다.
기타 혜택:
- 엑셀 형식의 시장 예측(ME) 시트
- 3개월간의 애널리스트 지원
목차
제1장 소개
제2장 조사 방법
제3장 주요 요약
제4장 시장 구도
제5장 시장 규모와 성장 예측
제6장 경쟁 구도
제7장 시장 기회와 향후 전망
KSMAccording to Mordor Intelligence, the United States oil and gas midstream market size was valued at USD 17.10 billion in 2025 and estimated to grow from USD 17.71 billion in 2026 to reach USD 21.08 billion by 2031, at a CAGR of 3.55% during the forecast period (2026-2031).
This report is Segmented by Infrastructure (Pipelines, Terminals, and Storage Facilities), Product Type (Crude Oil, Natural Gas, Refined Products, and LNG), and Service Type (Pipeline Construction, Pipeline Maintenance and Repair, Storage and Handling Services, and Transportation and Logistics). The Market Sizes and Forecasts are Provided in Terms of Value (USD).
United States Oil And Gas Midstream Market Trends and Insights
LNG-led Surge in Gulf Coast Export Capacity
Operational LNG capability is expected to increase to 21.2 Bcf/d by 2028, creating the single largest draw on pipeline throughput in the US oil and gas midstream market. Venture Global's USD 28 billion Calcasieu Pass 2, featuring a 91-mile feeder line, demonstrates how each terminal triggers interstate pipeline builds and compression upgrades. Cheniere's Corpus Christi Trains 8 & 9 add more than 3 Mtpa and require USD 50-100 million per interconnection for high-pressure tie-ins. Bidirectional design becomes standard, allowing lines to reverse during maintenance or hurricane disruptions, which adds cost but boosts resiliency. Concentrated Gulf activity tightens labor and specialty steel supply, elevating capital expenditures for smaller entrants.
Permian Crude & Associated-gas Production Growth
Permian output continues to outstrip takeaway, driving the need for new gathering, processing, and long-haul capacity across crude, gas, and NGL streams. Phillips 66's USD 300 million Iron Mesa plant, starting in 2027, captures gas once flared, while Tallgrass's 2.4 Bcf/d connector to Rockies Express unlocks western markets. Integrated operators switch volumes among crude, gas, and NGL pipelines based on hub spreads, maximizing system cash flow in the US oil and gas midstream market. Flow-optimization software defers the installation of new trunklines until volumes prove to be durable. Producers favor shippers that can offer multi-commodity take-or-pay contracts, tilting negotiation leverage toward large incumbents.
Federal Permitting Bottlenecks (NEPA, Sec 401)
One-year EIS targets set by Interior reduce paperwork, but lawsuits still stall rights-of-way, resulting in delay costs of up to USD 2 million per mile. Section 401 water reviews allow states to halt projects even when federal agencies approve, thereby prolonging the queue. Energy Transfer's Lake Charles LNG extension shows how serial FERC filings become routine in the US oil and gas midstream market. Developers front-load baseline studies and community outreach, inflating pre-FID spend but safeguarding schedules. Only the largest balance sheets can absorb multi-year delays without jeopardizing credit metrics.
Other drivers and restraints analyzed in the detailed report include:
- AI-Driven Data-Center Power Demand Boosting Gas Throughput
- Rising Ethane Recovery for Petrochemical Feedstock
- Activist Opposition / ESG Capital Constraints
For complete list of drivers and restraints, kindly check the Table Of Contents.
Segment Analysis
Pipelines supplied 44.25% of 2025 revenue for the US oil and gas midstream market and form the connective backbone among basins, processors, and docks. Capital cost averages USD 4 million per mile onshore, making trunkline investments sizable yet defensible when underpinned by 20-year take-or-pay contracts. Kinder Morgan's USD 9.3 billion backlog, two-thirds of which is dedicated to gas transmission, signals continued faith in continental grid expansion.
New builds emphasize bidirectional flow, sectionalized valves, and high-horsepower compression to swing gas between export and power-market pulls, features that older pipe lacks. Terminal infrastructure, although accounting for only 17.85% of 2025 revenue, is expected to advance at a 4.95% CAGR through 2031 as LNG and LPG docks proliferate. Calcasieu Pass 2 alone drives nearly 100 miles of new lateral pipe and twin loading berths, underscoring how each dock multiplies system spend. Storage caverns and tanks, often overlooked, yield optionality to capture shoulder-season arbitrage and to buffer ethane exports during license upheavals.
Complete Report Scope:
- By Infrastructure
- Pipelines
- Terminals
- Storage Facilities (Underground and Above-ground)
- By Product Type
- Crude Oil
- Natural Gas
- Refined Products
- LNG
- By Service Type
- Pipeline Construction
- Pipeline Maintenance and Repair
- Storage and Handling Services
- Transportation and Logistics
List of Companies Covered in this Report:
- Kinder Morgan Inc.
- Energy Transfer LP
- Enterprise Products Partners LP
- Enbridge Inc. (U.S. assets)
- Williams Companies Inc.
- MPLX LP
- ONEOK Inc.
- Plains All American Pipeline LP
- Targa Resources Corp.
- DT Midstream Inc.
- Cheniere Energy Inc.
- TC Energy Corp. (Columbia Gas)
- Magellan Midstream (ONEOK)
- WhiteWater Midstream LLC
- Atlantic Coast Pipeline LLC
- Maritimes & Northeast Pipeline LLC
- Tallgrass Energy LP
- Genesis Energy LP
- Shell Pipeline Company LP
- Freeport LNG Development LP
Additional Benefits:
- The market estimate (ME) sheet in Excel format
- 3 months of analyst support
TABLE OF CONTENTS
1 Introduction
- 1.1 Study Assumptions & Market Definition
- 1.2 Scope of the Study
2 Research Methodology
3 Executive Summary
4 Market Landscape
- 4.1 Market Overview
- 4.2 Market Drivers
- 4.2.1 LNG-led surge in Gulf Coast export capacity
- 4.2.2 Permian crude & associated-gas production growth
- 4.2.3 AI-driven data-center power demand boosting gas throughput
- 4.2.4 Rising ethane recovery for petrochemical feedstock
- 4.2.5 Digitization & predictive-maintenance adoption by operators
- 4.2.6 CCUS pipeline build-out incentives (IRA 45Q)
- 4.3 Market Restraints
- 4.3.1 Federal permitting bottlenecks (NEPA, Sec. 401)
- 4.3.2 Activist opposition / ESG capital constraints
- 4.3.3 Long-haul oil pipeline over-capacity in legacy corridors
- 4.3.4 China-focused ethane export license uncertainty
- 4.4 Supply-Chain Analysis
- 4.5 Regulatory Landscape
- 4.6 Technological Outlook
- 4.7 Installed Pipeline Capacity Analysis
- 4.8 Porter's Five Forces
- 4.8.1 Threat of New Entrants
- 4.8.2 Bargaining Power of Suppliers
- 4.8.3 Bargaining Power of Buyers
- 4.8.4 Threat of Substitutes
- 4.8.5 Industry Rivalry
- 4.9 PESTLE Analysis
5 Market Size & Growth Forecasts
- 5.1 By Infrastructure
- 5.1.1 Pipelines
- 5.1.2 Terminals
- 5.1.3 Storage Facilities (Underground and Above-ground)
- 5.2 By Product Type
- 5.2.1 Crude Oil
- 5.2.2 Natural Gas
- 5.2.3 Refined Products
- 5.2.4 LNG
- 5.3 By Service Type
- 5.3.1 Pipeline Construction
- 5.3.2 Pipeline Maintenance and Repair
- 5.3.3 Storage and Handling Services
- 5.3.4 Transportation and Logistics
6 Competitive Landscape
- 6.1 Market Concentration
- 6.2 Strategic Moves (M&A, Partnerships, PPAs)
- 6.3 Market Share Analysis (Market Rank/Share for key companies)
- 6.4 Company Profiles (includes Global level Overview, Market level overview, Core Segments, Financials as available, Strategic Information, Products & Services, and Recent Developments)
- 6.4.1 Kinder Morgan Inc.
- 6.4.2 Energy Transfer LP
- 6.4.3 Enterprise Products Partners LP
- 6.4.4 Enbridge Inc. (U.S. assets)
- 6.4.5 Williams Companies Inc.
- 6.4.6 MPLX LP
- 6.4.7 ONEOK Inc.
- 6.4.8 Plains All American Pipeline LP
- 6.4.9 Targa Resources Corp.
- 6.4.10 DT Midstream Inc.
- 6.4.11 Cheniere Energy Inc.
- 6.4.12 TC Energy Corp. (Columbia Gas)
- 6.4.13 Magellan Midstream (ONEOK)
- 6.4.14 WhiteWater Midstream LLC
- 6.4.15 Atlantic Coast Pipeline LLC
- 6.4.16 Maritimes & Northeast Pipeline LLC
- 6.4.17 Tallgrass Energy LP
- 6.4.18 Genesis Energy LP
- 6.4.19 Shell Pipeline Company LP
- 6.4.20 Freeport LNG Development LP
7 Market Opportunities & Future Outlook
- 7.1 White-space & Unmet-Need Assessment