

|
시장보고서
상품코드
2113642
유정 개입 : 시장 점유율 분석, 업계 동향 및 통계, 성장 예측(2026-2031년)Well Intervention - Market Share Analysis, Industry Trends & Statistics, Growth Forecasts (2026 - 2031) |
||||||
 Mordor Intelligence
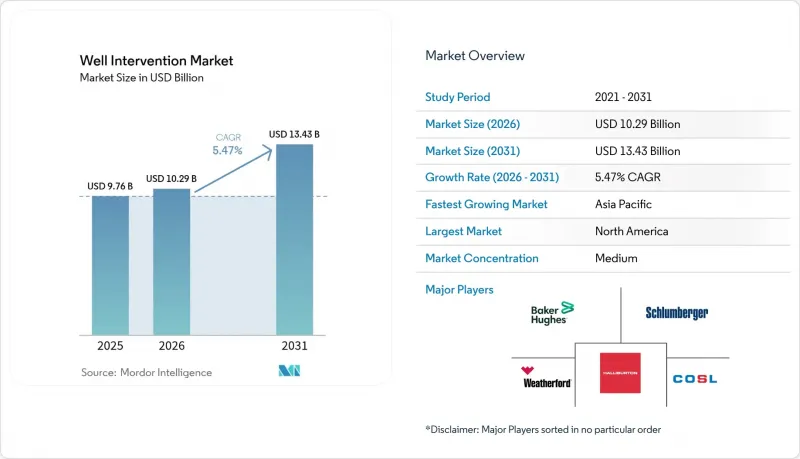
Mordor Intelligence에 의하면, 유정 개입 시장 규모는 2025년에 97억 6,000만 달러, 2026년 102억 9,000만 달러에서 2031년까지 134억 3,000만 달러에 이를 것으로 예측되며, 예측 기간(2026년-2031년) CAGR은 5.47%를 기록할 전망입니다.
본 보고서는 도입 지역(육상 및 해상), 서비스 유형(지층 조사 및 유정 바닥 조사, 자극 처리 등), 개입 유형(경도, 중도, 중도/워크오버), 유정 유형(수평 유정 및 수직 유정), 유정 깊이(얕은 바다, 심해(400-1,500미터), 초심해), 지역(북미, 유럽, 아시아태평양, 남미 등)별로 분류되어 있습니다.
전 세계 유정 개입 시장 동향 및 인사이트
성숙한 육상 유정에서의 워크오버 수요 증가
북미 및 유럽의 운영사들은 신규 시추보다 워크오버 프로그램을 우선시함으로써 자산의 수명 주기를 연장하고 있습니다. 2010년부터 2015년까지의 셰일 붐 기간에 시추된 유정에서는 인공 채유 시스템의 업그레이드, 자극 처리 및 기계적 수리가 필요합니다. 이는 일반적으로 성숙한 유전에서 신규 유정을 시추할 때 얻는 5-10%의 증산 효과에 비해 20-30%의 생산량 향상을 가져옵니다. 베이커 휴즈(Baker Hughes)는 2024년에 1만 5,000건 이상의 인공 채유 설비 설치를 완료했으며, 그중 60%는 북미 육상 분지에서 이루어졌습니다. 자산 수명 주기의 연장에 따른 정기적인 개입 작업은 서비스 제공업체에 안정적인 수익을 가져다주는 동시에, 운영사의 자본 규율과 기존 인프라를 통한 수익 극대화 전략을 뒷받침합니다.
심해 및 초심해 개발의 확대
수심 1,500미터를 초과하는 초심해 프로젝트는 기술적 복잡성과 서비스 요금의 프리미엄을 높이고 있습니다. 멕시코만에서 셰브론이 진행 중인 20,000 psi ‘앵커’ 프로젝트는 개입 작업을 안전하고 효율적으로 수행하는 데 필요한 전문 장비의 한 예입니다. 심해 서비스 가격은 얕은 바다 수준보다 40-60% 더 높습니다. 페트로브라스는 2024년, 프레솔트층 전역에 걸친 심해 개입 계약을 SLB에 18억 달러에 발주하며, 복잡한 해양 유전 개발에 대한 견실한 투자를 시사하고 있습니다. 리그레스 개입 기술은 극히 고가의 드릴십(drill ship)을 대체함으로써 비용 위험을 경감시키지만, 심해 분야로의 진입 장벽은 여전히 통합된 역량 체계를 갖춘 유서 깊은 다국적 기업에 유리하게 작용하고 있습니다.
원유 가격 변동이 E&P 설비 투자 주기를 억제
배럴당 55달러 아래로 떨어질 때마다 운영사가 비필수 프로젝트를 연기함에 따라 개입 예산이 15-25% 삭감됩니다. 2024년에는 해양 시추 장비의 가동률이 하락했으며, 현물 가격과 재량적 개입 작업 범위 사이에 직접적인 상관관계가 있음이 밝혀졌습니다. 서비스 수익은 경기 순환에 따라 최대 40%까지 변동하기 때문에 서비스 제공 기업은 비용 기반을 관리하고 유연한 인력 체제를 유지할 수밖에 없습니다. 자유 현금 흐름 지표에 기반한 자본 규율은 원자재 가격이 안정될 때까지 유정 개입 시장의 성장에 대한 주요 제약 요인으로 남아 있을 것입니다.
부문별 분석
2025년, 해양 개입 사업은 견실한 수익을 창출할 것이며, 심해 및 초심해 유정이 프리미엄 요율의 작업을 주도함에 따라 이 부문은 2031년까지 연평균 성장률(CAGR) 6.78%로 성장할 전망입니다. 이러한 고사양 프로젝트는 유정 개입 시장의 상당 부분을 차지하고 있으며, 서비스 가격은 육상에서의 동등한 작업에 비해 40-60% 높은 수준인 경우가 많습니다. Expro사의 AX-S 시스템으로 대표되는 ‘라이저리스 라이트 웰 인터벤션 선박’은 기존 시추 장비 지원으로는 15-20일이 소요되던 해양 작업을 불과 6-8일 만에 완료할 수 있습니다. 운영사들은 가동 중단 시간 단축과 승무원 수 감소를 통한 안전성 향상을 중시하고 있어, 자본 집약도가 높음에도 불구하고 해양 수요를 뒷받침하고 있습니다.
2025년에도 육상 작업은 여전히 73.25%의 점유율을 차지하며 주도적인 위치를 유지하고 있습니다. 이는 수천 개의 노후된 셰일 유정이 정기적인 워크오버, 인공 채유 장치 교체 및 자극 처리의 갱신 주기를 필요로 하기 때문입니다. 낮은 단가와 접근성 덕분에 빈번한 개입이 가능하며, 개선된 코일 튜브 장비를 통해 기존 서비스 비용 대비 20-30%의 비용 절감이 실현되고 있습니다. 에너지 수요와 국내 자원 개발이 가속화되는 가운데, 아시아태평양 및 라틴아메리카가 북미에 이어 활발한 육상 거점으로 부상하고 있습니다.
자극 처리 서비스는 2031년까지 연평균 성장률(CAGR)이 7.35%로 예측되며, 성장률 순위에서 1위를 차지하고 있습니다. 유화산, 지퍼 프랙처링, 심룰프랙 등의 기술 발전으로 접촉 효율이 향상되는 동시에 필요한 마력이 감소하고 있습니다. 베이커 휴즈의 ‘OptiPort’ 기술은 프로판트의 분포를 개선하고 지상 설비의 설치 면적을 줄이는 것을 입증하고 있습니다. 운영사는 상품 가격이 추가적인 생산량 증가를 정당화할 경우, 이러한 영향력이 큰 처리를 우선시합니다.
로깅 및 유정 바닥 조사 서비스는 저류층 이미징과 기계적 진단이 효과적인 개입 계획의 전제조건으로 계속 작용하고 있기 때문에 31.90%의 시장 점유율을 유지하고 있습니다. 광섬유 전송과 실시간 분석을 통해 의사결정 주기가 단축되어 작업 팀은 현장에서 즉시 작업 내용을 조정할 수 있게 됩니다. 인공 채유, 워크오버 및 피싱, 그리고 구역 격리 등의 틈새 서비스는 생산량 감소나 장비 고장 시 발생하는 특정 유정 내 문제를 해결함으로써 서비스 포트폴리오를 보강하고 있습니다.
지역별 분석
2025년, 북미는 유정 개입 시장의 38.95%를 차지했습니다. 이는 생산성이 높은 셰일 분지, 엄격한 메탄 규제, 멕시코만의 심해 자산이 맞물려 높은 서비스 수요가 유지되고 있기 때문입니다. 각 운영사들은 디지털 슬릭라인, 실시간 광섬유 도구, 자율형 로봇을 활용하여 엄격한 환경 기준을 충족하면서도 효율을 20-30% 향상시키고 있습니다. 정기적인 재파쇄 작업을 통해 신규 시추가 둔화되더라도 가압 펌프 설비의 가동률이 유지되고 있습니다.
유럽은 북해를 핵심으로 하는 성숙해 가고 있지만 여전히 활발한 시장으로서 그 뒤를 잇고 있습니다. 노르웨이와 영국에서는 수명 말기 자산의 최적화가 장려되고 있으며, 이산화탄소 포집 및 저장(CCS)으로의 전환이 새로운 개입 수요를 창출하고 있습니다. 엄격한 ESG 정책에 따라 메탄 대책과 유정 건전성 관리가 운영상의 최우선 과제로 자리 잡고 있으며, 기술 집약형 서비스 계약이 촉진되고 있습니다.
아시아태평양은 유정 개입 시장에서 가장 빠르게 성장하는 지역으로, 2031년까지 연평균 성장률(CAGR) 6.28%가 예상됩니다. 동남아시아의 활발한 에너지 수요, 지원적인 정부 정책, 그리고 야심 찬 해양 가스 프로젝트가 첨단 개입 기술의 도입을 뒷받침하고 있습니다. 중국의 육상 시추 장비에 대한 높은 수요와 인도의 업스트림 부문 자유화가 시장 규모를 확대하는 한편, 호주의 성숙한 해양 유전에서는 LNG 수출 인프라를 유지하기 위해 첨단 개입 기술이 요구되고 있습니다.
기타 혜택:
- 엑셀 형식 시장 전망(ME) 시트
- 3개월간의 애널리스트 지원
자주 묻는 질문
목차
제1장 서론
제2장 조사 방법
제3장 주요 요약
제4장 시장 구도
제5장 시장 규모와 성장 예측
제6장 경쟁 구도
제7장 시장 기회와 향후 전망
LSH 26.08.25According to Mordor Intelligence, the well intervention market size was valued at USD 9.76 billion in 2025 and estimated to grow from USD 10.29 billion in 2026 to reach USD 13.43 billion by 2031, at a CAGR of 5.47% during the forecast period (2026-2031).
This report is Segmented by Location of Deployment (Onshore and Offshore), Service Type (Logging and Bottom-Hole Survey, Stimulation, and More), Intervention Type (Light, Medium, and Heavy/Workover), Well Type (Horizontal Wells and Vertical Wells), Well Depth (Shallow Water, Deep Water (400 To 1500 M), and Ultra-Deep Water ), and Geography (North America, Europe, Asia Pacific, South America, and More).
Global Well Intervention Market Trends and Insights
Rising Workover Demand from Maturing Onshore Wells
North American and European operators stretch asset life cycles by prioritizing workover programs over fresh drilling. Wells drilled during the 2010-2015 shale expansion need artificial-lift upgrades, stimulation, and mechanical repairs that typically secure 20-30% production uplifts versus 5-10% gains from drilling new wells in mature fields. Baker Hughes completed more than 15,000 artificial-lift installations in 2024, 60% of which were in North American onshore basins. Recurring interventions across extended asset life cycles offer steady revenue to service providers and underscore operators' capital discipline and return-on-existing-infrastructure strategies.
Escalation of Deep- and Ultra-Deep-Water Developments
Ultra-deep-water projects beyond 1,500 m depth are raising technical complexity and service premiums. Chevron's 20,000 psi Anchor project in the Gulf of Mexico illustrates the specialized equipment needed to execute interventions safely and efficiently. Service prices in deep water stand 40-60% above shallow-water rates. Petrobras awarded SLB a USD 1.8 billion deep-water intervention contract across pre-salt fields in 2024, signaling robust investment in complex offshore plays. Rigless intervention technologies mitigate cost exposure by replacing ultra-expensive drillships, but deep-water barriers to entry still favor established multinationals with integrated capability suites.
Crude-Price Volatility Curbing E&P Capex Cycles
Every dip below USD 55 per barrel triggers 15-25% cuts in intervention budgets as operators defer non-essential projects. Offshore rig utilization slipped in 2024, revealing a direct link between spot pricing and discretionary intervention work scopes. Service revenues swing by up to 40% across cycles, forcing providers to manage cost bases and maintain flexible crews. Capital discipline anchored on free-cash-flow metrics remains a primary check on well intervention market growth until commodity prices stabilize.
Other drivers and restraints analyzed in the detailed report include:
- Shale Revival in North America Fuelling Re-fracturing Jobs
- Mandated Methane-Leak Remediation Interventions
- Growing Preference for Rigless Completions
For complete list of drivers and restraints, kindly check the Table Of Contents.
Segment Analysis
Offshore interventions generated robust revenue in 2025, and the segment is positioned for a 6.78% CAGR through 2031 as deep-water and ultra-deep-water wells drive premium-rate work. These high-specification projects underpin a sizeable portion of the well intervention market, and service prices often sit 40-60% above onshore equivalents. Riserless-light-well-intervention vessels, typified by Expro's AX-S system, can finish offshore jobs in 6-8 days versus 15-20 days for conventional rig support. Operators value reduced downtime and safer crew counts, reinforcing offshore demand despite elevated capital intensity.
Onshore operations still dominate with a 73.25% share in 2025 because thousands of aging shale wells need periodic workovers, artificial-lift changes, and stimulation refresh cycles. Lower unit costs and greater accessibility allow frequent interventions, and upgraded coiled-tubing units shave 20-30% from historical service bills. Asia Pacific and Latin America join North America as active onshore hubs as energy demand and domestic resource development accelerate.
Stimulation services rule the growth table with a forecast 7.35% CAGR through 2031. Advances such as emulsified acids, zipper fracturing, and simul-frac enhance contact efficiency while lowering horsepower requirements; Baker Hughes' OptiPort technology demonstrates better proppant distribution and reduced surface equipment footprint. Operators prioritize these high-impact treatments when commodity prices justify the incremental uplift.
Logging and bottom-hole survey services preserve a 31.90% share because reservoir imaging and mechanical diagnostics remain prerequisites for effective intervention planning. Fiber-optic conveyance and real-time analytics shorten decision loops, letting crews adjust operations on the fly. Artificial-lift, workover and fishing, and niche services such as zonal isolation round out portfolios by solving specific down-hole challenges that surface during production declines or equipment failures.
Complete Report Scope:
- By Location of Deployment
- Onshore
- Offshore
- By Service Type
- Logging and Bottom-hole Survey
- Stimulation
- Artificial Lift
- Workover and Fishing
- Others (Zonal Isolation, Sand Control etc.)
- By Intervention Type
- Light (Slickline, E-line, CT)
- Medium
- Heavy/Workover
- By Well Type
- Horizontal wells
- Vertical wells
- By Well Depth
- Shallow Water (Below 400 m)
- Deep Water (400 to 1,500 m)
- Ultra-Deep Water (Above 1,500 m)
- By Geography
- North America
- United States
- Canada
- Mexico
- Europe
- United Kingdom
- Norway
- Germany
- Russia
- Rest of Europe
- Asia Pacific
- China
- India
- Japan
- ASEAN Countries
- Australia
- Rest of Asia Pacific
- South America
- Brazil
- Argentina
- Rest of South America
- Middle East and Africa
- Saudi Arabia
- United Arab Emirates
- Qatar
- South Africa
- Rest of Middle East and Africa
- North America
Geography Analysis
North America held 38.95% of the well intervention market in 2025 as prolific shale basins, tough methane regulations, and deep-water Gulf of Mexico assets combine to sustain high service intensity. Operators leverage digital slickline, real-time fiber-optic tools, and autonomous robotics to improve efficiency by 20-30% while meeting stringent environmental standards. Recurring refrac campaigns maintain capacity utilization for pressure pumping fleets even when fresh drilling slows.
Europe follows with a mature yet active theater anchored by the North Sea. Norway and the UK incentivize late-life asset optimization, and carbon-capture storage conversions add fresh intervention demand streams. Stringent ESG policies elevate methane remediation and well-integrity management to core operating priorities, prompting technology-heavy service contracts.
Asia Pacific is the fastest-growing well intervention market fastest-growing region, set for a 6.28% CAGR through 2031. Strong energy demand, supportive government policies, and ambitious offshore gas projects in Southeast Asia spur the deployment of advanced intervention technologies. China's voracious land rig appetite and India's upstream liberalization add scale, while Australia's mature offshore fields require sophisticated interventions to sustain LNG export infrastructure.
- Schlumberger Limited
- Halliburton Company
- Baker Hughes Company
- Weatherford International plc
- Expro Group Holdings NV
- National Oilwell Varco Inc.
- Vallourec SA
- Scientific Drilling International
- China Oilfield Services Ltd (COSL)
- Helix Energy Solutions Group Inc.
- Archer Ltd.
- Welltec A/S
- Superior Energy Services Inc.
- Trican Well Service Ltd.
- Aker Solutions ASA
- Altus Intervention AS
- Hunting PLC
- TechnipFMC plc
- Petrofac Ltd.
- Oceaneering International Inc.
Additional Benefits:
- The market estimate (ME) sheet in Excel format
- 3 months of analyst support
TABLE OF CONTENTS
1 Introduction
- 1.1 Study Assumptions & Market Definition
- 1.2 Scope of the Study
2 Research Methodology
3 Executive Summary
4 Market Landscape
- 4.1 Market Overview
- 4.2 Market Drivers
- 4.2.1 Rising workover demand from maturing onshore wells
- 4.2.2 Escalation of deep- and ultra-deep-water developments
- 4.2.3 Shale revival in North America fuelling re-fracturing jobs
- 4.2.4 Mandated methane-leak remediation interventions
- 4.2.5 Adoption of digital slickline & autonomous down-hole robots
- 4.2.6 Emerging carbon-capture & storage (CCS) well conversions
- 4.3 Market Restraints
- 4.3.1 Crude-price volatility curbing E&P capex cycles
- 4.3.2 Growing preference for rigless completions
- 4.3.3 ESG-driven capital flight from hydrocarbons
- 4.4 Supply-Chain Analysis
- 4.5 Regulatory Landscape
- 4.6 Technological Outlook
- 4.7 Major Upcoming Upstream Projects
- 4.8 Porter's Five Forces
- 4.8.1 Bargaining Power of Suppliers
- 4.8.2 Bargaining Power of Buyers
- 4.8.3 Threat of New Entrants
- 4.8.4 Threat of Substitute Products & Services
- 4.8.5 Intensity of Competitive Rivalry
5 Market Size & Growth Forecasts
- 5.1 By Location of Deployment
- 5.1.1 Onshore
- 5.1.2 Offshore
- 5.2 By Service Type
- 5.2.1 Logging and Bottom-hole Survey
- 5.2.2 Stimulation
- 5.2.3 Artificial Lift
- 5.2.4 Workover and Fishing
- 5.2.5 Others (Zonal Isolation, Sand Control etc.)
- 5.3 By Intervention Type
- 5.3.1 Light (Slickline, E-line, CT)
- 5.3.2 Medium
- 5.3.3 Heavy/Workover
- 5.4 By Well Type
- 5.4.1 Horizontal wells
- 5.4.2 Vertical wells
- 5.5 By Well Depth
- 5.5.1 Shallow Water (Below 400 m)
- 5.5.2 Deep Water (400 to 1,500 m)
- 5.5.3 Ultra-Deep Water (Above 1,500 m)
- 5.6 By Geography
- 5.6.1 North America
- 5.6.1.1 United States
- 5.6.1.2 Canada
- 5.6.1.3 Mexico
- 5.6.2 Europe
- 5.6.2.1 United Kingdom
- 5.6.2.2 Norway
- 5.6.2.3 Germany
- 5.6.2.4 Russia
- 5.6.2.5 Rest of Europe
- 5.6.3 Asia Pacific
- 5.6.3.1 China
- 5.6.3.2 India
- 5.6.3.3 Japan
- 5.6.3.4 ASEAN Countries
- 5.6.3.5 Australia
- 5.6.3.6 Rest of Asia Pacific
- 5.6.4 South America
- 5.6.4.1 Brazil
- 5.6.4.2 Argentina
- 5.6.4.3 Rest of South America
- 5.6.5 Middle East and Africa
- 5.6.5.1 Saudi Arabia
- 5.6.5.2 United Arab Emirates
- 5.6.5.3 Qatar
- 5.6.5.4 South Africa
- 5.6.5.5 Rest of Middle East and Africa
- 5.6.1 North America
6 Competitive Landscape
- 6.1 Market Concentration
- 6.2 Strategic Moves (M&A, Partnerships, PPAs)
- 6.3 Market Share Analysis (Market Rank/Share for key companies)
- 6.4 Company Profiles (includes Global level Overview, Market level overview, Core Segments, Financials as available, Strategic Information, Products & Services, and Recent Developments)
- 6.4.1 Schlumberger Limited
- 6.4.2 Halliburton Company
- 6.4.3 Baker Hughes Company
- 6.4.4 Weatherford International plc
- 6.4.5 Expro Group Holdings NV
- 6.4.6 National Oilwell Varco Inc.
- 6.4.7 Vallourec SA
- 6.4.8 Scientific Drilling International
- 6.4.9 China Oilfield Services Ltd (COSL)
- 6.4.10 Helix Energy Solutions Group Inc.
- 6.4.11 Archer Ltd.
- 6.4.12 Welltec A/S
- 6.4.13 Superior Energy Services Inc.
- 6.4.14 Trican Well Service Ltd.
- 6.4.15 Aker Solutions ASA
- 6.4.16 Altus Intervention AS
- 6.4.17 Hunting PLC
- 6.4.18 TechnipFMC plc
- 6.4.19 Petrofac Ltd.
- 6.4.20 Oceaneering International Inc.
7 Market Opportunities & Future Outlook
- 7.1 White-space & Unmet-need Assessment


