

|
시장보고서
상품코드
2114020
시추 중 검층(LWD) : 시장 점유율 분석, 업계 동향과 통계, 성장 예측(2026-2031년)Logging While Drilling (LWD) - Market Share Analysis, Industry Trends & Statistics, Growth Forecasts (2026 - 2031) |
||||||
 Mordor Intelligence
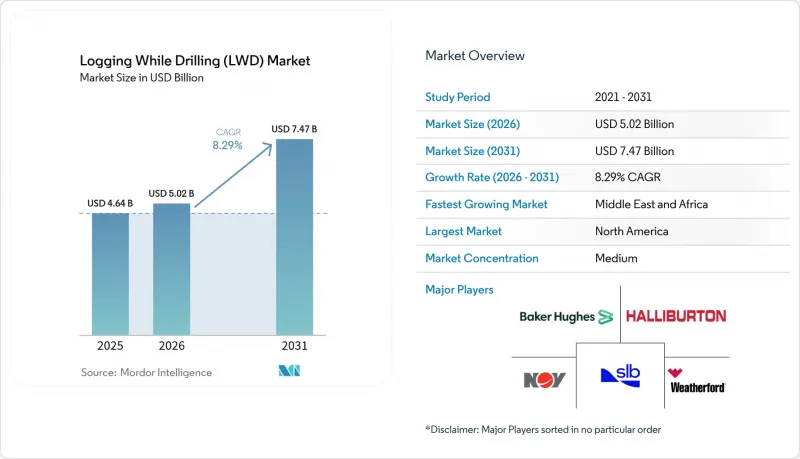
Mordor Intelligence에 따르면 2026년 시추 중 검층(LWD) 시장의 규모는 50억 2,000만 달러로 추정되고 있으며, 2025년 46억 4,000만 달러에서 확대하며, 2031년에는 74억 7,000만 달러에 달할 것으로 예측됩니다.
2026-2031년의 연평균 성장률(CAGR)은 8.29%에 달할 전망입니다.
이 보고서는 서비스 유형(비저항 LWD, 압력 및 유체 시료 채취 등), 용도(지층 평가, 지오스티어링 및 저류층 내비게이션 등), 유정 유형(기존형 수직 유정, HPHT, 수평 유정 및 연장 리치 유정),운영 지역(육상, 해양), 지역(북미, 유럽, 아시아태평양, 남미, 중동 및 아프리카)별로 분류되어 있습니다.
전 세계 시추 중 검층(LWD) 시장의 동향 및 인사이트
셰일 및 심해 시추 활동의 증가
2024년, 각 운영사가 브라질의 프레스솔트층과 멕시코만에서 수익성이 높은 유전 개발을 추진한 결과, 심해 시추 리그의 가동률은 평균 92%에 달했으며, 불안정한 유정에서는 와이어라인 툴로는 제공할 수 없는 실시간 유정내 데이터에 대한 수요가 높아졌습니다. SLB가 페트로브라스의 100개 이상의 유정을 대상으로 체결한 8억 달러 규모의 계약은, 복잡한 저류층을 탐색하기 위해 자율형 지오스티어링에 의존하는 향후 예정된 초심해 시추 프로젝트의 규모를 여실히 보여줍니다. 퍼미안 분지 역시 수요를 더욱 증가시키고 있습니다. 측면 유정의 연장이나 다층 시추 작업에서는 생산층과의 접촉을 유지하기 위해 지속적인 지층 평가가 필요합니다.
실시간 지층 평가 도입
할리버튼의 LOGIX 자동화 플랫폼은 시추공내 저항률 및 감마선 원격 측정 데이터를 비트 하중과 회전 속도를 조정하는 지상 알고리즘과 통합한 결과, 시추 속도가 최대 30% 향상되었습니다. SLB의 Neuro 시스템은 에콰도르의 한 유정에서 수동 모니터링 없이 25회의 자동 궤적 보정을 수행하며 시추를 진행함으로써, AI가 지하 데이터와 비트 방향성 간의 루프를 어떻게 연결하는지를 입증했습니다. 별도의 와이어라인 작업을 배제함으로써 복잡한 경사 우물에서 총 시추 기간을 10-15% 단축할 수 있으므로, 고비용 환경에서는 실시간 지층 평가가 필수적인 요건이 되고 있습니다.
원유 가격 변동이 E&P의 설비 투자를 억제
미국의 독립 기업은 브렌트 원유 가격이 배럴당 80달러 전후로 추이하고 있음에도 불구하고 2024-2025년에 시추 예산을 삭감하며 성장 투자보다 부채 감축과 배당을 우선시하고 있습니다. 2025년 전 세계 E&P 투자액은 600억-650억 달러 전후에 그칠 것으로 예상되며, LWD 수요가 가장 높은 초기 단계의 탐사가 위축되고 있습니다. 심해 메가 프로젝트는 진행 중이지만, 소규모 셰일 사업자들은 자유 현금 흐름 창출에 주력하고 있으며, 시추 장비 확충은 완만한 속도에 그치고 있습니다.
부문 분석
2025년, 비저항 측정 서비스는 LWD 시장 규모의 33.78%를 차지하며, 거의 모든 유정에서 필요한 기본 측정으로서 그 입지를 확고히 다졌습니다. 탄화수소 함유대를 실시간으로 식별하는 능력 덕분에 육상 및 해양 프로젝트 모두에서 지속적인 채택이 예상됩니다. 이 부문은 시추 중 비저항 곡선을 암상 예측으로 변환하는 기계학습 알고리즘의 혜택을 받고 있으며, 측정이 자동화된 워크플로우에 더욱 통합되고 있습니다. 압력 및 유체 샘플링은 현재 시장 점유율은 작지만, 운영사가 시추를 중단하지 않고도 동적 지층 압력 데이터 및 유체 유형을 파악하고자 함에 따라 연평균 성장률(CAGR) 10.95%로 시장을 주도할 것으로 예상됩니다. SLB사의 ‘SpectraSphere’ 툴와 베이커 휴즈사의 ‘AziTrak’ 시리즈는 기존에는 별도의 와이어라인 작업이 필요했던 시추공내 PVT 샘플링을 가능하게 함으로써 이러한 추세를 상징하고 있습니다. 성숙한 분지 전역에서 감마선, 밀도 중성자 및 음향 패키지는 여전히 공극률 및 암상 평가의 주류를 이루고 있습니다. 한편, 보홀 이미징은 시각화가 최종 설계의 지침이 되는 파쇄 탄산염암에서 다시 주목받고 있습니다.
서비스 부문의 경쟁 구도는 센서의 지속적인 소형화와 텔레메트리용 데이터 대역폭의 확대로 특징지어집니다. 현재, 비저항 측정 툴은 30 bps의 머드 펄스 속도로 다중 깊이 측정값을 전송할 수 있게 되어, 감마선 및 압력 데이터 스트림의 동시 전송이 가능해졌습니다. 시료 채취 분야에서는 시추공내 분광 분석을 통해 지표면 연구소에서 시추 장비의 실시간 디스플레이에 이르기까지 이동하는 유체를 식별할 수 있게 되어 의사결정의 정확도가 향상되고 있습니다. 이러한 기술 업그레이드로 인해 디지털 유전 예산이 증가하는 가운데, 기존 및 신흥 서비스 사업자 모두 추가적인 지출을 확보할 수 있는 입장에 있습니다.
2025년에는 시추 중 지층 평가(LWD) 시장 점유율의 42.35%를 지층 평가가 차지했습니다. 이는 모든 시추 시작시 저류층 및 유체의 특성 평가가 필수적이기 때문입니다. 시추 중 다공도, 저항률, 밀도, 음파 시추 데이터 등을 제공하는 툴은 유정 건설 기간을 단축하고, 심해 유정 1개당 40만-60만 달러의 비용 절감을 실현합니다. 한편, 수평 구간이 10,000피트를 초과하고 생산층이 10피트 미만으로 좁아짐에 따라 지오스티어링은 연평균 성장률(CAGR) 9.85%로 확대되고 있습니다. Neuro와 같은 자율 시스템은 시추공 비저항 이미지를 이용하여 몇 초 이내에 비트의 방향을 조정함으로써, 얇은 대상층에서의 생산률을 극대화합니다. 또한 고압·고온(HPHT) 유정에서는 유정 안정성 모니터링도 주목을 받고 있으며, 실시간 캘리퍼 측정 및 음파 전단 측정을 통해 브레이크아웃 위험에 대한 조기 경보가 가능해졌습니다. 마지막으로 실시간 시추 최적화에서는 LWD 데이터와 지표면 분석을 융합하여 시추공 품질을 확보하면서 시추 속도를 극대화하고 있으며, 이는 자율형 시추 장비로의 전환을 촉진하고 있습니다.
실용적인 관점에서 볼 때, 지오스티어링의 부상은 정확한 위치 결정에 대한 경제적 가치의 상승을 반영하고 있습니다. 단 한 번의 위치 오차만으로도 북해 유정의 순현재가치를 200만 유로나 감소시킬 가능성이 있으며, 이것이 AI를 활용한 시추 경로 채택을 촉진하고 있습니다. 지층 평가의 상대적 중요성은 앞으로 낮아질 수도 있겠지만, 압력 및 포화도 모델이 저류층 시뮬레이션 툴에 정보를 제공하며, 이것이 유전 개발 전략을 결정짓기 때문에 여전히 필수적인 요소입니다.
지역별 분석
북미는 2025년, 퍼미안 분지, 바켄, DJ 분지의 셰일 시추 및 멕시코만 심해 시추에 힘입어 시추 중 로깅 시장에서 31.42%의 점유율을 유지했습니다. 이 지역의 운영사들은 엣지 컴퓨팅을 활용한 첨단 지오스티어링을 도입하여 다층 생산층에서 추가 원유를 채굴하는 한편, 단일 커브로 3마일의 횡굴을 시추하고 있습니다. 캐나다 오일샌드의 SAGD(증기 주입법) 사업도 증기의 컨포먼시(conformity)를 관리하기 위해 초심부 저항률 측정에 의존하고 있는 반면, 멕시코에서는 새로운 생산분배계약(PSC) 조건에 기반한 최초의 유전 개발 프로젝트인 트리온(Trion)이 초심해 분야에서 수요를 창출하고 있습니다. 이 지역의 연평균 성장률(CAGR)은 풍부한 1등급 셰일 매장량과 안정적인 서비스 인프라에 힘입어 2031년까지 7.92%에 달할 것으로 전망됩니다.
중동 및 아프리카는 2031년까지 연평균 성장률(CAGR) 10.02%로 가장 빠른 성장세를 보일 것으로 예상됩니다. ‘비전 2030’의 목표에 힘입은 사우디아람코의 2025-2030년 시추 계획이 시추 장비 수요의 지속적인 확대를 견인하고 있으며,ADNOC의 7억 5,000만-9억 5,000만 달러 규모의 시추 장비 함대 갱신 계획 역시 LWD 도입을 촉진하고 있습니다. 서아프리카 해양 지역에서는 나이지리아의 봉가 사우스웨스트와 세네갈의 야카르 테랑가에서 생산 허가 전의 활기가 감지되어, HPHT 대응 센서의 수주를 지원하고 있습니다. UAE, 카타르, 나이지리아의 현지 조달 규제로 인해 서비스 제공업체들은 지역내 제조에 투자할 수밖에 없게 되었으며, 이로 인해 시장 침투가 더욱 심화되고 있습니다.
아시아태평양은 양보다 기술적 야심에서 두드러집니다. 중국의 주요 국영 기업은 탈림 분지와 준갈 분지에서 8,000미터 시추 목표를 추구하고 있으며, 시추공 바닥 온도 240°C를 견딜 수 있는 전자 장비가 필수적입니다. 인도의 OALP 라운드를 통한 광구 배정은 크리슈나-고다바리 심해 블록에서의 탐사를 촉진하고 있는 반면, 호주에서는 브라우즈 분지와 보나파르트 분지에서 LNG 원료 확보를 위한 시추가 확대되고 있습니다. 이 지역의 시추 장비 수요는 전 세계 시추 장비 수요의 36%를 차지하고 있으며, 아시아태평양은 시추 장비 사양 수립에 있으며, 점점 더 큰 영향력을 행사하고 있습니다.
유럽에서는 북해의 타이백 사업과 독일, 네덜란드, 아이슬란드에서 급증하고 있는 지열 시범 사업으로 인해 완만한 성장이 지속되고 있습니다. 이 지역의 운영사들은 EU의 택소노미 규정을 준수하기 위해 초고온 대응 장비와 탄소 회계 기능을 요구하고 있습니다. 라틴아메리카에서는 양극화된 추세가 관찰됩니다. 브라질의 프레솔트 초심해 유전은 여전히 프리미엄 서비스가 집중되는 반면, 아르헨티나의 바카 무에르타 셰일 지대에서는 육상 시추 장비 대수가 거시경제 동향에 따라 변동하고 있습니다. 지역을 불문하고 시추 중 지층 분석(LWD) 시장은 다양한 요인의 혜택을 받고 있지만, 센서가 풍부하게 탑재되고 디지털로 통합된 바텀홀 어셈블리라는 공통된 주제로 수렴하고 있습니다.
기타 혜택:
- 엑셀 형식의 시장 예측(ME) 시트
- 3개월간의 애널리스트 지원
자주 묻는 질문
목차
제1장 서론
제2장 조사 방법
제3장 개요
제4장 시장 구도
제5장 시장 규모와 성장 예측
제6장 경쟁 구도
제7장 시장 기회와 향후 전망
KSA 26.08.26According to Mordor Intelligence, logging while drilling market size in 2026 is estimated at USD 5.02 billion, growing from 2025 value of USD 4.64 billion with 2031 projections showing USD 7.47 billion, growing at 8.29% CAGR over 2026-2031.
This report is Segmented by Service Type (Resistivity LWD, Pressure and Fluid Sampling, and More), Application (Formation Evaluation, Geosteering and Reservoir Navigation, and More), Well Type (Conventional Vertical, HPHT, Horizontal, and Extended-Reach), Location of Deployment (Onshore and Offshore), and Geography (North America, Europe, Asia-Pacific, South America, and Middle East and Africa).
Global Logging While Drilling (LWD) Market Trends and Insights
Rising Shale & Deep-Water Drilling Activity
Deepwater rig utilization averaged 92% in 2024 as operators pursued higher-return fields in Brazil's pre-salt and the Gulf of Mexico, boosting demand for real-time downhole data that wireline tools cannot deliver in unstable boreholes. SLB's USD 800 million contract covering more than 100 Petrobras wells underlines the scale of upcoming ultra-deepwater campaigns that depend on autonomous geosteering to navigate complex reservoirs. The Permian Basin adds further volume: longer laterals and multizone completions require continuous formation evaluation to maintain contact with the pay zone.
Adoption of Real-Time Formation Evaluation
Halliburton's LOGIX automation platform showed up to 30% gains in rate of penetration after integrating downhole resistivity and gamma-ray telemetry with surface algorithms that adjust weight-on-bit and rotary speed. SLB's Neuro system steered a well in Ecuador through 25 automated trajectory corrections without manual oversight, illustrating how AI closes the loop between subsurface data and bit direction. Eliminating separate wireline runs trims 10-15% off total well construction time in complex deviated wells, making real-time formation evaluation a universal requirement in high-cost environments.
Oil-Price Volatility Curbing E&P CAPEX
US independents trimmed their drilling budgets during 2024-2025, despite Brent prices hovering near USD 80 per barrel, preferring debt reduction and dividends over growth spending. Global E&P investment is forecast to hold around USD 60-65 billion in 2025, suppressing early-stage exploration where LWD demand is highest. Although deepwater megaprojects are proceeding, smaller shale operators are focusing on generating free cash flow and making slow additions to their rig fleet.
Other drivers and restraints analyzed in the detailed report include:
- Surge in Horizontal & Directional Wells
- Digital-Oilfield Automation Budgets
- Tightening ESG & Environmental Mandates
For complete list of drivers and restraints, kindly check the Table Of Contents.
Segment Analysis
Resistivity services generated 33.78% of the logging while drilling market size in 2025, confirming their status as the baseline measurement required on nearly every well. Their ability to flag hydrocarbon-bearing zones in real-time ensures continued adoption in both land and offshore programs. The segment benefits from machine-learning algorithms that now convert resistivity curves into lithology predictions while drilling, further embedding the measurement into automated workflows. Pressure and fluid sampling, although a smaller slice today, is projected to lead growth at 10.95% CAGR as operators seek dynamic formation pressure data and fluid typing without halting drilling. SLB's SpectraSphere tool and Baker Hughes' AziTrak family exemplify this trend by enabling downhole PVT sampling that formerly required separate wireline runs. Across mature basins, gamma-ray, density-neutron, and acoustic packages remain staples for porosity and lithology assessment, while borehole imaging is enjoying renewed interest in fractured carbonates, where visualization guides completion design.
The competitive landscape within the services sector is characterized by continuous sensor miniaturization and increased data bandwidth for telemetry. Resistivity tools now transmit multi-depth measurements at 30-bps mud-pulse rates, allowing simultaneous transmission of gamma and pressure data streams. In sampling, downhole spectroscopic analysis enables the identification of moving fluids from surface labs to real-time rig displays, thereby improving decision accuracy. These technology upgrades position both traditional and emerging services to capture incremental spending as digital oilfield budgets rise.
Formation evaluation controlled 42.35% of the logging while drilling market share in 2025 because every spud requires reservoir and fluid characterization. Tools that deliver porosity, resistivity, density, and sonic logs while drilling cut days from well construction, saving USD 400,000-600,000 per deepwater well. Geosteering, however, is expanding at a 9.85% CAGR as horizontal laterals stretch past 10,000 ft and pay zones narrow to less than 10 ft. Autonomous systems like Neuro use downhole resistivity images to pivot the bit within seconds, maximizing production rates from thin targets. Wellbore stability monitoring is also gaining traction in HPHT wells, where real-time caliper and sonic shear measurements provide early warnings of breakout risks. Finally, real-time drilling optimization blends LWD data with surface analytics to maximize penetration rate while safeguarding hole quality, underpinning the push toward self-driven rigs.
In practical terms, geosteering's rise reflects the economic premium on precise placement. A single misalignment can reduce the net present value of a North Sea well by EUR 2 million, incentivizing the adoption of AI-supported trajectories. The relative weight of formation evaluation may erode over time, but it remains indispensable, as pressure and saturation models feed reservoir simulation tools that dictate field development strategies.
Complete Report Scope:
- By Service Type
- Resistivity LWD
- Gamma-Ray and Spectral
- Density-Neutron
- Acoustic and Sonic
- Pressure and Fluid Sampling
- Borehole Imaging
- By Application
- Formation Evaluation
- Geosteering and Reservoir Navigation
- Wellbore Stability Monitoring
- Real-time Drilling Optimization
- By Well Type
- Conventional Vertical
- HPHT
- Horizontal
- Extended-Reach
- By Location of Deployment
- Onshore
- Offshore
- By Geography
- North America
- United States
- Canada
- Mexico
- Europe
- United Kingdom
- Norway
- Russia
- Ukraine
- Rest of Europe
- Asia-Pacific
- China
- India
- ASEAN Countries
- Australia
- Rest of Asia-Pacific
- South America
- Brazil
- Argentina
- Colombia
- Rest of South America
- Middle East and Africa
- Saudi Arabia
- United Arab Emirates
- Qatar
- Nigeria
- Algeria
- Rest of Middle East and Africa
- North America
Geography Analysis
North America retained 31.42% of the logging while drilling market share in 2025, driven by shale drilling in the Permian Basin, Bakken, and DJ Basin, as well as deepwater activdeepwatere the Gulf of Mexico. Operators here deploy advanced geosteering with edge computing to extract incremental barrels from stacked pays and to drill 3-mile laterals on a single curve. Canadian oil-sands SAGD operations also rely on ultra-deep resistivity to manage steam conformance, while Mexico's first field development under new PSC terms, Trion, introduces ultra-deepwater demand. The regional CAGR is forecasted at 7.92% to 2031, supported by ample Tier-1 shale inventory and stable service infrastructure.
The Middle East and Africa are expected to exhibit the fastest expansion at a 10.02% CAGR through 2031. Saudi Aramco's 2025-2030 drilling plan, backed by Vision 2030 targets, drives sustained rig demand, with ADNOC's USD 750-950 million rig-fleet upgrade similarly stimulating LWD uptake. Offshore West Africa sees pre-sanction momentum in Nigeria's Bonga Southwest and Senegal's Yakaar-Teranga, encouraging orders for HPHT-capable sensors. Local content regulations in the UAE, Qatar, and Nigeria compel service providers to invest in regional manufacturing, deepening market penetration.
Asia-Pacific region stands out for its technical ambition rather than volume. China's state majors are pursuing 8,000-m targets in Tarim and Junggar, mandating electronics that can survive bottom-hole temperatures of 240 °C. India's OALP-round acreage spurs exploration in deepwater Krishna-Godavari blocks, while Australia expands LNG feedstock drilling in Browse and Bonaparte basins. Regional rig demand accounts for 36% of global fleet requirements, giving the Asia-Pacific region a growing influence on tool-specification roadmaps.
Europe sustains moderate growth from North Sea tie-back campaigns and burgeoning geothermal pilots in Germany, the Netherlands, and Iceland. Operators there seek ultra-high-temperature tools and carbon-accounting features to comply with EU taxonomy rules. Latin America exhibits a two-speed dynamics: Brazil's pre-salt ultra-deepwater complex remains a magnet for premium services, in contrast to Argentina's Vaca Muerta shale, where land rig counts fluctuate in line with macroeconomic trends. Across geographies, the logging while drilling market benefits from varied drivers, but converges on a common theme: sensor-rich, digitally integrated bottom-hole assemblies.
- Halliburton
- Schlumberger
- Baker Hughes
- Weatherford
- National Oilwell Varco (NOV)
- Nabors Industries
- Scientific Drilling
- China Oilfield Services (COSL)
- Vallourec
- Gyrodata
- APS Technology
- Cougar Drilling Solutions
- Leam Drilling
- GEOLOG International
- Weatherford HeatWave Extreme
- Schlumberger Pulsar
- BH EarthStar
- Kongsberg EM2040 LWD
- Bentec Logging Services
- Sinopec Oilfield Service Corp.
Additional Benefits:
- The market estimate (ME) sheet in Excel format
- 3 months of analyst support
TABLE OF CONTENTS
1 Introduction
- 1.1 Study Assumptions & Market Definition
- 1.2 Scope of the Study
2 Research Methodology
3 Executive Summary
4 Market Landscape
- 4.1 Market Overview
- 4.2 Market Drivers
- 4.2.1 Rising shale & deep-water drilling activity
- 4.2.2 Adoption of real-time formation evaluation
- 4.2.3 Surge in horizontal & directional wells
- 4.2.4 Digital-oilfield automation budgets
- 4.2.5 Geothermal & natural-hydrogen well demand
- 4.2.6 Ultra-deep resistivity tools for SAGD heavy-oil
- 4.3 Market Restraints
- 4.3.1 Oil-price volatility curbing E&P CAPEX
- 4.3.2 Tightening ESG & environmental mandates
- 4.3.3 RF-telemetry bandwidth congestion
- 4.3.4 Rare-earth sensor supply bottlenecks
- 4.4 Supply-Chain Analysis
- 4.5 Regulatory Landscape
- 4.6 Technological Outlook
- 4.7 Porter's Five Forces
- 4.7.1 Bargaining Power of Suppliers
- 4.7.2 Bargaining Power of Buyers
- 4.7.3 Threat of New Entrants
- 4.7.4 Threat of Substitutes
- 4.7.5 Competitive Rivalry
5 Market Size & Growth Forecasts
- 5.1 By Service Type
- 5.1.1 Resistivity LWD
- 5.1.2 Gamma-Ray and Spectral
- 5.1.3 Density-Neutron
- 5.1.4 Acoustic and Sonic
- 5.1.5 Pressure and Fluid Sampling
- 5.1.6 Borehole Imaging
- 5.2 By Application
- 5.2.1 Formation Evaluation
- 5.2.2 Geosteering and Reservoir Navigation
- 5.2.3 Wellbore Stability Monitoring
- 5.2.4 Real-time Drilling Optimization
- 5.3 By Well Type
- 5.3.1 Conventional Vertical
- 5.3.2 HPHT
- 5.3.3 Horizontal
- 5.3.4 Extended-Reach
- 5.4 By Location of Deployment
- 5.4.1 Onshore
- 5.4.2 Offshore
- 5.5 By Geography
- 5.5.1 North America
- 5.5.1.1 United States
- 5.5.1.2 Canada
- 5.5.1.3 Mexico
- 5.5.2 Europe
- 5.5.2.1 United Kingdom
- 5.5.2.2 Norway
- 5.5.2.3 Russia
- 5.5.2.4 Ukraine
- 5.5.2.5 Rest of Europe
- 5.5.3 Asia-Pacific
- 5.5.3.1 China
- 5.5.3.2 India
- 5.5.3.3 ASEAN Countries
- 5.5.3.4 Australia
- 5.5.3.5 Rest of Asia-Pacific
- 5.5.4 South America
- 5.5.4.1 Brazil
- 5.5.4.2 Argentina
- 5.5.4.3 Colombia
- 5.5.4.4 Rest of South America
- 5.5.5 Middle East and Africa
- 5.5.5.1 Saudi Arabia
- 5.5.5.2 United Arab Emirates
- 5.5.5.3 Qatar
- 5.5.5.4 Nigeria
- 5.5.5.5 Algeria
- 5.5.5.6 Rest of Middle East and Africa
- 5.5.1 North America
6 Competitive Landscape
- 6.1 Market Concentration
- 6.2 Strategic Moves (M&A, Partnerships, PPAs)
- 6.3 Market Share Analysis (Market Rank/Share for key companies)
- 6.4 Company Profiles (includes Global level Overview, Market level overview, Core Segments, Financials as available, Strategic Information, Products & Services, and Recent Developments)
- 6.4.1 Halliburton
- 6.4.2 Schlumberger
- 6.4.3 Baker Hughes
- 6.4.4 Weatherford
- 6.4.5 National Oilwell Varco (NOV)
- 6.4.6 Nabors Industries
- 6.4.7 Scientific Drilling
- 6.4.8 China Oilfield Services (COSL)
- 6.4.9 Vallourec
- 6.4.10 Gyrodata
- 6.4.11 APS Technology
- 6.4.12 Cougar Drilling Solutions
- 6.4.13 Leam Drilling
- 6.4.14 GEOLOG International
- 6.4.15 Weatherford HeatWave Extreme
- 6.4.16 Schlumberger Pulsar
- 6.4.17 BH EarthStar
- 6.4.18 Kongsberg EM2040 LWD
- 6.4.19 Bentec Logging Services
- 6.4.20 Sinopec Oilfield Service Corp.
7 Market Opportunities & Future Outlook
- 7.1 White-space & Unmet-need Assessment


