|
시장보고서
상품코드
2113959
사이버 기만 : 시장 점유율 분석, 업계 동향 및 통계, 성장 예측(2026-2031년)Cyber Deception - Market Share Analysis, Industry Trends & Statistics, Growth Forecasts (2026 - 2031) |
||||||
 Mordor Intelligence
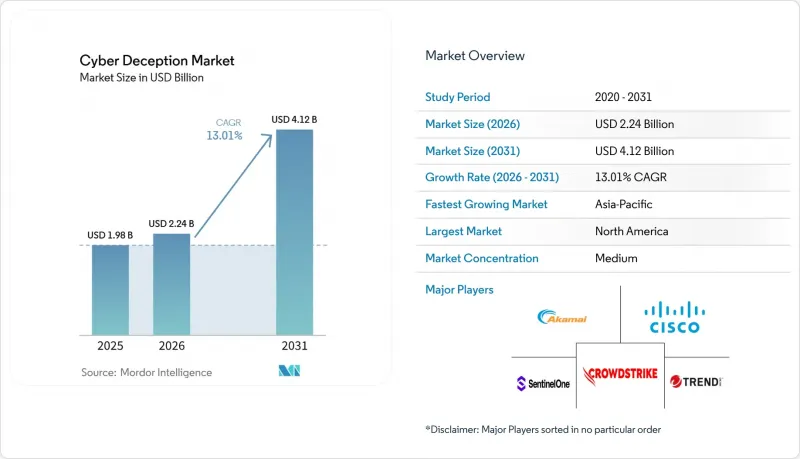
Mordor Intelligence에 의하면, 사이버 기만 시장 규모는 2025년에 19억 8,000만 달러로 평가되었습니다. 2026년 22억 4,000만 달러에서 2031년까지 41억 2,000만 달러에 이를 것으로 예상되며, 예측 기간(2026-2031년) CAGR은 13.01%를 나타낼 전망입니다.
본 보고서는 계층별(용도 보안, 네트워크 보안, 데이터 보안 등), 서비스 유형별(전문 서비스, 관리형 서비스), 배포 모드별(On-Premise, 클라우드 기반), 최종 사용자 산업별(은행, 금융서비스 및 보험(BFSI), IT 및 통신, 헬스케어 및 생명과학,소매 및 전자상거래 등) 및 지역별로 분류되어 있습니다. 시장 예측은 금액(달러) 기준으로 제시되어 있습니다.
세계의 사이버 기만 시장 동향 및 인사이트
사이버 공격의 고도화 및 증가
고도 지속적 위협(APT)은 현재 ‘리빙 오프 더 랜드(Living Off the Land)’ 전술, 공급망 침투, 그리고 시그니처 엔진을 우회하는 AI 생성 피싱 미끼를 활용하고 있습니다. 디셉션은 모든 명령과 페이로드를 기록하는 고정밀 미끼로 공격자를 유인함으로써 감지 격차를 메웁니다. 2024년에 시작된 영국 국립 사이버 보안 센터(NCSC)의 5,000노드 규모 디셉션 프로그램은 국가 기관이 공격자의 수법을 수집하고 방어 전략을 정교화하고 있음을 보여주는 실제 사례입니다. 기업들도 유사한 접근 방식을 채택하고 있습니다. 예를 들어, 미국의 한 의료 네트워크에서는 전자 기록 클러스터 전체에 허니 토큰을 배치하여, 첫 번째 미끼가 작동된 후 랜섬웨어의 잠복 시간을 며칠에서 2시간 미만으로 단축했습니다.
급속한 클라우드 전환과 API 우선 아키텍처
서버리스 함수, 마이크로서비스, 멀티클라우드 데이터 경로로 인해 공격 표면은 경계 방화벽이 미치지 못하는 영역까지 확대되고 있습니다. 컨테이너화된 디셉션 어플라이언스는 현재 Terraform 스크립트를 통해 배포되며, Kubernetes 클러스터와 함께 자동 스케일링을 수행하므로 보안 팀은 새로운 워크로드를 몇 분 이내에 은폐할 수 있게 되었습니다. 『Scientific Reports』지에 게재된 연구에 따르면, 싱글 테넌트형 클라우드 허니팟은 WAF 규칙으로는 감지되지 않았던 자격 증명 주입 공격의 67%를 포착하면서도, API 호출 지연을 1% 미만으로 억제하는 것으로 입증되었습니다. ‘Infrastructure-as-Code’를 도입한 조직들은 이러한 실증 결과에 큰 기대를 걸고 있습니다. 미끼 시스템이 DevOps 파이프라인과 동일한 속도로 작동하기 때문입니다.
기존 네트워크의 높은 통합 및 조정 비용
평평한 레거시 네트워크를 운영하는 조직에서는 현실적인 미끼 배치를 위한 세분화 지점이 부족합니다. 가상 LAN, 스팬 포트, ID 서비스의 사후 도입은 에너지 및 제조업 등 업계에서 프로젝트 비용을 상승시키고 일정을 12개월 이상 연장하게 됩니다. 한 유럽의 석유화학 기업은 첫 번째 트랩을 온라인으로 전환하기 전에 필요한 네트워크 업그레이드로 인해 당초 디셉션 예산이 2배로 늘어났습니다고 보고했으며, 이는 도구만으로는 아키텍처의 노후화 문제를 해결할 수 없음을 증명합니다.
부문 분석
2025년, 네트워크 디셉션 제품은 사이버 기만 시장에서 34.88%의 점유율을 차지했으며, 이는 이 제품들이 전통적으로 경계선의 트립와이어 역할을 해왔음을 반영합니다. 그러나 원격으로 연결되는 모든 노트북과 IIoT 게이트웨이가 핵심 요소가 됨에 따라 엔드포인트 디셉션은 연평균 성장률(CAGR) 17.63%로 확대되고 있습니다. 이러한 성장은 사이버 기만 시장의 구조를 재편하고 있습니다. 이는 장치 중심의 미끼가 암호화된 터널 내부까지 네트워크 탭으로는 모니터링할 수 없는 가시성 격차를 메워주기 때문입니다.
실제로 각 벤더는 위협 행위자가 엔드포인트에 침입했을 때 가짜 레지스트리 하이브를 생성하거나, 가짜 브라우저 쿠키를 생성하거나, 미끼용 USB 드라이브를 실행하는 경량 에이전트를 제공합니다. 예를 들어, 동남아시아의 한 통신 사업자는 엔지니어용 노트북에 가짜 5G 관리 스크립트를 배치했습니다. 공격자는 몇 시간 만에 이 미끼에 반응했고, 보안 팀은 코어 스위치가 침해되기 전에 침해된 계정을 격리할 수 있었습니다. 용도 보안 분야의 미끼 전략도 힘을 얻고 있습니다. GraphQL 엔드포인트를 모방하는 API 허니팟의 등장으로 SaaS 제공업체는 인증 정보의 무단 사용을 실시간으로 감지할 수 있게 되었습니다. 한편, 데이터 중심 미끼 전략에서는 구조화된 쿼리 언어(SQL) 테이블이나 오브젝트 스토리지 버킷 내에 허니 토큰이 삽입됩니다. 한 소매업체는 이 전술을 활용하여 고객의 개인 식별 정보(PII)를 탈취하던 악성 창고용 API를 몇 분 만에 발견했습니다. 전반적으로 이러한 다층적인 접근 방식 덕분에 사이버 기만 시장은 패킷, 프로세스, 데이터 아티팩트에 걸쳐 미끼를 조정하는 통합 콘솔로 전환되고 있습니다.
관리형 디셉션 서비스는 2025년에 사이버 기만 시장 점유율의 38.74%를 차지하며 연평균 성장률(CAGR) 17.72%를 기록했습니다. 이는 많은 기업이 부족하기 쉬운 디셉션 엔지니어를 채용하는 것보다 디셉션 업무를 외부에 위탁하는 것을 선호한다는 것을 보여줍니다. 서비스 제공업체는 수천 개의 트랩을 관리하고, 테넌트 간에 새로운 지표를 공유하며, 사고 발생 후 포렌식 조사를 제공하는 중앙 집중식 ‘미끼 운영 센터’를 운영하고 있습니다. 이 모델은 인력을 대폭 늘리지 않고도 ‘감지까지의 평균 시간(MTD)’을 단축하라는 이사회 요청에 부응하는 것입니다.
디셉션을 성공적으로 수행하려면 네트워크의 기준선 설정, 최우선 자산 매핑, 그리고 조직 문화에의 침투가 필요하기 때문에 전문 서비스는 여전히 중요합니다. 컨설턴트들은 현재 배포 단계에 실전 훈련, 피싱 시뮬레이션, 퍼플 팀 랩을 통합하여 사내 대응 담당자가 미끼의 텔레메트리 데이터를 바탕으로 적절하게 대응하는 방법을 배울 수 있도록 하고 있습니다. 예를 들어, 포춘 100대 기업에 선정된 한 제조업체는 전문 통합 업체를 기용하여 디셉션 경보를 자사의 SAP GRC 콘솔에 직접 통합했습니다. 그 결과, 불과 한 분기 만에 감사 담당자에게 그 가치를 입증할 수 있었습니다. 이러한 복합적인 접근 방식은 사이버 기만 업계가 지속적인 관리 수수료와 높은 수익률을 자랑하는 컨설팅 사업 모두를 통해 수익을 창출하고 있는 이유를 여실히 보여줍니다.
지역별 분석
2025년, 북미는 사이버 기만 시장의 43.10%를 차지했습니다. 그 배경에는 성숙한 예산, 실리콘밸리와 텔아비브의 연구개발(R&D) 클러스터, 그리고 제로 트러스트 전환에 관한 대통령령과 같은 규제적 뒷받침이 있습니다. 미국의 기술 통합 기업들은 틈새 시장 벤더들을 계속해서 인수하고 있습니다. SentinelOne이 Attivo Networks를 6억 1,650만 달러에 인수한 것은 디셉션과 자율형 엔드포인트 보호를 단일 에이전트로 통합하기 위함이었습니다. 캐나다의 통신 사업자들도 마찬가지로, CRTC공급망 관련 지침에 대응하기 위해 5G 코어 내에 디셉션을 도입하고 있습니다.
아시아태평양은 연평균 성장률(CAGR) 22.05%로 가장 빠르게 성장하고 있습니다. 싱가포르, 호주, 일본 등의 국가들은 위협 감지 대책의 도입을 명시적으로 요구하는 부문별 사이버 보안 프레임워크를 수립하고 있으며, 이를 통해 디셉션의 시범 도입을 위한 예산이 마련되고 있습니다. 예를 들어, 호주의 에너지 그리드에서는 ‘중요 인프라 보안법’ 개정에 부합하기 위해 컨테이너화된 ICS 디코이를 도입하여, 몇 주 만에 인증 정보를 수집하는 봇을 감지했습니다. 중국의 클라우드 하이퍼스케일러 기업들은 국내 SaaS 개발자가 CI/CD 파이프라인에 ‘허니팟 애즈 코드(Honeypot-as-Code)’를 추가할 수 있도록 디셉션 API를 번들로 제공합니다. 한편, 인도의 핀테크 스타트업은 가짜 UPI(Unified Payments Interface) 엔드포인트를 이용해 카드 사기 그룹을 유인하고, 그 정보를 현지 CERT 팀에 제공합니다.
유럽에서는 10%대 중반의 꾸준한 성장이 이어지고 있습니다. EU의 ‘사이버 복원력 법’은 지속적인 모니터링을 장려하고 있으며, 독일 BSI(연방정보보안청)는 디셉션을 권장되는 대책으로 꼽고 있습니다. 엄격한 데이터 거주 요건으로 인해 현재 여러 벤더가 프랑크푸르트, 파리, 마드리드에서 주권 클라우드 노드를 제공합니다. 중동 및 아프리카에서는 리야드와 두바이의 스마트 시티 구축에 따라, 지역 냉방 플랜트 내에 OT용 미끼 시스템을 도입하기 위한 자금이 배정되고 있습니다. 남미의 성장세는 완만하지만 상승 추세를 보이고 있으며, 브라질의 즉시 결제 시스템 ‘PIX’의 보급에 따라 은행들은 거래 게이트웨이를 모방한 미끼 API를 설치하여 소규모 가맹점을 노리는 인증 정보 스프레이 공격을 차단하고 있습니다.
기타 혜택 :
- 엑셀 형식 시장 예측(ME) 시트
- 3개월간의 애널리스트 지원
자주 묻는 질문
목차
제1장 서론
제2장 조사 방법
제3장 주요 요약
제4장 시장 구도
제5장 시장 규모 및 성장 예측
제6장 경쟁 구도
제7장 시장 기회 및 향후 동향
KTH 26.08.26According to Mordor Intelligence, the cyber deception market size was valued at USD 1.98 billion in 2025 and estimated to grow from USD 2.24 billion in 2026 to reach USD 4.12 billion by 2031, at a CAGR of 13.01% during the forecast period (2026-2031).
This report is Segmented by Layer (Application Security, Network Security, Data Security, and More), Service Type (Professional Services, and Managed Services), Deployment Mode (On-Premises, and Cloud-Based), End-User Industry (BFSI, IT and Telecommunications, Healthcare and Life Sciences, Retail and E-Commerce, and More), and Geography. The Market Forecasts are Provided in Terms of Value (USD).
Global Cyber Deception Market Trends and Insights
Escalating Sophistication and Volume of Cyber-Attacks
Advanced persistent threats now leverage living-off-the-land tactics, supply-chain infiltration, and AI-generated phishing lures that bypass signature engines. Deception fills detection gaps by luring adversaries into high-fidelity decoys that log every command and payload. The U.K. National Cyber Security Centre's 5,000-node deception program, launched in 2024, illustrates how national agencies harvest attacker tradecraft to refine defense playbooks. Enterprises mirror that approach: a U.S. healthcare network, for example, seeded honey tokens across its electronic records cluster and cut ransomware dwell time from days to under two hours after the first decoy trigger.
Rapid Cloud Migration and API-First Architectures
Serverless functions, microservices, and multicloud data paths multiply attack surfaces beyond the reach of perimeter firewalls. Containerized deception appliances now deploy via Terraform scripts and autoscale with Kubernetes clusters, letting security teams cloak every new workload in minutes. Research published in Scientific Reports demonstrated that a single-tenant cloud honeypot caught 67% of credential-stuffing attempts missed by WAF rules while adding under 1% latency to API calls. Organizations adopting Infrastructure-as-Code rally around such evidence because decoys move at the same velocity as DevOps pipelines.
High Integration and Tuning Costs for Brown-Field Networks
Organizations running flat, legacy networks lack segmentation points for realistic decoy placement. Retrofitting virtual LANs, span ports, and identity services drives up project costs and extends timelines beyond 12 months in industries such as energy or manufacturing. One European petro-chemical firm reported that prerequisite network upgrades doubled its initial deception budget before the first trap was online, proving that tooling alone cannot solve architectural rot.
Other drivers and restraints analyzed in the detailed report include:
- Mandates for Zero-Trust and Breach-Assumed Postures
- Shortage of Skilled Cyber Workforce Boosting Automation Demand
- Limited Cybersecurity Budgets Among SMBs
For complete list of drivers and restraints, kindly check the Table Of Contents.
Segment Analysis
Network deception products accounted for a 34.88% share of the cyber deception market in 2025, reflecting their historical role as perimeter tripwires. Endpoint deception, however, is scaling at a 17.63% CAGR as every remote laptop and IIoT gateway becomes a pivot point. That growth reshapes the cyber deception market because device-centric lures close visibility gaps that network taps cannot monitor behind encrypted tunnels.
In practice, vendors push lightweight agents that spin up bogus registry hives, fake browser cookies, and decoy USB drives whenever a threat actor lands on an endpoint. For instance, a Southeast-Asian telecom placed false 5G management scripts on engineering laptops; attackers triggered the lure within hours, enabling security teams to isolate compromised accounts before any core switch was touched. Application security deception also gathers momentum-the rise of API honeypots that mimic GraphQL endpoints lets SaaS providers detect credential abuse in real time. Data-centric deception, meanwhile, embeds honey-tokens inside structured query language tables and object storage buckets; one retailer used that tactic to discover rogue warehouse APIs siphoning customer PII within minutes. Altogether, the layered approach moves the cyber deception market toward unified consoles that orchestrate decoys across packets, processes, and data artifacts.
Managed deception services held 38.74% of the cyber deception market share in 2025 and carry an 17.72% CAGR, evidence that many enterprises would rather outsource trickery than recruit scarce deception engineers. Providers run centralized "Decoy Operations Centers" that manage thousands of traps, share new indicators across tenants, and supply post-incident forensics. That model aligns with board mandates to reduce mean-time-to-detect without ballooning headcount.
Professional services still matter because successful deception demands network baselining, crown-jewel mapping, and cultural buy-in. Consultants now embed field exercises, phishing simulations, and purple-team labs into deployment phases so that internal responders learn how to act on decoy telemetry. For example, a Fortune 100 manufacturer hired a boutique integrator to knit deception alerts directly into its SAP GRC console, proving value to auditors within a single quarter. This blended approach underlines why the cyber deception industry monetizes both recurring managed fees and high-margin consulting.
Complete Report Scope:
- By Layer
- Application Security
- Network Security
- Data Security
- Endpoint Security
- By Service Type
- Professional Services
- Managed Services
- By Deployment Mode
- On-premises
- Cloud-based
- By End-user Industry
- BFSI
- IT and Telecommunications
- Healthcare and Life Sciences
- Retail and e-Commerce
- Energy and Utilities
- Government and Defense
- Other Industries
- By Geography
- North America
- United States
- Canada
- Mexico
- South America
- Brazil
- Argentina
- Rest of South America
- Europe
- Germany
- United Kingdom
- France
- Russia
- Rest of Europe
- Asia-Pacific
- China
- Japan
- India
- South Korea
- Australia
- Rest of Asia-Pacific
- Middle East and Africa
- Middle East
- Saudi Arabia
- United Arab Emirates
- Rest of Middle East
- Africa
- South Africa
- Egypt
- Rest of Africa
- Middle East
- North America
Geography Analysis
North America controlled 43.10% of the cyber deception market in 2025, anchored by mature budgets, R&D clusters in Silicon Valley and Tel Aviv, and regulatory catalysts such as executive orders on zero-trust migration. U.S. technology consolidators continue to absorb niche vendors; SentinelOne's USD 616.5 million purchase of Attivo Networks merged deception with autonomous endpoint protection in a single agent. Canadian telcos likewise deploy deception inside 5G cores to meet CRTC supply-chain directives.
Asia-Pacific is the fastest riser at 22.05% CAGR. Nations such as Singapore, Australia, and Japan issue sectoral cyber frameworks that explicitly call for threat-hunting controls, spawning budgets for deception pilots. For example, an Australian energy grid deployed containerized ICS decoys to comply with the Security of Critical Infrastructure Act amendments, catching credential-harvesting bots within weeks. Chinese cloud hyperscalers bundle deception APIs so that domestic SaaS developers can add "honeypot as code" to CI/CD pipelines. Meanwhile, Indian fintech start-ups lure carding gangs with fake Unified Payments Interface endpoints, feeding intelligence to local CERT teams.
Europe maintains steady mid-teens growth. The EU Cyber Resilience Act pushes continuous monitoring, and Germany's BSI agency cites deception as a recommended control. Strict data-residency rules mean several vendors now offer sovereign-cloud nodes in Frankfurt, Paris, and Madrid. In the Middle East and Africa, smart-city build-outs in Riyadh and Dubai allocate funding for OT decoys inside district cooling plants. South American growth is modest yet rising; Brazil's PIX instant-payment rails drive banks to plant decoy APIs that emulate transaction gateways, intercepting credential sprays directed at small merchants.
- SentinelOne Inc.
- Illusive Networks Ltd.
- Acalvio Technologies Inc.
- Akamai Technologies Inc.
- Rapid7 Inc.
- CrowdStrike Holdings Inc.
- TrapX Security Inc.
- Fidelis Cybersecurity LLC
- Trend Micro Incorporated
- Cisco Systems Inc.
- Fortinet Inc.
- Countercraft, S.L.,
- Morphisec Ltd.
- Zscaler Inc.
- LogRhythm Inc.
- Smokescreen Technologies Pvt Ltd.
- Cymmetria Ltd.
- Illumio Inc.
- ExtraHop Networks Inc.
- Darktrace plc
- Thales Group (Data Threat Deception)
- Palo Alto Networks Inc.
- Guardicore Ltd. (Akamai)
- Kaspersky Lab AO
- Allure Security Technology Inc.
- Minerva Labs Ltd.
Additional Benefits:
- The market estimate (ME) sheet in Excel format
- 3 months of analyst support
TABLE OF CONTENTS
1 INTRODUCTION
- 1.1 Study Assumptions and Market Definition
- 1.2 Scope of the Study
2 RESEARCH METHODOLOGY
3 EXECUTIVE SUMMARY
4 MARKET LANDSCAPE
- 4.1 Market Overview
- 4.2 Market Drivers
- 4.2.1 Escalating sophistication and volume of cyber-attacks
- 4.2.2 Rapid cloud migration and API-first architectures
- 4.2.3 Mandates for zero-trust and breach-assumed postures
- 4.2.4 Shortage of skilled cyber workforce boosting automation demand
- 4.2.5 Convergence with Identity Threat Detection and Response (ITDR)
- 4.2.6 Shift of deception tooling into XDR/SSE platforms
- 4.3 Market Restraints
- 4.3.1 High integration and tuning costs for brown-field networks
- 4.3.2 Limited cybersecurity budgets among SMBs
- 4.3.3 Proliferation of open-source decoy frameworks lowering perceived value
- 4.3.4 Adversarial-AI capable of fingerprinting decoy
- 4.4 Industry Value Chain Analysis
- 4.5 Regulatory Landscape
- 4.6 Technological Outlook
- 4.7 Porter's Five Forces Analysis
- 4.7.1 Bargaining Power of Suppliers
- 4.7.2 Bargaining Power of Consumers
- 4.7.3 Threat of New Entrants
- 4.7.4 Threat of Substitutes
- 4.7.5 Intensity of Competitive Rivalry
5 MARKET SIZE AND GROWTH FORECASTS (VALUE)
- 5.1 By Layer
- 5.1.1 Application Security
- 5.1.2 Network Security
- 5.1.3 Data Security
- 5.1.4 Endpoint Security
- 5.2 By Service Type
- 5.2.1 Professional Services
- 5.2.2 Managed Services
- 5.3 By Deployment Mode
- 5.3.1 On-premises
- 5.3.2 Cloud-based
- 5.4 By End-user Industry
- 5.4.1 BFSI
- 5.4.2 IT and Telecommunications
- 5.4.3 Healthcare and Life Sciences
- 5.4.4 Retail and e-Commerce
- 5.4.5 Energy and Utilities
- 5.4.6 Government and Defense
- 5.4.7 Other Industries
- 5.5 By Geography
- 5.5.1 North America
- 5.5.1.1 United States
- 5.5.1.2 Canada
- 5.5.1.3 Mexico
- 5.5.2 South America
- 5.5.2.1 Brazil
- 5.5.2.2 Argentina
- 5.5.2.3 Rest of South America
- 5.5.3 Europe
- 5.5.3.1 Germany
- 5.5.3.2 United Kingdom
- 5.5.3.3 France
- 5.5.3.4 Russia
- 5.5.3.5 Rest of Europe
- 5.5.4 Asia-Pacific
- 5.5.4.1 China
- 5.5.4.2 Japan
- 5.5.4.3 India
- 5.5.4.4 South Korea
- 5.5.4.5 Australia
- 5.5.4.6 Rest of Asia-Pacific
- 5.5.5 Middle East and Africa
- 5.5.5.1 Middle East
- 5.5.5.1.1 Saudi Arabia
- 5.5.5.1.2 United Arab Emirates
- 5.5.5.1.3 Rest of Middle East
- 5.5.5.2 Africa
- 5.5.5.2.1 South Africa
- 5.5.5.2.2 Egypt
- 5.5.5.2.3 Rest of Africa
- 5.5.5.1 Middle East
- 5.5.1 North America
6 COMPETITIVE LANDSCAPE
- 6.1 Market Concentration
- 6.2 Strategic Moves
- 6.3 Market Share Analysis
- 6.4 Company Profiles (includes Global level Overview, Market level overview, Core Segments, Financials as available, Strategic Information, Market Rank/Share for key companies, Products and Services, and Recent Developments)
- 6.4.1 SentinelOne Inc.
- 6.4.2 Illusive Networks Ltd.
- 6.4.3 Acalvio Technologies Inc.
- 6.4.4 Akamai Technologies Inc.
- 6.4.5 Rapid7 Inc.
- 6.4.6 CrowdStrike Holdings Inc.
- 6.4.7 TrapX Security Inc.
- 6.4.8 Fidelis Cybersecurity LLC
- 6.4.9 Trend Micro Incorporated
- 6.4.10 Cisco Systems Inc.
- 6.4.11 Fortinet Inc.
- 6.4.12 Countercraft, S.L.,
- 6.4.13 Morphisec Ltd.
- 6.4.14 Zscaler Inc.
- 6.4.15 LogRhythm Inc.
- 6.4.16 Smokescreen Technologies Pvt Ltd.
- 6.4.17 Cymmetria Ltd.
- 6.4.18 Illumio Inc.
- 6.4.19 ExtraHop Networks Inc.
- 6.4.20 Darktrace plc
- 6.4.21 Thales Group (Data Threat Deception)
- 6.4.22 Palo Alto Networks Inc.
- 6.4.23 Guardicore Ltd. (Akamai)
- 6.4.24 Kaspersky Lab AO
- 6.4.25 Allure Security Technology Inc.
- 6.4.26 Minerva Labs Ltd.
7 MARKET OPPORTUNITIES AND FUTURE TRENDS
- 7.1 White-space and Unmet-Need Assessment