

|
시장보고서
상품코드
2114085
스마트 그리드 데이터 분석 : 시장 점유율 분석, 업계 동향 및 통계, 성장 예측(2026-2031년)Smart Grid Data Analytics - Market Share Analysis, Industry Trends & Statistics, Growth Forecasts (2026 - 2031) |
||||||
 Mordor Intelligence
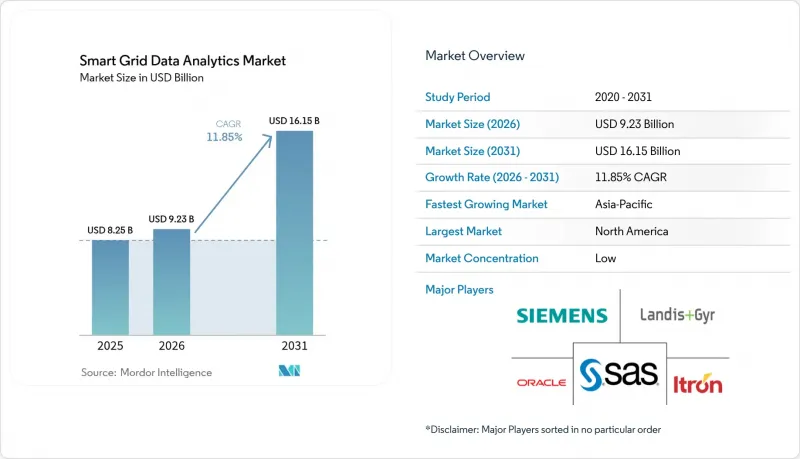
Mordor Intelligence에 의하면, 스마트 그리드 데이터 분석 시장 규모는 2025년에 82억 5,000만 달러, 2026년 92억 3,000만 달러에서 2031년까지 161억 5,000만 달러에 이를 것으로 예측되며, 예측 기간(2026년-2031년) CAGR은 11.85%를 기록할 전망입니다.
본 보고서는 도입 형태(클라우드 기반 및 On-Premise형), 솔루션(송배전 네트워크, 계량 분석 등), 용도(첨단 계량 인프라(AMI) 분석, 수요 반응 분석 등), 최종 사용자 업종(유틸리티·지자체, 민간 전력회사 등), 지역별로 분류되어 있습니다. 시장 전망은 금액(달러) 기준으로 제시되어 있습니다.
세계 스마트 그리드 데이터 분석 시장 동향 및 인사이트
유틸리티의 AMI 도입이 임계점에 도달
종합적인 AMI 도입으로 인해 현재 매일 수백만 건의 타임스탬프가 포함된 검침 데이터가 스트리밍되고 있으며, 전력 사업자는 저전압 네트워크에 대해 전례 없는 가시성을 확보하고 있습니다. 독일에서 원격 전력 제한 명령의 성공률이 98.2%에 달한 것은 차세대 계량기가 거의 실시간으로 송전망 개입을 지원하고 있음을 입증했습니다. 이에 따라 각 전력사는 피더 1개당 시간당 15만 개의 데이터 포인트를 수집하는 분석 엔진을 확장하여 과부하 예측, 장비 고장 사전 방지 및 요금 체계 최적화를 도모하고 있습니다. 20곳의 변전소와 184개의 피더를 대상으로 한 시범 프로젝트에서는 이벤트 기반 분석을 통해 예정에 없던 유지보수를 28% 줄이고, 400만 달러 규모의 설비 투자를 연기할 수 있었음이 입증되었습니다.
클라우드 네이티브 그리드 엣지 분석으로의 전환
스마트 미터를 5G 백홀에 연결함으로써 지연을 한 자릿수 밀리초 단위로 단축하고, 에지 디바이스가 노이즈를 제거하여 가치 높은 이벤트만 클라우드로 전송할 수 있게 되었습니다. 전력 회사는 고가의 데이터센터 건설을 피하고, 대신 토폴로지 최적화 및 전압·무효 전력 제어를 위한 AI 모델을 실행하는 탄력적인 처리 능력을 구독 형식으로 이용하고 있습니다. 지멘스는 자사의 그리드 용도를 보안이 강화된 클라우드 계층에 통합함으로써 이미 17억 유로(18억 1,000만 달러)가 넘는 소프트웨어 중심 매출을 기록하고 있습니다.
레거시 SCADA/MDMS의 상호 운용성 과제
전력 회사는 대개 수십 개 벤더가 제공하는 장치를 운영하고 있으며, 각 벤더는 독자적인 프로토콜을 사용합니다. 디지털 변전소에서 실시한 벤치마크 테스트에서는 핸드셰이크 문제가 드러났고, 운영자는 미들웨어 게이트웨이를 구매할 수밖에 없어 통합 예산이 17% 증가했습니다. 엄격한 사이버-물리 시스템 검증의 필요성으로 인해, 전력 회사가 에지에서 클라우드로의 데이터 경로에 대해 결정론적 성능을 테스트해야 하므로 프로젝트 기간이 연장되고 있습니다.
부문 분석
2025년에는 클라우드 배포가 스마트 그리드 데이터 분석 시장의 60.75%를 차지할 것으로 예상되며, 2031년까지 연평균 성장률(CAGR) 12.74%로 성장할 것으로 전망됩니다. 전력 회사는 자본 투자 없이도 고급 AI 워크로드를 구축할 수 있는 능력을 중시하는 반면, 하이퍼스케일 제공업체는 다층적인 사이버 보안과 지속적인 소프트웨어 업그레이드를 보장하고 있습니다. 대조적으로, 규제 당국이 데이터 상주지를 의무화하거나 지연 시간에 민감한 피더 자동화에 로컬 연산 능력이 필요한 경우에는 여전히 On-Premise 배포가 이루어지고 있습니다. 지멘스의 그리드 소프트웨어 매출이 이미 18억 1,000만 달러를 넘어섰기 때문에 투자는 일회성 라이선스가 아닌 지속적인 인사이트를 통해 수익을 창출하는 ‘애널리틱스 애즈 어 서비스(AaaS)’ 구독 모델로 전환되고 있습니다.
가상 발전소(VPP)의 도입 확대는 클라우드 모델이 확장성 면에서 더 뛰어난 이유를 여실히 보여줍니다. 미국 에너지부는 2030년까지 VPP의 총 용량을 80-160기가와트로 늘리겠다는 목표를 세웠으며, 거의 모든 플랫폼이 수백만 대의 기기에 걸친 확률적 최적화를 수행하기 위해 분산형 클라우드 마이크로 서비스에 의존하고 있습니다. 이러한 요구 사항이 점점 더 엄격해짐에 따라, 클라우드 배포용 스마트 그리드 데이터 분석 시장 규모는 2031년까지 103억 5,000만 달러에 달할 것으로 예측되며, 이는 On-Premise 방식의 총액보다 3배 이상 큰 규모에 이를 것으로 전망됩니다.
2025년에는 계량 분석이 매출의 39.65%를 차지할 것으로 예상되며, 이는 전력 회사가 전통적으로 청구 정확성, 전력 도난 감지 및 시간대별 요금 체계 설계에 중점을 두어 왔음을 반영합니다. 그러나 사업자들이 변압기, 리클로저, 전력 전자 장치의 상태를 기반으로 한 유지보수를 우선시함에 따라, 자산 및 그리드 에지 분석이 연평균 성장률(CAGR) 13.35%로 가장 빠르게 성장하고 있습니다. IBM의 조사에 따르면, 디지털화가 진전된 유틸리티자의 70%는 이미 AI를 활용하여 유지보수 작업 일정을 수립하고 있으며, 이를 통해 계획 외 정전을 23% 줄이고 있습니다.
엣지 컴퓨팅과 AI의 융합이 핵심입니다. 현재 센서에는 경량 신경망이 내장되어 있어, 로컬에서 이상을 감지하고 위험도가 높은 사건만 클라우드로 전송합니다. 이러한 계층형 아키텍처를 통해 대역폭 비용을 절감하면서도 1초 이내에 고장 위치를 특정할 수 있습니다. 그 결과, 자산 인텔리전스 분야의 스마트 그리드 데이터 분석 시장 규모는 2031년까지 47억 5,000만 달러에 달할 것으로 예측되며, 이는 총 지출의 29.40%를 차지하여 예방적 그리드 관리로의 전환을 반영하고 있습니다.
지역별 분석
북미는 AMI 도입이 성숙 단계에 접어들었고, 도매 시장 개혁, 그리고 분산형 에너지 자원(DER)의 조정을 장려하는 연방 정부의 투자 세액 공제 덕분에 2025년에는 스마트 그리드 데이터 분석 시장의 36.65%를 차지하며 가장 큰 수익을 창출했습니다. 이 지역의 전력 회사들은 분석 서비스 구독을 요금 체계에 기반한 신청에 통합하는 사례가 늘어나고 있어 안정적인 비용 회수를 확보하고 있습니다. 캐나다의 배터리 제조를 위한 새로운 AI 연구개발 허브는 지역 생태계를 더욱 강화하고, 현지 공급업체를 EV 공급망의 주요 고객과 가까운 위치에 자리매김하고 있습니다.
아시아태평양은 가장 빠른 성장세를 보이고 있으며, 2031년까지 연평균 성장률(CAGR)은 13.26%로 예측됩니다. 중국의 국가전망공사는 초고압 프로젝트의 모든 단계에 분석 기술을 통합하고 있는 반면, 인도의 ‘배전 부문 개혁 계획(Revamped Distribution Sector Scheme)’은 피더의 디지털화에 400억 달러를 배정하고 있습니다. 말레이시아의 AI 기반 충전 시범 사업은 신흥 경제국들이 기존 인프라를 건너뛰고 클라우드 네이티브 솔루션을 채택하는 모습을 보여줍니다. 그 결과, 스마트 그리드 데이터 분석 시장 규모에 대한 이 지역의 기여도는 2031년까지 거의 두 배로 증가하여 44억 5,000만 달러를 넘어설 전망입니다.
유럽은 엄격한 탈탄소화 규제와 상호 운용성을 의무화하는 데이터 스페이스 이니셔티브의 혜택을 받고 있습니다. 독일의 98.2%라는 명령 성공률 벤치마크는 유럽 전역의 기술적 성숙도를 입증하고 있습니다. 남유럽에서 오픈 에너지 데이터에 대한 중시는 배전 회사들이 실시간 지표를 제3자 서비스 제공업체에 공개하는 표준화된 분석 기술을 채택하도록 촉진하고 있습니다.
남미, 중동 및 아프리카 3개 지역을 합친 현재 수익 점유율은 10% 미만이지만, 전기화율 상승과 재생에너지 목표 상향이 시범 도입을 촉진하고 있습니다. 칠레와 아랍에미리트의 전력 회사는 현재 태양광 발전 보급률의 높은 수준을 안정화하기 위해 PMU 기반 분석을 통합하고 있으며, 통신 백홀이 개선되면 벤더의 사업 확장을 위한 유망한 시장이 될 것임을 시사하고 있습니다.
기타 혜택:
- 엑셀 형식 시장 예측(ME) 시트
- 3개월간 애널리스트 지원
자주 묻는 질문
목차
제1장 서론
제2장 조사 방법
제3장 주요 요약
제4장 시장 구도
제5장 시장 규모와 성장 예측
제6장 경쟁 구도
제7장 시장 기회와 향후 동향
LSH 26.08.25According to Mordor Intelligence, the smart grid data analytics market size was valued at USD 8.25 billion in 2025 and estimated to grow from USD 9.23 billion in 2026 to reach USD 16.15 billion by 2031, at a CAGR of 11.85% during the forecast period (2026-2031).
This report is Segmented by Deployment (Cloud-Based and On-Premise), Solution (Transmission and Distribution Network, Metering Analytics, and More), Application (Advanced Metering Infrastructure Analysis, Demand Response Analysis, and More), End-User Vertical (Public Utilities and Municipalities, Investor-Owned Utilities, and More), and Geography. The Market Forecasts are Provided in Terms of Value (USD).
Global Smart Grid Data Analytics Market Trends and Insights
Utility AMI Roll-outs Hitting Critical Mass
Comprehensive AMI deployments now stream millions of time-stamped meter readings daily, giving utilities unprecedented visibility into low-voltage networks. Germany's 98.2% success rate in remote power-limitation commands proved that next-generation meters support near-real-time grid interventions. Utilities are therefore scaling analytics engines that ingest 150,000 data points per hour per feeder to predict overloads, preempt equipment failures, and refine tariff structures. A pilot across 20 substations and 184 feeders demonstrated that event-based analytics trimmed unscheduled maintenance by 28% and deferred USD 4 million in capex.
Shift to Cloud-Native Grid-Edge Analytics
Connecting smart meters to 5G backhaul cuts latency to single-digit milliseconds, enabling edge devices to filter noise and forward only high-value events to the cloud. Utilities avoid building costly data centers and instead subscribe to elastic processing power that runs AI models for topology optimization or volt-var control. Siemens already books over EUR 1.7 billion (USD 1.81 billion) in software-centric revenue by bundling its grid applications into a secure cloud layer.
Legacy SCADA/MDMS Interoperability Gaps
Utilities often operate devices from dozens of vendors, each using proprietary protocols. Bench tests on digital substations uncovered handshake issues that forced operators to purchase middleware gateways, inflating integration budgets by 17%. The need for rigorous cyber-physical validation extends project timelines as utilities test edge-to-cloud data paths for deterministic performance.
Other drivers and restraints analyzed in the detailed report include:
- Mandatory Decarbonization Reporting by TSOs and DSOs
- AI-Optimized EV-to-Grid Load Balancing Pilots
- Rising Analytics-Traffic Backhaul Costs in Rural Feeders
For complete list of drivers and restraints, kindly check the Table Of Contents.
Segment Analysis
Cloud deployments captured 60.75% of the smart grid data analytics market in 2025 and are forecast to grow at 12.74% CAGR to 2031. Utilities value the ability to spin up advanced AI workloads without capital outlays, while hyperscale providers guarantee multilayer cybersecurity and continuous software upgrades. In contrast, on-premise deployments persist where regulators mandate data residency or where latency-sensitive feeder automation requires local compute. As Siemens' grid-software revenue already surpasses USD 1.81 billion, investment is shifting toward "analytics-as-a-service" subscriptions that monetize continuous insights rather than one-time licenses.
Growing adoption of virtual power plants (VPPs) illustrates why the cloud model scales better. The U.S. Department of Energy targets 80-160 GW of aggregated VPP capacity by 2030, and nearly every platform relies on distributed cloud microservices to run stochastic optimization across millions of devices. As those requirements intensify, the smart grid data analytics market size for cloud deployment is projected to capture USD 10.35 billion by 2031, more than tripling the on-premise total.
Metering analytics represented 39.65% revenue in 2025, reflecting utilities' historic focus on billing accuracy, theft detection, and time-of-use tariff design. Yet, asset and grid-edge analytics is the fastest climber at 13.35% CAGR as operators prioritize condition-based maintenance for transformers, reclosers, and power electronics. IBM's survey shows 70% of digitally mature utilities already use AI to schedule maintenance windows, cutting forced outages by 23%.
The convergence of edge computing and AI is key: sensors now embed lightweight neural networks that flag anomalies locally, forwarding only high-risk events to the cloud. This tiered architecture lowers bandwidth bills while enabling sub-second fault isolation. Consequently, the smart grid data analytics market size for asset intelligence is forecast to reach USD 4.75 billion by 2031, representing 29.40% of total spending and reflecting the shift toward proactive grid stewardship.
Complete Report Scope:
- By Deployment
- Cloud-based
- On-premise
- By Solution
- Transmission and Distribution Network
- Metering Analytics
- Customer Analytics
- Asset and Grid-Edge Analytics
- By Application
- Advanced Metering Infrastructure Analysis
- Demand Response Analysis
- Grid Optimisation and Predictive Maintenance
- Renewable and EV Integration Forecasting
- By End-user Vertical
- Public Utilities and Municipalities
- Investor-Owned Utilities (IOUs)
- Cooperative and Community Utilities
- Large Energy-Intensive Enterprises
- By Geography
- North America
- United States
- Canada
- Mexico
- South America
- Brazil
- Argentina
- Chile
- Rest of South America
- Europe
- Germany
- United Kingdom
- France
- Italy
- Spain
- Russia
- Rest of Europe
- Asia-Pacific
- China
- India
- Japan
- South Korea
- Singapore
- Malaysia
- Australia
- Rest of Asia-Pacific
- Middle East and Africa
- Middle East
- United Arab Emirates
- Saudi Arabia
- Turkey
- Rest of Middle East
- Africa
- South Africa
- Nigeria
- Rest of Africa
- Middle East
- North America
Geography Analysis
North America generated the largest revenue, holding 36.65% of the smart grid data analytics market in 2025, due to mature AMI roll-outs, wholesale market reforms, and federal investment tax credits that reward DER orchestration. Utilities here increasingly bundle analytics subscriptions into rate-based filings, ensuring stable cost recovery. Canada's new AI R&D hub for battery manufacturing further strengthens the regional ecosystem, positioning local vendors near key EV-supply-chain customers.
Asia-Pacific is the fastest mover with a projected 13.26% CAGR to 2031. China's State Grid Corporation embeds analytics in every phase of its ultra-high-voltage projects, while India's Revamped Distribution Sector Scheme allocates USD 40 billion to digitalize feeders. Malaysia's AI-based charging pilots illustrate how emerging economies leapfrog legacy infrastructure to adopt cloud-native solutions. Consequently, the region's contribution to the smart grid data analytics market size will nearly double by 2031, surpassing USD 4.45 billion.
Europe benefits from stringent decarbonization rules and data-space initiatives that mandate interoperability. Germany's 98.2% command-success benchmark validates continent-wide technical maturity. Southern Europe's emphasis on open energy data is pushing distribution companies to adopt standardized analytics that expose real-time metrics to third-party service providers.
South America and the Middle East, and Africa collectively represent under 10% of revenue today, but rising electrification and renewable targets are catalyzing pilot deployments. Utilities in Chile and the United Arab Emirates now integrate PMU-based analytics to stabilize high solar penetration, signaling fertile ground for vendor expansion once telecom backhaul improves.
- Siemens AG
- Itron Inc.
- Landis + Gyr Group AG
- Oracle Corporation
- SAS Institute Inc.
- Schneider Electric SE
- GE Vernova
- IBM Corporation
- Hitachi Energy Ltd.
- AutoGrid Systems Inc.
- Uplight Inc.
- Uptake Technologies Inc.
- Tantalus Systems Corp.
- Amdocs Ltd.
- Sensus USA Inc. (Xylem)
- Honeywell Smart Energy
- Networked Energy Services
- Grid4C Inc.
- Atonix Digital LLC
- Gridspertise S.r.l.
- Tollgrade Communications Inc.
- C3.ai Inc.
- Opower (Oracle Corporation)
- Accenture plc
- Enlit AI Ltd.
Additional Benefits:
- The market estimate (ME) sheet in Excel format
- 3 months of analyst support
TABLE OF CONTENTS
1 INTRODUCTION
- 1.1 Study Assumptions and Market Definition
- 1.2 Scope of the Study
2 RESEARCH METHODOLOGY
3 EXECUTIVE SUMMARY
4 MARKET LANDSCAPE
- 4.1 Market Overview
- 4.2 Market Drivers
- 4.2.1 Utility AMI roll-outs hitting critical mass
- 4.2.2 Shift to cloud-native grid-edge analytics
- 4.2.3 Mandatory decarbonisation reporting by TSOs and DSOs
- 4.2.4 Cyber-secure analytics for NERC-CIP and IEC 62443 compliance
- 4.2.5 AI-optimised EV-to-Grid load balancing pilots
- 4.2.6 Real-time DER orchestration requirements (solar, storage, VPPs)
- 4.3 Market Restraints
- 4.3.1 Legacy SCADA/MDMS interoperability gaps
- 4.3.2 Rising analytics-traffic backhaul costs in rural feeders
- 4.3.3 Data-ownership disputes between DSOs and customer apps
- 4.3.4 Shortage of advanced analytics talent at utilities
- 4.4 Industry Value Chain Analysis
- 4.5 Regulatory Landscape
- 4.6 Technological Outlook
- 4.7 Industry Attractiveness - Porter's Five Forces Analysis
- 4.7.1 Threat of New Entrants
- 4.7.2 Bargaining Power of Suppliers
- 4.7.3 Bargaining Power of Consumers
- 4.7.4 Threat of Substitutes
- 4.7.5 Intensity of Competitive Rivalry
- 4.8 Impact of Macroeconomic Factors on the Market
5 MARKET SIZE AND GROWTH FORECASTS (VALUES)
- 5.1 By Deployment
- 5.1.1 Cloud-based
- 5.1.2 On-premise
- 5.2 By Solution
- 5.2.1 Transmission and Distribution Network
- 5.2.2 Metering Analytics
- 5.2.3 Customer Analytics
- 5.2.4 Asset and Grid-Edge Analytics
- 5.3 By Application
- 5.3.1 Advanced Metering Infrastructure Analysis
- 5.3.2 Demand Response Analysis
- 5.3.3 Grid Optimisation and Predictive Maintenance
- 5.3.4 Renewable and EV Integration Forecasting
- 5.4 By End-user Vertical
- 5.4.1 Public Utilities and Municipalities
- 5.4.2 Investor-Owned Utilities (IOUs)
- 5.4.3 Cooperative and Community Utilities
- 5.4.4 Large Energy-Intensive Enterprises
- 5.5 By Geography
- 5.5.1 North America
- 5.5.1.1 United States
- 5.5.1.2 Canada
- 5.5.1.3 Mexico
- 5.5.2 South America
- 5.5.2.1 Brazil
- 5.5.2.2 Argentina
- 5.5.2.3 Chile
- 5.5.2.4 Rest of South America
- 5.5.3 Europe
- 5.5.3.1 Germany
- 5.5.3.2 United Kingdom
- 5.5.3.3 France
- 5.5.3.4 Italy
- 5.5.3.5 Spain
- 5.5.3.6 Russia
- 5.5.3.7 Rest of Europe
- 5.5.4 Asia-Pacific
- 5.5.4.1 China
- 5.5.4.2 India
- 5.5.4.3 Japan
- 5.5.4.4 South Korea
- 5.5.4.5 Singapore
- 5.5.4.6 Malaysia
- 5.5.4.7 Australia
- 5.5.4.8 Rest of Asia-Pacific
- 5.5.5 Middle East and Africa
- 5.5.5.1 Middle East
- 5.5.5.1.1 United Arab Emirates
- 5.5.5.1.2 Saudi Arabia
- 5.5.5.1.3 Turkey
- 5.5.5.1.4 Rest of Middle East
- 5.5.5.2 Africa
- 5.5.5.2.1 South Africa
- 5.5.5.2.2 Nigeria
- 5.5.5.2.3 Rest of Africa
- 5.5.5.1 Middle East
- 5.5.1 North America
6 COMPETITIVE LANDSCAPE
- 6.1 Market Concentration
- 6.2 Strategic Moves
- 6.3 Market Share Analysis
- 6.4 Company Profiles (includes Global level Overview, Market level overview, Core Segments, Financials as available, Strategic Information, Market Rank/Share for key companies, Products and Services, and Recent Developments)
- 6.4.1 Siemens AG
- 6.4.2 Itron Inc.
- 6.4.3 Landis + Gyr Group AG
- 6.4.4 Oracle Corporation
- 6.4.5 SAS Institute Inc.
- 6.4.6 Schneider Electric SE
- 6.4.7 GE Vernova
- 6.4.8 IBM Corporation
- 6.4.9 Hitachi Energy Ltd.
- 6.4.10 AutoGrid Systems Inc.
- 6.4.11 Uplight Inc.
- 6.4.12 Uptake Technologies Inc.
- 6.4.13 Tantalus Systems Corp.
- 6.4.14 Amdocs Ltd.
- 6.4.15 Sensus USA Inc. (Xylem)
- 6.4.16 Honeywell Smart Energy
- 6.4.17 Networked Energy Services
- 6.4.18 Grid4C Inc.
- 6.4.19 Atonix Digital LLC
- 6.4.20 Gridspertise S.r.l.
- 6.4.21 Tollgrade Communications Inc.
- 6.4.22 C3.ai Inc.
- 6.4.23 Opower (Oracle Corporation)
- 6.4.24 Accenture plc
- 6.4.25 Enlit AI Ltd.
7 MARKET OPPORTUNITIES AND FUTURE TRENDS
- 7.1 White-Space and Unmet-Need Assessment


