

|
시장보고서
상품코드
2114148
결제 게이트웨이 : 시장 점유율 분석, 업계 동향과 통계, 성장 예측(2026-2031년)Payment Gateway - Market Share Analysis, Industry Trends & Statistics, Growth Forecasts (2026 - 2031) |
||||||
 Mordor Intelligence
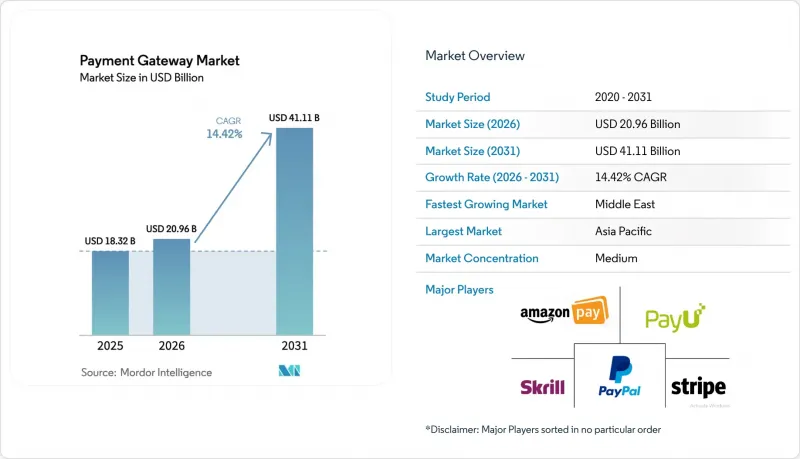
Mordor Intelligence에 따르면 결제 게이트웨이 시장 규모는 2025년에 183억 2,000만 달러로 평가되며, 2026년 209억 6,000만 달러에서 2031년까지 411억 1,000만 달러에 달할 것으로 예측되고 있으며, 예측 기간(2026-2031년)에 CAGR은 14.42%에 달할 전망입니다.
이 보고서는 유형별(호스팅형 및 자체 호스팅형), 기업 규모별(중소기업(SME) 및 대기업), 채널별(온라인/웹, 모바일 앱 내, 매장내 POS(옴니채널)), 최종사용자 산업(소매·E-Commerce,여행·호스피탈리티, 은행·금융 서비스·보험(BFSI) 등) 및 지역별로 분류되어 있습니다. 시장 예측은 금액(달러) 기준으로 제시되어 있습니다.
글로벌 결제 게이트웨이 시장의 동향 및 인사이트
실시간 결제 인프라의 폭발적인 확장이 아시아태평양의 결제 게이트웨이 도입을 가속화
인도의 ‘Unified Payments Interface(UPI)’는 2024년에 1,310억 건의 거래를 처리하며 전년 대비 58% 증가를 기록했습니다. 한편, 태국의 ‘PromptPay’는 2025년 중반까지 등록 사용자 수가 5,600만 명을 돌파했습니다. 이러한 즉시 결제 네트워크는 거래당 비용을 40-60 베이시스 포인트 절감하고 실시간 결제를 실현함으로써 가맹점의 유동성을 높이고 있습니다. 싱가포르의 ‘PayNow Corporate’는 B2B(기업 간) 청구서 적용 범위를 확대하여, 공급업체가 무역 신용 한도를 이용하지 않아도 되도록 유도하고 있습니다. 이러한 결제 네트워크를 통합한 게이트웨이는 카드 중심의 경쟁사들에 비해 가격 면에서 우위를 점하고 있으며, 이러한 추세는 현재 사우디아라비아의 ‘Mada’와 나이지리아의 ‘Instant Payment’ 시스템으로도 확산되고 있습니다.
국경을 넘는 E-Commerce의 성장이 유럽 중소기업의 다통화 라우팅 수요를 견인
2024년, 유럽 중소기업의 국경 간 온라인 매출은 890억 유로(950억 달러)에 달해 2023년 대비 19% 증가했으나, 가맹점의 42%는 환전 과정에서 발생하는 마찰이 성장의 장벽이라고 지적하고 있습니다. 동적 통화 변환 및 지능형 아퀴어러 라우팅을 제공하는 결제 게이트웨이는 환전 수수료를 1.5% 미만으로 억제하여 가맹점에 상당한 이익률 향상을 가져다주고 있습니다. 2024년에는 1만 8,000개의 유럽 중소기업이 Stripe의 다중 통화 결제 서비스를 도입한 반면, Adyen의 머신러닝 엔진을 통해 국경 간 거래의 승인률이 2.4포인트 향상되었습니다. 유럽연합(EU)의 ‘디지털 서비스법’에 따라 수수료의 투명한 공개가 의무화되면서, 비용 효율적인 결제 인프라에 대한 수요가 높아지고 있습니다.
스킴 수수료 상승이 소액 거래 게이트웨이의 이익률을 압박
Visa와 Mastercard는 2024년 4월, 인터체인지 수수료를 평균 8베이시스포인트 인상하여 5달러 구매에 드는 총 처리 비용을 4.2% 이상으로 끌어올렸습니다. 디지털 상품을 취급하는 사업자들은 가장 심각한 압박에 직면해 있으며, 게이트웨이 사업자들은 고객 이탈을 막기 위해 수수료 인상분의 최대 절반을 흡수하고 있습니다. 페이팔(PayPal)은 거래 마진이 140베이시스포인트 축소되었다고 보고했으며, 그중 60베이시스포인트는 결제 네트워크 수수료 인상에 기인한 것입니다. 실시간 계좌 간 송금은 비용 절감으로 이어지지만, 유럽과 북미에서는 여전히 분산된 상태가 지속되고 있습니다.
부문 분석
자체 호스팅형 게이트웨이는 2026-2031년까지 연평균 성장률(CAGR) 16.46%로 확대될 것으로 예측되며, 이는 결제 게이트웨이 시장 전체의 성장률을 크게 상회할 전망입니다. 대규모 가맹점은 연간 5만-15만 달러의 PCI DSS 레벨 1 인증 비용을 감수하고 있습니다. 이는 토큰화 로직에 대한 직접적인 접근을 통해 과잉 판매를 14% 줄일 수 있고, 기업 자원 계획(ERP)과의 더 깊은 통합이 가능하기 때문입니다. 2025년에 결제 게이트웨이 시장의 56.66% 점유율을 차지한 호스팅형 솔루션은 신속한 도입과 규정 준수 통합 측면에서 여전히 매력적이지만, 블랙박스적인 특성으로 인해 사기 방지 필터를 개별적으로 조정하는 데에는 한계가 있습니다.
하이브리드 모델은 이러한 격차를 좁혀가고 있습니다. Stripe Elements는 호스팅형 체크아웃 프론트엔드를 제공하면서도 토큰을 가맹점 측의 백엔드로 전송함으로써, 통합의 용이성과 데이터 소유권 간의 균형을 맞추고 있습니다. 바젤 III 자본 규제에서는 외부 프로세서에 대한 의존도가 불리하게 취급되므로 금융 서비스 기업은 이 아키텍처를 선호합니다. Worldpay의 화이트 라벨 게이트웨이 소프트웨어 개발 키트(SDK)를 통해 은행은 자사의 소비자용 앱 내에 결제 기능을 통합할 수 있게 되었으며, 유럽에서의 시범 운영에서 앱내 결제 처리액이 22% 증가했습니다.
2025년 결제 게이트웨이 시장의 거래액 중 65.62%를 중소기업이 차지하고 있으며, 이는 초기 소프트웨어 비용이 필요 없는 노코드(no-code) 툴와 ‘성장에 따른 과금’ 계약에 힘입은 결과입니다. 한편, 대기업은 2031년까지 연평균 성장률(CAGR) 15.82%로 성장할 것으로 예상되며, 기존 워크플로우에 오케스트레이션 및 재무 관리 서비스를 통합함으로써 결제 게이트웨이 시장의 규모를 확대할 전망입니다. Stripe의 기업용 번들 연간 계약액은 평균 42만 달러인 반면, 중소기업용은 8,000달러로, 수익 창출 가능성이 높다는 점이 부각되고 있습니다.
오케스트레이션 툴이 주목받고 있습니다. Checkout.com의 ‘Flow’는 게이트웨이와 인수사 간에 트래픽을 분산시켜 처리 비용을 18% 절감하고 승인률을 높이고 있습니다. 기술적 자원이 제한적인 중소기업은 올인원 대시보드를 선호하는 경향이 있습니다. Square는 BNPL(후불) 및 로열티 모듈을 단일 포털에 통합한 후, 2024년에 북미에서 34만 개의 신규 가맹점을 확보했습니다. SOC 2 Type II와 같은 보안 인증은 여전히 하이엔드 부문에서 차별화 요인으로 작용하며, 소규모 제공업체를 시장에서 배제하는 역할을 하고 있습니다.
지역별 분석
아시아태평양은 2025년에 전 세계 매출의 39.74%를 차지할 것으로 예상되며, 이를 주도한 알리페이, 위챗페이, 그리고 인도의 UPI는 2024년에 각각 1,200억 건 이상, 1,310억 건의 거래를 처리했습니다. QR코드의 광범위한 보급과 정부가 지원하는 즉시 결제 시스템의 결합이 이 지역의 주도적 지위를 공고히 하고 있습니다.
중동 지역은 2031년까지 연평균 성장률(CAGR) 16.79%를 기록할 것으로 예상되며, 이는 결제 게이트웨이 시장에서 지역별 가장 높은 성장 속도입니다. 사우디아라비아의 ‘비전 2030’은 2025년까지 거래의 70%를 현금 없이 처리하는 것을 목표로 하고 있으며, 아랍에미리트(UAE)는 국경을 넘는 결제를 효율화하기 위해 14개 은행과 공동으로 중앙은행 디지털 화폐(CBDC) 시범 운영을 진행하고 있습니다. 각국의 규제에 따라 아퀴라이어의 비접촉식 인프라 투자가 촉진되고 있으며, 소매업 및 호텔·관광 업계 전반에 걸쳐 결제 게이트웨이 도입이 가속화되고 있습니다.
북미는 2025년 매출의 28%를 차지했으나, 카드 보급률이 포화 상태에 가까워짐에 따라 성장 속도는 둔화되고 있습니다. 유럽은 PSD2에 힘입은 시스템 업그레이드의 혜택을 누리고 있으며, 2025년 중반까지 가맹점의 78%가 3-D Secure 2.2로 전환했습니다. 남미에서는 디지털화가 급속히 진행되고 있으며, 브라질의 ‘Pix’는 2024년에 420억 건의 즉시 결제를 처리했습니다. 아프리카 시장은 여전히 세분화되어 있지만, 나이지리아의 ‘Paystack’과 가나의 ‘GhIPSS’ 간의 협력은 국경을 초월한 즉시 결제 경로 구축을 향한 초기 조짐으로 보입니다.
기타 혜택:
- 엑셀 형식의 시장 예측(ME) 시트
- 3개월간의 애널리스트 지원
자주 묻는 질문
목차
제1장 서론
제2장 조사 방법
제3장 개요
제4장 시장 구도
제5장 시장 규모와 성장 예측
제6장 경쟁 구도
제7장 시장 기회와 향후 전망
KSA 26.08.26According to Mordor Intelligence, the payment gateway market size was valued at USD 18.32 billion in 2025 and is estimated to grow from USD 20.96 billion in 2026 to reach USD 41.11 billion by 2031, at a CAGR of 14.42% during the forecast period (2026-2031).
This report is Segmented by Type (Hosted, and Self-Hosted), Enterprise Size (Small and Medium Enterprises (SME), and Large Enterprises), Channel (Online / Web, Mobile In-App, and In-Store POS (Omnichannel)), End-User Industry (Retail and E-Commerce, Travel and Hospitality, Banking, Financial Services and Insurance (BFSI), and More), and Geography. The Market Forecasts are Provided in Terms of Value (USD).
Global Payment Gateway Market Trends and Insights
Explosion of Real-Time Payment Rails Accelerating Gateway Adoption in Asia Pacific
India's Unified Payments Interface processed 131 billion transactions in 2024, up 58% year on year, while Thailand's PromptPay surpassed 56 million registered users by mid-2025. These instant-settlement networks cut per-transaction costs by 40-60 basis points and deliver real-time settlement, boosting merchant liquidity. Singapore's PayNow Corporate broadened the scope to business-to-business invoices, encouraging suppliers to forego trade-credit lines. Gateways that integrate these rails achieve a pricing edge over card-centric rivals, a trend now spreading to Saudi Arabia's Mada and Nigeria's Instant Payment system.
Cross-Border E-Commerce Growth Driving Demand for Multi-Currency Routing Among European SMEs
European SMEs booked EUR 89 billion (USD 95 billion) in cross-border online sales in 2024, a 19% jump from 2023, yet 42% of merchants cited currency-conversion friction as a growth barrier. Gateways offering dynamic currency conversion and intelligent acquirer routing shrink foreign-exchange markups to below 1.5%, saving merchants substantial margin. Stripe's multi-currency settlement attracted 18,000 European SMEs in 2024, while Adyen's machine-learning engine lifted authorization by 2.4 percentage points on cross-border flows. The European Union's Digital Services Act now enforces transparent fee disclosure, intensifying demand for cost-efficient payment rails.
Rising Scheme Fees Squeezing Gateway Margins for Micro-Transactions
Visa and Mastercard lifted interchange fees by an average of eight basis points in April 2024, raising the all-in processing cost of a USD 5 purchase above 4.2%. Digital goods merchants face the steepest squeeze, and gateway providers have absorbed up to half of the fee increase to curb churn. PayPal reported a 140-basis-point contraction in its transaction margin, with scheme-fee inflation accounting for 60 basis points. Real-time account-to-account transfers offer cost relief but remain fragmented in Europe and North America.
Other drivers and restraints analyzed in the detailed report include:
- Regulatory Mandates such as PSD2-SCA Forcing Upgrades to Tokenized 3-DS-Ready Gateways
- Surge in BNPL Checkout Options Expanding API Calls Per Transaction
- Persistent Cross-Border Chargeback Fraud Undermining Merchant Trust
For complete list of drivers and restraints, kindly check the Table Of Contents.
Segment Analysis
Self-hosted gateways are projected to expand at a 16.46% CAGR from 2026 to 2031, comfortably outpacing the overall payment gateway market growth. Larger merchants tolerate the annual USD 50,000-150,000 PCI DSS Level 1 certification cost because direct access to tokenization logic trims overselling by 14% and supports deeper enterprise resource planning integrations. Hosted solutions, which held 56.66% payment gateway market share in 2025, remain compelling for fast deployment and bundled compliance but their black-box nature restricts bespoke fraud-filter tuning.
Hybrid models are narrowing the divide. Stripe Elements presents a hosted checkout front end but transmits tokens to the merchant's back end, balancing ease of integration with data ownership. Financial-services firms favor this architecture because Basel III capital rules penalize reliance on external processors. Worldpay's white-label gateway software development kit lets banks embed acceptance inside their consumer apps, driving a 22% lift in in-app volumes during European pilots.
SMEs accounted for 65.62% of 2025 activity in the payment gateway market, buoyed by no-code tools and pay-as-you-grow contracts that remove upfront software fees. Large enterprises, however, are set to grow at a 15.82% CAGR through 2031, expanding the payment gateway market size by layering orchestration and treasury services onto existing flows. Stripe's enterprise bundle averages USD 420,000 in annual contract value versus USD 8,000 for SMEs, underscoring the revenue potential.
Orchestration tools are top of mind. Checkout.com's Flow routes traffic across gateways and acquirers to cut processing costs 18% and improve approval ratios. SMEs, constrained by technical bandwidth, lean toward all-in-one dashboards; Square attracted 340,000 new North American merchants in 2024 after merging BNPL and loyalty modules into a single portal. Security certifications such as SOC 2 Type II remain a differentiator in the high-end segment, screening out smaller providers.
Complete Report Scope:
- By Host Type
- Hosted
- Self-Hosted
- By Enterprise Size
- Small and Medium Enterprises
- Large Enterprises
- By Channel
- Online - Web
- Mobile In-App
- In-Store POS - Omnichannel
- By End-User Industry
- Retail and E-Commerce
- Travel and Hospitality
- Banking Financial Services and Insurance
- Media and Entertainment
- Other End-User Industries
- By Geography
- North America
- United States
- Canada
- Mexico
- Europe
- Germany
- United Kingdom
- France
- Nordics
- Rest of Europe
- Asia Pacific
- China
- India
- Japan
- South Korea
- South-East Asia
- Rest of Asia Pacific
- South America
- Brazil
- Argentina
- Rest of South America
- Middle East
- Saudi Arabia
- United Arab Emirates
- Turkey
- Rest of Middle East
- Africa
- South Africa
- Nigeria
- Rest of Africa
- North America
Geography Analysis
Asia Pacific commanded 39.74% of global revenue in 2025, anchored by Alipay, WeChat Pay, and India's UPI clearing more than 120 billion, and 131 billion transactions respectively in 2024. Widespread QR-code adoption coupled with government-backed instant rails cements the region's leadership position.
The Middle East is projected to register a 16.79% CAGR through 2031, the highest regional pace in the payment gateway market. Saudi Arabia's Vision 2030 calls for 70% cashless transactions by 2025, and the United Arab Emirates is piloting a CBDC with 14 banks to streamline cross-border settlements. Local mandates have spurred acquirer investment in contactless infrastructure, catalyzing gateway adoption across retail and hospitality.
North America contributed 28% of 2025 revenue but is slowing as card penetration nears saturation. Europe benefits from PSD2-driven upgrades; 78% of merchants migrated to 3-D Secure 2.2 by mid-2025. South America's digital sprint continues, with Brazil's Pix handling 42 billion instant payments in 2024. Africa remains fragmented, yet Nigeria's Paystack integration with Ghana's GhIPSS is an early sign of cross-border instant-payment corridors.
- PayPal Holdings Inc.
- Stripe Inc.
- PayU Payments Private Limited (Naspers Limited)
- Amazon Payments Inc.
- Block Inc.
- Adyen N.V.
- Alipay.com Co. Ltd.
- WePay Inc. (JPMorgan Chase Bank N.A.)
- CyberSource Corporation (Visa Inc.)
- Checkout.com Group S.A.
- Razorpay Software Private Limited
- Paytm Payments Services Limited
- Mollie B.V.
- Ingenico Group S.A. (Worldline S.A.)
- Payoneer Inc.
- Worldpay LLC (Fidelity National Information Services Inc.)
- Klarna Bank AB
- BlueSnap Inc.
- Rapyd Financial Network Ltd.
- Nuvei Corporation
- dLocal Ltd.
Additional Benefits:
- The market estimate (ME) sheet in Excel format
- 3 months of analyst support
TABLE OF CONTENTS
1 INTRODUCTION
- 1.1 Study Assumptions and Market Definition
- 1.2 Scope of the Study
2 RESEARCH METHODOLOGY
3 EXECUTIVE SUMMARY
4 MARKET LANDSCAPE
- 4.1 Market Overview
- 4.2 Market Drivers
- 4.2.1 Explosion of Real-Time Payment Rails Accelerating Gateway Adoption in Asia Pacific
- 4.2.2 Cross-Border E-Commerce Growth Driving Demand for Multi-Currency Routing Among European SMEs
- 4.2.3 Regulatory Mandates such as PSD2-SCA Forcing Upgrades to Tokenised 3-DS-Ready Gateways
- 4.2.4 Surge in BNPL Checkout Options Expanding API Calls Per Transaction
- 4.2.5 Contactless-Wallet Boom in Grocery Chains Spurring Omnichannel Gateway Deployment
- 4.2.6 AI-Powered Dynamic Risk Scoring Enabling Frictionless Authentication for High-Value Transactions
- 4.3 Market Restraints
- 4.3.1 Rising Scheme Fees Squeezing Gateway Margins for Micro-Transactions
- 4.3.2 Persistent Cross-Border Chargeback Fraud Undermining Merchant Trust
- 4.3.3 Data-Localisation Laws in India Brazil and Russia Complicating Token-Vault Architectures
- 4.3.4 Limited IPv6 Adoption Causing Packet Fragmentation Issues in Low-Latency Payment APIs
- 4.4 Industry Value Chain Analysis
- 4.5 Regulatory Outlook
- 4.6 Impact of Macroeconomic Factors on the Market
- 4.7 Porter's Five Forces Analysis
- 4.7.1 Threat of New Entrants
- 4.7.2 Bargaining Power of Buyers
- 4.7.3 Bargaining Power of Suppliers
- 4.7.4 Threat of Substitutes
- 4.7.5 Competitive Rivalry
5 MARKET SIZE AND GROWTH FORECASTS (VALUE)
- 5.1 By Host Type
- 5.1.1 Hosted
- 5.1.2 Self-Hosted
- 5.2 By Enterprise Size
- 5.2.1 Small and Medium Enterprises
- 5.2.2 Large Enterprises
- 5.3 By Channel
- 5.3.1 Online - Web
- 5.3.2 Mobile In-App
- 5.3.3 In-Store POS - Omnichannel
- 5.4 By End-User Industry
- 5.4.1 Retail and E-Commerce
- 5.4.2 Travel and Hospitality
- 5.4.3 Banking Financial Services and Insurance
- 5.4.4 Media and Entertainment
- 5.4.5 Other End-User Industries
- 5.5 By Geography
- 5.5.1 North America
- 5.5.1.1 United States
- 5.5.1.2 Canada
- 5.5.1.3 Mexico
- 5.5.2 Europe
- 5.5.2.1 Germany
- 5.5.2.2 United Kingdom
- 5.5.2.3 France
- 5.5.2.4 Nordics
- 5.5.2.5 Rest of Europe
- 5.5.3 Asia Pacific
- 5.5.3.1 China
- 5.5.3.2 India
- 5.5.3.3 Japan
- 5.5.3.4 South Korea
- 5.5.3.5 South-East Asia
- 5.5.3.6 Rest of Asia Pacific
- 5.5.4 South America
- 5.5.4.1 Brazil
- 5.5.4.2 Argentina
- 5.5.4.3 Rest of South America
- 5.5.5 Middle East
- 5.5.5.1 Saudi Arabia
- 5.5.5.2 United Arab Emirates
- 5.5.5.3 Turkey
- 5.5.5.4 Rest of Middle East
- 5.5.6 Africa
- 5.5.6.1 South Africa
- 5.5.6.2 Nigeria
- 5.5.6.3 Rest of Africa
- 5.5.1 North America
6 COMPETITIVE LANDSCAPE
- 6.1 Market Concentration
- 6.2 Strategic Moves
- 6.3 Market Share Analysis
- 6.4 Company Profiles (includes Global level Overview, Market level overview, Core Segments, Financials as available, Strategic Information, Market Rank/Share for key companies, Products and Services, and Recent Developments)
- 6.4.1 PayPal Holdings Inc.
- 6.4.2 Stripe Inc.
- 6.4.3 PayU Payments Private Limited (Naspers Limited)
- 6.4.4 Amazon Payments Inc.
- 6.4.5 Block Inc.
- 6.4.6 Adyen N.V.
- 6.4.7 Alipay.com Co. Ltd.
- 6.4.8 WePay Inc. (JPMorgan Chase Bank N.A.)
- 6.4.9 CyberSource Corporation (Visa Inc.)
- 6.4.10 Checkout.com Group S.A.
- 6.4.11 Razorpay Software Private Limited
- 6.4.12 Paytm Payments Services Limited
- 6.4.13 Mollie B.V.
- 6.4.14 Ingenico Group S.A. (Worldline S.A.)
- 6.4.15 Payoneer Inc.
- 6.4.16 Worldpay LLC (Fidelity National Information Services Inc.)
- 6.4.17 Klarna Bank AB
- 6.4.18 BlueSnap Inc.
- 6.4.19 Rapyd Financial Network Ltd.
- 6.4.20 Nuvei Corporation
- 6.4.21 dLocal Ltd.
7 MARKET OPPORTUNITIES AND FUTURE OUTLOOK
- 7.1 White-Space and Unmet-Need Assessment


