

|
시장보고서
상품코드
2114285
액체 질소 시장 : 시장 점유율 분석, 업계 동향 및 통계, 성장 예측(2026-2031년)Liquid Nitrogen - Market Share Analysis, Industry Trends & Statistics, Growth Forecasts (2026 - 2031) |
||||||
 Mordor Intelligence
Mordor Intelligence에 의하면, 2026년 액체 질소 시장 규모는 3억 979만 톤으로 추정되고, 2025년 2억 9,871만 톤으로부터 확대해, 2031년에는 3억 7,162만 톤에 이를 것으로 예측됩니다.
2026-2031년 연평균 성장률(CAGR) 3.71%로 성장할 것으로 전망됩니다.
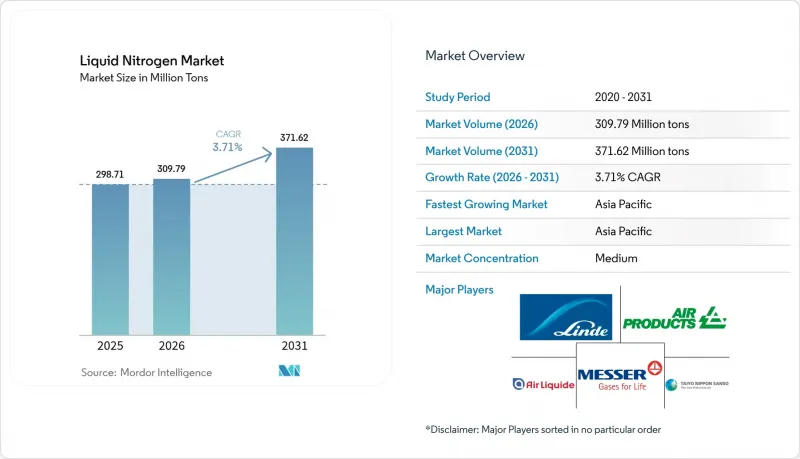
본 보고서는 저장 형태별(실린더 및 패키지 가스), 용도별(냉각제 및 냉매), 최종 사용자 산업별(화학·제약, 운송, 식품 및 음료, 일렉트로믹스 및 반도체, 기타 최종 사용자 산업), 지역별(아시아태평양, 북미, 유럽, 남미, 중동 및 아프리카)로 분류되어 있습니다. 시장 전망은 수량(톤) 단위로 제시되어 있습니다.
세계의 액체 질소 시장 동향 및 인사이트
화학·제약 업계 수요 증가
액체 질소는 현대 원료의약품의 품질을 결정짓는 불활성 분위기, 급속 결정화 및 무수분 처리의 기반이 되고 있습니다. 연속 생산 라인에서는 화학적 오염을 수반하지 않으면서 액체 질소만이 제공할 수 있는 순간적인 온도 변화가 요구됩니다. 연속 공정에 대한 규제 당국의 장려로 인해 기업들이 규모 확대 일정에 따른 위험을 줄일 수 있게 되면서, 그 도입이 가속화되고 있습니다. 제약 거점에서 수요 집중은 전용 파이프라인 설치를 정당화하고, 배송 비용을 절감하는 동시에 공급업체와 고객 간의 파트너십을 공고히 하고 있습니다. 또한, 이 부문은 극저온 비활성화를 생산성 향상 요인으로 간주하는 아시아태평양의 특수 화학제품 생산 확대의 혜택도 받고 있습니다. 엄격한 순도 기준, 바이오의약품의 복잡화, 그리고 인근 지역에서의 물류가 결합되어 주요 가스 생산 업체의 판매량을 끌어올리는 선순환이 형성되고 있습니다.
바이오의약품 콜드체인을 위한 초저온 물류 확대
맞춤형 의료는 콜드체인에 전례 없는 복잡성을 가져오고 있습니다. 세포 치료나 유전자 치료에는 -80°C에서 -196°C의 운송 조건이 필요하지만, 액체 질소는 신뢰할 수 있는 상변화 특성을 통해 이 온도 범위를 실현합니다. 장비 제조업체들은 온도 이탈 위험이 발생할 경우 취급자에게 경고하는 IoT 원격 측정 기능을 추가하여 규제 당국 및 보험사의 신뢰를 높이고 있습니다. 제약 스폰서들은 분산형 제조 거점을 구축하고 있으며, 각 거점에는 액체 질소 탱크, 기화기, 페일세이프 경보 장치가 필요합니다. 수송되는 바이오의약품의 가치가 높기 때문에 물류 사업자는 가스비보다 손실로 인한 피해액이 더 크다는 점을 감안하여 높은 질소 가격을 수용하고 있습니다. 수송량은 북미가 대부분을 차지하고 있지만, 승인 파이프라인이 확대됨에 따라 유럽 및 아시아 거점의 규모도 확대되고 있습니다.
액체 질소 플랜트의 안전성 및 규제 준수 비용
당국은 몇 건의 극저온 사고를 계기로 감독을 강화하고, 환기 개선, 산소 결핍 모니터링 및 운영자 자격 인증을 의무화했습니다. OSHA(미국 직업안전보건청)의 검사 빈도가 증가함에 따라 가스 생산업체 및 유통업체의 규정 준수 예산이 늘어나고 있습니다. 소규모 사업자들은 설비 업그레이드 및 보험료 인상에 필요한 자금을 조달하는 데 어려움을 겪고 있으며, 그 결과 더 큰 규모의 판매 실적을 통해 비용을 상쇄할 수 있는 대기업에 플랜트를 매각하는 사례가 증가하고 있습니다. 이러한 조치는 작업장 안전성을 향상시키는 한편, 시장 진입 장벽을 높이고 신규 생산 능력 도입을 지연시킬 가능성이 있어, 액체 질소 시장 전체의 성장을 소폭 둔화시키는 요인이 되고 있습니다.
부문 분석
2025년에는 패키지 가스가 액체 질소 시장에서 65.48%의 점유율을 차지하며 시장을 주도했습니다. 이는 석유 화학, 야금, 전자 분야 고객들이 보이는 대량적이고 안정적인 소비 패턴에 부합하는 비용 효율적인 탱커를 통한 배송이 요인으로 작용했습니다. 벌크 저장 탱크는 매일 보충이 가능하며, 취급 작업과 증기 손실을 최소화합니다. 산업 단지 인근의 물류 허브에서는 철도 부선 및 전용 트럭을 활용하여 톤당 운송 비용을 낮게 유지하고 있습니다. 현장의 배관 및 제어 시스템이 벌크 유량에 최적화되어 있어 고객 유지율도 높은 수준을 유지하고 있습니다.
현재 규모는 작지만, 실린더 저장 방식은 액체 질소 시장에서 가장 빠르게 성장하는 분야이며, 2031년까지 연평균 성장률(CAGR)이 4.15%를 나타낼 것으로 예측됩니다. 이는 연구소, 의료 기관, 수탁 제조 시설 등이 휴대성과 허가 절차의 간소화를 중요시하기 때문입니다. 실린더 기반의 마이크로 벌크 솔루션은 영구적인 탱크를 설치하지 않고도 사용자에게 모듈식 확장성을 제공합니다. 공급업체들은 충전 수준을 전송하는 원격 측정 캡을 활용하여 동적인 배송 경로를 계획하고 재고 부족을 최소화하고 있습니다. 이러한 성장 양극화는 벌크 탱커 인프라와 기동성이 뛰어난 실린더 서비스를 조화시킬 수 있는 기업이 가장 광범위한 부문을 커버할 수 있음을 시사합니다.
지역별 분석
아시아태평양은 2025년에 액체 질소 시장 점유율의 46.10%를 차지한 것으로 평가되었으며, 2031년까지 연평균 성장률(CAGR) 4.36%로 확대될 것으로 전망되어, 가장 크고 가장 빠르게 성장하는 지역이라는 이중 지위를 공고히 하고 있습니다. 중국은 500억 달러가 넘는 웨이퍼 제조 투자를 주도하고 있으며, 각 팹에서는 에칭 및 테스트를 위해 산소 농도가 1ppm 미만인 순도의 질소가 요구되고 있습니다. 인도에서는 바이오의약품의 급증으로 수요가 증가하고 있으며, 새로운 백신 생산 라인에서는 자동 기상 저장 시스템과 함께 벌크 질소 탱크가 도입되고 있습니다. 지방 자치 단체는 산업 단지 내 파이프라인 회랑에 보조금을 지급하고 있으며, 이를 통해 전용 수요 클러스터가 형성되고 있습니다.
북미에서는 멕시코만 연안 지역의 석유화학 산업, 중서부의 대규모 식품 가공 산업, 그리고 매사추세츠주와 노스캐롤라이나주의 바이오의약품 허브를 기반으로 성숙 단계에 접어들었음에도 불구하고 견조한 소비가 유지되고 있습니다. 의료 센터와 대형 가스 회사 간의 장기 계약을 통해 벌크 질소의 안정적인 공급이 확보되는 한편, 외래 암 치료 수요의 확대에 따라 가스통 사용량이 증가하고 있습니다. 플랜트 확장에는 에너지 회수 터빈과 첨단 흡착 사이클이 도입되어, 전력 소비 강도를 15% 절감함으로써 전기 요금 급등 속에서도 경쟁력을 유지하고 있습니다.
유럽에서는 안정성과 혁신성의 균형을 맞추면서, 초전도 송전망 시범 사업 및 첨단 치료법을 위한 공급망으로 무게 중심을 옮기고 있습니다. 엄격한 안전 기준으로 인해 운영 비용은 증가하고 있지만, 높은 가처분 소득이 미식 업계 및 수제 음료 분야에서 고품질 질소의 용도를 뒷받침하고 있습니다. 남미 및 중동 및 아프리카은 공급량 면에서는 뒤처져 있지만, 식품 수출 및 석유화학 단지를 위한 패키지 가스 저장 시설 설치가 가속화되고 있습니다. 브라질의 질소 냉동 새우 수출과 사우디아라비아의 폴리머 프로젝트는 유통 밀도를 확대할 수 있는 초기 핵심 수요를 상징합니다. 이러한 지역별 다양성은 전 세계 공급업체들이 포트폴리오 수익을 극대화하기 위해서는 규제, 인프라 및 용도의 성숙도 차이를 능숙하게 극복해야 함을 보여줍니다.
기타 혜택 :
- 엑셀 형식 시장 예측(ME) 시트
- 3개월간의 애널리스트 지원
자주 묻는 질문
목차
제1장 서론
제2장 조사 방법
제3장 주요 요약
제4장 시장 구도
제5장 시장 규모 및 성장 예측
제6장 경쟁 구도
제7장 시장 기회 및 향후 전망
AJY 26.08.26According to Mordor Intelligence, the liquid nitrogen market size in 2026 is estimated at 309.79 Million tons, growing from 2025 value of 298.71 Million tons with 2031 projections showing 371.62 Million tons, growing at 3.71% CAGR over 2026-2031.
This report is Segmented by Storage Type (Cylinder and Packaged Gas), Function (Coolant and Refrigerant), End-User Industry (Chemical and Pharmaceutical, Transportation, Food and Beverage, Electronics and Semiconductor, and Other End-User Industries), and Geography (Asia-Pacific, North America, Europe, South America, and Middle East and Africa). The Market Forecasts are Provided in Terms of Volume (Tons).
Global Liquid Nitrogen Market Trends and Insights
Increasing Demand from Chemical and Pharmaceutical Industry
Liquid nitrogen underpins inert atmospheres, rapid crystallization, and moisture-free handling that define modern active pharmaceutical ingredient quality. Continuous manufacturing lines require instantaneous temperature shifts that only liquid nitrogen can provide without chemical contamination. Regulatory encouragement for continuous processes accelerates adoption as companies de-risk scale-up timelines. Demand density in pharmaceutical hubs justifies dedicated pipelines, lowering delivered cost and cementing supplier-customer partnerships. The segment also benefits from burgeoning specialty chemical output in the Asia-Pacific that views cryogenic inerting as a productivity multiplier. A virtuous cycle emerges in which stringent purity norms, higher biologics complexity, and proximity logistics jointly lift off-take volumes for leading gas producers.
Cryogenic Logistics Expansion for Biologics Cold-Chains
Personalized medicine drives unprecedented cold-chain complexity. Cell and gene therapies need -80 °C to -196 °C transport conditions, and liquid nitrogen enables this temperature window with reliable phase behavior. Equipment makers add IoT telemetry that alerts handlers if excursion risk occurs, raising confidence among regulators and insurers. Pharmaceutical sponsors are building distributed manufacturing nodes; each node demands liquid nitrogen tanks, vaporizers, and fail-safe alarms. The high value of shipped biologics means logistics providers accept premium nitrogen pricing because loss events are costlier than gas expenditure. North America dominates volumes, yet European and Asian sites are scaling as approval pipelines widen.
Safety and Regulatory Compliance Costs for LN2 Plants
Authorities tightened oversight after several cryogenic incidents, mandating improved ventilation, oxygen-deficiency monitoring, and operator certification. OSHA inspections grew more frequent, raising compliance budgets for gas producers and distributors. Smaller operators struggle to fund upgrades and higher insurance premiums, prompting an uptick in plant divestitures to majors that can amortize costs over larger sales books. While these measures improve workplace safety, they elevate entry barriers and can delay new capacity rollouts, marginally tempering overall liquid nitrogen market growth.
Other drivers and restraints analyzed in the detailed report include:
- Rapid Uptake of LN2 Cryo-Ablation Devices in Outpatient Oncology
- Sub-Cooled LN2 Systems for Superconducting Grid Projects
- High-Efficiency Mechanical Freezers Eroding LN2 Demand
For complete list of drivers and restraints, kindly check the Table Of Contents.
Segment Analysis
Packaged gas led the liquid nitrogen market with a 65.48% liquid nitrogen market share in 2025, owing to cost-effective tanker deliveries that match the high-volume, steady-state consumption profiles of petrochemical, metallurgy, and electronics customers. Bulk storage tanks accept daily top-ups, minimizing handling and vapor loss. Logistics hubs near industrial corridors capitalize on rail sidings and dedicated truck fleets, keeping per-ton transport expense low. Customer retention is strong because site piping and control systems are optimized for bulk flow.
Though smaller today, Cylinder storage is the liquid nitrogen market's fastest riser at a 4.15% CAGR through 2031 as laboratories, medical practices, and contract manufacturing facilities prefer portability and simplified permitting. Cylinder-based micro-bulk solutions give users modular scalability without installing permanent tanks. Suppliers leverage telemetry caps that transmit fill levels, scheduling dynamic routing, and minimizing stockouts. The growth bifurcation implies that firms able to harmonize bulk tanker infrastructure with agile cylinder services will capture the widest segment spread.
Complete Report Scope:
- By Storage Type
- Cylinder
- Packaged Gas
- By Function
- Coolant
- Refrigerant
- End-User Industry
- Chemical and Pharmaceutical
- Healthcare
- Transportation
- Food and Beverage
- Electronics and Semiconductor
- Other End-user Industries
- By Geography
- Asia-Pacific
- China
- India
- Japan
- South Korea
- Rest of Asia-Pacific
- North America
- United States
- Canada
- Mexico
- Europe
- Germany
- United Kingdom
- Italy
- France
- Russia
- Rest of Europe
- South America
- Brazil
- Argentina
- Rest of South America
- Middle East and Africa
- Saudi Arabia
- South Africa
- Rest of Middle East and Africa
- Asia-Pacific
Geography Analysis
Asia-Pacific commanded 46.10% of the Liquid Nitrogen market share in 2025 and is projected to expand at a 4.36% CAGR through 2031, reinforcing its dual status as the largest and fastest-growing region. China leads wafer fabrication investments exceeding USD 50 billion, each fab demanding nitrogen purities under 1 ppm oxygen for etching and testing. India's biologics surge compounds demand, with new vaccine lines installing bulk nitrogen tanks alongside automated vapor phase storage. Local governments subsidize pipeline corridors in industrial parks, fostering captive demand clusters.
North America maintains mature yet robust consumption anchored by petrochemicals on the Gulf Coast, expansive food processing in the Midwest, and biopharmaceutical hubs in Massachusetts and North Carolina. Long-term contracts between medical centers and gas majors ensure stable bulk dispatches, while outpatient oncology drives incremental cylinder usage. Plant expansions employ energy-recovery turbines and advanced adsorption cycles, trimming electricity intensity by 15%, sustaining competitiveness amid rising power tariffs.
Europe balances stability with innovation, pivoting toward superconducting grid pilots and advanced therapy supply chains. Strict safety codes heighten operating costs, yet high disposable income supports premium nitrogen applications in gastronomy and craft beverages. South America and Middle East & Africa trail in volume but show accelerating installations of packaged gas depots serving food exports and petrochemical complexes. Brazil's nitrogen-freeze shrimp exports and Saudi Arabia's polymer projects represent early anchor loads that can scale distribution density. This geographic mosaic demonstrates that global suppliers must navigate differing regulatory, infrastructure, and application maturity levels to maximize portfolio yield.
- Air Liquide
- Air Products and Chemicals, Inc.
- Asia Industrial Gases Pte., Ltd.
- Gruppo Siad
- Gulf Cryo
- Haier Biomedical
- Iwatani Corporation
- Linde PLC
- Messer
- NEXAIR
- Southern Industrial Gas Sdn Bhd
- TAIYO NIPPON SANSO CORPORATION
- Tokyo Gas Chemicals Co., Ltd.
Additional Benefits:
- The market estimate (ME) sheet in Excel format
- 3 months of analyst support
TABLE OF CONTENTS
1 Introduction
- 1.1 Study Assumptions and Market Definition
- 1.2 Scope of the Study
2 Research Methodology
3 Executive Summary
4 Market Landscape
- 4.1 Market Overview
- 4.2 Market Drivers
- 4.2.1 Increasing demand from chemical and pharmaceutical industry
- 4.2.2 Cryogenic logistics expansion for biologics cold-chains
- 4.2.3 Rapid uptake of LN2 cryo-ablation devices in outpatient oncology
- 4.2.4 Sub-cooled LN2 systems for superconducting grid projects
- 4.2.5 On-site ASU co-product strategies boosting captive supply
- 4.3 Market Restraints
- 4.3.1 Safety and regulatory compliance costs for LN2 plants
- 4.3.2 High energy intensity / carbon footprint of cryogenic distillation
- 4.3.3 High-efficiency mechanical freezers eroding LN2 demand
- 4.4 Value Chain Analysis
- 4.5 Porter's Five Forces
- 4.5.1 Bargaining Power of Suppliers
- 4.5.2 Bargaining Power of Buyers
- 4.5.3 Threat of New Entrants
- 4.5.4 Threat of Substitutes
- 4.5.5 Degree of Competition
5 Market Size and Growth Forecasts (Volume)
- 5.1 By Storage Type
- 5.1.1 Cylinder
- 5.1.2 Packaged Gas
- 5.2 By Function
- 5.2.1 Coolant
- 5.2.2 Refrigerant
- 5.3 End-User Industry
- 5.3.1 Chemical and Pharmaceutical
- 5.3.2 Healthcare
- 5.3.3 Transportation
- 5.3.4 Food and Beverage
- 5.3.5 Electronics and Semiconductor
- 5.3.6 Other End-user Industries
- 5.4 By Geography
- 5.4.1 Asia-Pacific
- 5.4.1.1 China
- 5.4.1.2 India
- 5.4.1.3 Japan
- 5.4.1.4 South Korea
- 5.4.1.5 Rest of Asia-Pacific
- 5.4.2 North America
- 5.4.2.1 United States
- 5.4.2.2 Canada
- 5.4.2.3 Mexico
- 5.4.3 Europe
- 5.4.3.1 Germany
- 5.4.3.2 United Kingdom
- 5.4.3.3 Italy
- 5.4.3.4 France
- 5.4.3.5 Russia
- 5.4.3.6 Rest of Europe
- 5.4.4 South America
- 5.4.4.1 Brazil
- 5.4.4.2 Argentina
- 5.4.4.3 Rest of South America
- 5.4.5 Middle East and Africa
- 5.4.5.1 Saudi Arabia
- 5.4.5.2 South Africa
- 5.4.5.3 Rest of Middle East and Africa
- 5.4.1 Asia-Pacific
6 Competitive Landscape
- 6.1 Market Concentration
- 6.2 Strategic Moves
- 6.3 Market Share (%)/Ranking Analysis
- 6.4 Company Profiles (includes Global level Overview, Market level overview, Core Segments, Financials as available, Strategic Information, Market Rank/Share, Products and Services, and Recent Developments)
- 6.4.1 Air Liquide
- 6.4.2 Air Products and Chemicals, Inc.
- 6.4.3 Asia Industrial Gases Pte., Ltd.
- 6.4.4 Gruppo Siad
- 6.4.5 Gulf Cryo
- 6.4.6 Haier Biomedical
- 6.4.7 Iwatani Corporation
- 6.4.8 Linde PLC
- 6.4.9 Messer
- 6.4.10 NEXAIR
- 6.4.11 Southern Industrial Gas Sdn Bhd
- 6.4.12 TAIYO NIPPON SANSO CORPORATION
- 6.4.13 Tokyo Gas Chemicals Co., Ltd.
7 Market Opportunities and Future Outlook
- 7.1 White-space and Unmet-need Assessment


